
 ?Mathematical formulae have been encoded as MathML and are displayed in this HTML version using MathJax in order to improve their display. Uncheck the box to turn MathJax off. This feature requires Javascript. Click on a formula to zoom.
Abstract
With the advent of artificial intelligence (AI) based systems, a new era has begun. Decisions that were once made by humans are now increasingly being made by these advanced systems, with the inevitable consequence of our growing reliance on AI in many aspects of our lives. At the same time, the opaque nature of AI-based systems and the possibility of unintentional or hidden discriminatory practices and biases raises profound questions not only about the mechanics of AI, but also about how users perceive the fairness of these systems. We hypothesize that providing various explanations for AI decision-making processes and output may enhance users’ fairness perceptions and make them trust the system and adopt its decisions. Hence, we devised an online between-subject experiment that explores users’ fairness and comprehension perceptions of AI systems with respect to the explanations provided by the system, employing a case study of a managerial decision in the human resources (HR) domain. We manipulated (i) the decision-maker (AI or human); (ii) the input (candidate characteristics); (iii) the output (recommendation valence), and (iv) the explanation style. We examined the effect of the various manipulations (and individuals’ demographic and personality characteristics) using multivariate ordinal regression. We also performed a multi-level analysis of experiment components to examine the effects of the decision-maker type, explanation style, and their combination. The results suggest three main conclusions. The first conclusion is that there is a gap in users’ fairness and comprehension perception of AI-based decision making systems compared to human decision making. The second conclusion is that knowing that an AI-based system provided the decisions negatively affects users’ fairness and comprehension perceptions, compared to knowing that humans made the decision. Finally, the third conclusion is that providing case-based, certification-based, or sensitivity-based explanations can narrow this gap and may even eliminate it. Additionally, we found that users’ fairness and comprehension perceptions are influenced by a variety of factors such as the input, output, and explanation provided by the system, as well as by individuals’ age, education, computer skills, and personality. Our findings may help to understand when and how to use explanations to improve users’ perceptions regarding AI-based decision-making. CCS CONCEPTS • Human computer interaction (HCI) → HCI design and evaluation methods → User studies • Human-centered computing → Human computer interaction (HCI) → Empirical studies in HCI • Applied computing → Law, social and behavioral sciences → Sociology
1. Introduction
Decisions and decision making, can have significant, critical or even life threatening consequences (Huang et al., Citation2023; Stahl et al., Citation2023). As artificial intelligence (AI) becomes more prevalent, many decisions that used to be made by humans (i.e., human decision making, HDM) are now being made by algorithmic or AI-based systems (Lee, Citation2018). AI-based decision-making (ADM) systems are increasingly used in many areas such as finance, healthcare, commerce, HR and more (Albassam, Citation2023; Araujo et al., Citation2020; Islam et al., Citation2022; Hunkenschroer & Luetge, Citation2022; Starke et al., Citation2022).
Societal and ethical concerns regarding the development, use, and evaluation of ADM have led to growing research efforts, so the asked questions are “does the system make decisions in a fair manner?” and “do we or can we trust ADM?.” ADM is perceived with distrust and as less fair and trustworthy than HDM in many contexts, e.g., managerial decisions in the HR domain (Bankins et al., Citation2022; Lee, Citation2018), new product tests (Wesche et al., Citation2022), and financial and legal decisions (Kern et al., Citation2022). In the context of ADM, fairness has often been defined in terms of bias and discrimination (Mehrabi et al., Citation2021; Pessach & Shmueli, Citation2022; Speicher et al., Citation2018) and solutions for this problem were generally looked at from a mathematical and/or algorithmic perspective (Deldjoo et al., Citation2023; Li et al., Citation2023; Wang et al., Citation2023). However, to date, neither a solution nor a terminology has been agreed upon (Narayanan et al., Citation2023; Nyathani, Citation2022; Pagano et al., Citation2023; Tal et al., Citation2019; Woodruff et al., Citation2018; Xivuri & Twinomurinzi, Citation2021).
Users’ perception of how fair and transparent AI-based systems are, regardless of their actual performance, may influence users’ willingness to use these systems and follow their decisions (Starke et al., Citation2022). Transparency, explanations, and consistency in the decision-making processes have been shown to amplify perceptions of fairness, even when outcomes might not align with individual preferences or expectations (Schoeffer, Citation2022; Schoeffer et al., Citation2022; van Berkel et al., Citation2023; Yurrita et al., Citation2023).
Providing explanations on the outcome and/or the decision making process of ADM is considered as one of the ways to achieve transparency of ADM (Abdollahi & Nasraoui, Citation2018; Barredo Arrieta et al., Citation2020). Furthermore, explainability (i.e., Explainable-AI, also known as XAI), has been identified by many studies as an important characteristic that affects users’ perceptions positively (Binns et al., Citation2018; Böckle et al., Citation2021; Conati et al., Citation2021; Dodge et al., Citation2019; Lee et al., Citation2019; Shulner-Tal et al., Citation2022, Citation2023). The purpose of XAI is twofold: (i) creating explainable models while maintaining a high level of prediction and accuracy, and (ii) providing explanations for ADM processes and output, so that users can understand the system, trust it and feel better about interacting with it (Barredo Arrieta et al., Citation2020; Shin, Citation2021).
The relationship between explainability, comprehension, fairness and trust in AI is complex and multifaceted. According to (Abdollahi & Nasraoui, Citation2018; Barredo Arrieta et al., Citation2020; Guidotti et al., Citation2019), explainability refer to the ability to create and provide explanations that will be accurate to the decision making process (i.e., the explanation will make system more transparent) and comprehensible to human (i.e., people will be able to comprehend how the system works and/or why a specific output was obtained). Furthermore, according to (Holzinger et al., Citation2020; Schoeffer, Citation2022; Shin, Citation2021; Shulner-Tal et al., Citation2022), explainability positively effects users’ transparency, comprehension and fairness perceptions and this, in turns, impact users’ trust and acceptance of the system and its results.
To the best of our knowledge, while some studies have examined the effect of the type of decision-maker (human vs. AI system) on users’ fairness and comprehension perceptions and other studies have investigated various methods of XAI and their effect, we did not find a study that combined these important issues. Hence, the aim of this study is to explore how the type of the decision-maker (ADM or HDM) affects users’ fairness and comprehension perceptions, and whether the provision of various explanation styles affects these perceptions.
2. Related work
We start by describing recent studies related to fairness perceptions. Then, we discuss how fairness perception interacts with XAI. We also present a comparison of HDM and ADM as our work focusses on the potential effect of XAI on users’ fairness and comprehension perceptions of ADM, in comparison to HDM.
2.1. Fairness perceptions in decision making
Fairness in decision-making has been extensively studied within the fields of psychology, law, and cognitive science. This multidisciplinary line of research explores how individuals perceive and evaluate the fairness of decisions made in various contexts (Narayanan et al., Citation2023; Starke et al., Citation2022). Due to the widespread use of AI, decision-making is no longer exclusively a human endeavor. Today, the field of fairness of ADM is being widely explored (Starke et al., Citation2022).
The basic notions of fairness perceptions in decision-making are related to the individual’s perceptions about the distribution of outcomes (e.g., distributive fairness), the decision-making process that is carried out (e.g., procedural fairness), the quality of interpersonal treatment (e.g., interactional fairness), and the information and explanations provided about the outcome and the decision-making process (e.g., informational fairness) (Colquitt & Rodell, Citation2015; Narayanan et al., Citation2023). Narayanan et al., (Citation2023) reviewed existing empirical research on users’ fairness perceptions of ADM with respect to the above fairness perception notions. They found that a relatively small number of studies examined users’ fairness perceptions of ADM and they encouraged future researchers to pay attention to those subjective perceptions.
People’s fairness perceptions of ADM are complex and influenced by a variety of factors, including individual differences (e.g., demographics, personality, cultural, and social characteristics), as well as by contextual factors (e.g., scenario, algorithmic procedure, input, output, explanations) (Aysolmaz et al., Citation2023; Harrison et al., Citation2020; Shulner-Tal et al., Citation2023; Starke et al., Citation2022; Wang et al., Citation2020). For example, recent studies found that laypeople’s perceptions of fairness are influenced by their self-interest and that people rate ADM as fairer when the algorithm predicts in their favor (Grgic-Hlaca et al., Citation2018; Shulner-Tal et al., Citation2022; Wang et al., Citation2020). Van Berkel et al., (Citation2021) explored the impact of information presentation on users’ fairness perceptions. Their findings indicated that presenting the predictors of the decision-making process in a textual form elevated the sense of fairness, while methods such as scatterplot visualizations reduced it. Moreover, their research suggested that factors such as the context, user gender, and educational background have a role in shaping users’ fairness perceptions. Specifically, women perceived the decision-making process as less fair compared to men, and individuals with higher educational backgrounds perceived the decision-making process as less fair than those with lower educational levels.
In addition, recent research by Böckle et al., (Citation2021), Conati et al., (Citation2021), Plane et al., (Citation2017), and Shulner-Tal et al., (Citation2023) explored the impact of users’ demographic and personality characteristics on their fairness perceptions with respect to the explanation style provided by the system. They suggested that users’ fairness perceptions of ADM are mainly affected by the explanation provided by the system and that creating personalized explanations, tailored to individual characteristics, is vital for enhancing users’ fairness perceptions of ADM. The results of the above studies, collectively, suggest that people’s fairness perceptions of ADM are complex and a broad perspective must be used to study them.
2.2. Explainable-AI (XAI)
A basic type of fairness perceptions is informational fairness. The quality of explanations given regarding the decision-making process and/or outcomes determines the perception of informational fairness (negative/positive). The increasing concerns regarding the “explainability” and “transparency” of AI systems have led to extensive research and policy-making discussions regarding the ethical foundations of AI (Colquitt & Rodell, Citation2015; Narayanan et al., Citation2023).
XAI has many versions and most have been studied extensively in recent years. Guidotti et al., (Citation2019) conducted a comprehensive survey of explanations for black-box models (i.e., complex, untraceable algorithms). They proposed a classification of explanation methods with respect to the type of explanation, the type of the black-box model and the type of data used as input. They suggested that black-box explanations fall into two main categories: model explanation (e.g., explaining the logic of a vague classifier) and outcome explanation (e.g., explaining the correlation between a particular input and its output, without explaining the whole logic of the black-box model). Barredo Arrieta et al., (Citation2020) conducted a systematic review of recent literature to clarify different concepts regarding XAI and provided a thorough taxonomy for future research. They identified various XAI techniques, including textual explanations, visual explanations, local explanations, explanations by example, explanations by simplification, and feature relevance explanations. Nunes and Jannach, (Citation2017) proposed an explanation taxonomy for end users based on the purpose, generation, presentation, and evaluation of the explanations. Hu et al., (Citation2021) classified XAI methods according to their purpose (how vs. why), interpretation method (local vs. global), context (individual vs. group), presentation (textual vs. visual), stakeholder type, and domain. Minh et al., (Citation2022) grouped various XAI methods into three categories: pre-modeling explainability (e.g., analyzing and explaining the data in the training data), interpretable model (e.g., usage of simple models that are explainable), and post-modeling explainability (e.g., explain the decision-making process and outcome). Additionally, Ebermann et al., (Citation2023) suggested some insights into how explainable AI can increase users’ acceptance of such systems and offered guidelines for interdisciplinary approaches for dealing with human-AI interaction during decision-making.
According to Narayanan et al., (Citation2023), a significant part of the existing research on explainable and transparent AI emphasizes a technical viewpoint, investigating which technological features might unveil the opaque nature of AI systems. They also argued that most empirical research on XAI typically concentrates on the ways that decision-makers leverage explanations to enhance their decision-making techniques and on how the subjects of these decision use explanations to assess the distributional and/or procedural fairness of the decisions affecting them. Nonetheless, more research is needed to understand how various explanations affect the informational fairness among decision makers.
Some recent studies evaluated XAI and its effect on users’ fairness perceptions. Yurrita et al., (Citation2023) examined how explanations and system attributes (i.e., human oversight and contestability) affect users’ perceptions of informational and procedural fairness. They argued that explanations had a positive effect on users’ perceptions of informational fairness and that this effect is stronger for participants with low AI literacy. Silva et al., (Citation2023) evaluated the effect of various types of explainability on both objective (i.e., accuracy and efficiency) and subjective (i.e., users’ trust, perceived explainability, social impressions) metrics using virtual agents. They conducted a between-subject user study in which the participants were asked to answer a set of questions using the suggestions of a robot. The participants also received one explanation type of for the suggestion. Then, the participants were asked which explanation style is considered the easiest to use, interpret, and trust. They found that providing explanations is significantly correlated with users’ trust, accuracy, and social competence and that there was a significant increase in users’ understandability when language-based and case-based explanations were used. Schoeffer et al., (Citation2022) argued that outcome explanations and the amount of information that is presented in the explanation have a positive effect on users’ informational fairness perception. Four distinct textual explanation styles (e.g., case-based, demographic-based, input influence-based, and sensitivity-based) were introduced and examined in detail in Binns et al., (Citation2018). Studies by Binns et al., (Citation2018) and Dodge et al., (Citation2019) investigated the influence of these explanation styles on users’ fairness perceptions. Their findings indicated that case-based explanations, which present similar instances from the training data that are the most similar to the input, are typically viewed as less fair than other explanatory methods. Interestingly, they found that the context in which the system operates and its results might have a more pronounced effect on the perceptions of fairness than the explanation type itself, especially if only one style of explanation is used. In another study by Shulner-Tal et al. (Citation2022), the correlations between XAI and users’ fairness and comprehension perceptions were assessed with respect to system outcomes. Their results suggested that explanations have negligible impact on the perceptions of fairness when the system outcome is negative; however, in positive outcomes, explanations play a significant role in shaping users’ fairness and comprehension perceptions toward the system. Additionally, explanations were found to influence users’ comprehension of systems’ outcomes, regardless of whether these outcomes were positive or negative. Similarly, Schoeffer and Kuehl, (Citation2021) suggested examining the four explanation styles in terms of their effectiveness in facilitating people’s ability to evaluate the fairness of ADM using fair and unfair systems. Additionally, Shin, (Citation2021) explored the effect of explainability on users’ perceptions, trust and acceptance. He found that explainability positively affect users’ fairness, transparency and accountability perceptions and these perceptions are positively affect users’ trust in AI. He also argued that bringing transparency and accountability to AI systems will make the system more comprehensive to laypeople and help people understand how algorithms make decisions.
Although most factors that influence users’ fairness and comprehension perceptions cannot be changed, the explanation provided by the system can be modified easily. Hence, providing various explanations for the decision-making process and/or for the outcome has been proven to be a key factor that positively affects users’ fairness perceptions vis-à-vis ADM. The above studies also emphasized the need to examine different types and styles of XAI since presenting a more tailored and understandable explanation to users can influence their willingness to trust the system, use it, and accept its decisions.
2.3. Human versus AI decision-making
ADM systems are used widely around the world and several studies have compared users’ perceptions of the fairness of HDM vs. ADM. The results have, however, been ambiguous. Some studies have shown that when ADM systems are perceived as transparent, they are seen as fairer than HDM, particularly in scenarios plagued with human biases (Helberger et al., Citation2020; Lee & Baykal, Citation2017; Schoeffer et al., Citation2021); other studies have shown the opposite. (Lee, Citation2018) compared various decisions that required mechanical or human skills and found that ADM was perceived as less fair and trustworthy and evoked more negative emotion than HDM, especially for tasks requiring human skills. Bankins et al., (Citation2022) examined individuals’ fairness perceptions in six HR functions. They manipulated the decision-maker (ADM or HDM) and decision output (positive or negative) to determine their impact. They found that HDM was perceived as more respectful than ADM, and that users’ trust was higher when the decision was made by humans, for both positive and negative decisions. Wesche et al., (Citation2022) conducted two between-subject studies in which they manipulated the decision-maker (AI or human), the explanation (providing or not providing a simple explanation of the decision process), and the type of the decision-making task (requiring human vs. mechanical skills). They found that people prefer HDM over ADM and that providing explanations for ADM positively affected users’ trust.
In addition, Kern et al., (Citation2022) examined peoples’ preferences and acceptance of ADM in four dimensions: the context of the system, human involvement, input features, and individual characteristics. They found that people prefer decisions that involve HDM over purely ADM and that human oversight of ADM increases peoples’ fairness perceptions. Nagtegaal, (Citation2021) suggested that HDM is perceived as fairer than ADM for tasks with high complexity and Newman et al., (Citation2020) argued that the negative attitude towards ADM is due to the fact that these systems have limited information and that the overall context is not always considered. Conversely, a few studies did not find a significant difference between users’ fairness perception of HDM and ADM (Plane et al., Citation2017). Moreover, Starke et al., (Citation2022) conducted a systematic review of empirical studies on fairness perceptions of ADM. They focused on four dimensions: algorithmic characteristics, human characteristics, comparison of HDM vs. ADM, and ADM consequences. They found that some people believe that algorithms are more objective and thus fairer than humans, while others are suspicious about ADM potential biases and that transparency and explanations are critical factors in shaping users’ fairness perceptions. They also advocated for the need for more interdisciplinary research to understand the complexity of fairness perceptions in ADM. Our study aims to resolve the not yet fully unanswered question about users’ fairness perceptions of ADM and HDM by comparing the effect of explanations about their decision-making processes.
3. Motivation, research question and hypotheses
As mentioned above, the increased use of ADM systems has led to many studies that examine differences in users’ fairness perceptions between HDM and ADM (e.g., Bankins et al., Citation2022; Choung et al., Citation2023; Helberger et al., Citation2020; Kern et al., Citation2022; Lee, Citation2018; Lee & Baykal, Citation2017; Nagtegaal, Citation2021; Schoeffer et al., Citation2021). In addition, research on the importance of providing explanations for ADM and the differences between various explanation styles has grown (e.g., Binns et al., Citation2018; Conati et al., Citation2021; Dodge et al., Citation2019; Ebermann et al., Citation2023; Plane et al., Citation2017; Shin, Citation2021; Shulner-Tal et al., Citation2022, Citation2023). However, to the best of our knowledge, no study combines these two important aspects. Hence, our study aims to examine the differences in users’ perceptions depending on the type of the decision-maker, the style of explanation for the decision, and the interaction between these two aspects. Respectively, the main research question that this study deals with is “What is the effect of the type of decision-maker, the explanation style, and the combination of both on users’ fairness and comprehension perceptions?
This question leads to the following sub-questions:
RQ1: How the type of the decision-maker (ADM or HDM) affects users’ fairness and comprehension perceptions?
RQ2: How the provision of various explanation styles affects users’ fairness and comprehension perceptions?
RQ3: How the interaction between the type of the decision-maker and the type of the explanation styles affects users’ fairness and comprehension perceptions?
Two recent studies examined users’ fairness perceptions in the HR domain. The first study is Shulner-Tal et al., (Citation2023) who examined how different system characteristics (e.g., the input, the output, input-output relation and the explanation), and users’ demographic and personality characteristics effect users’ fairness and understability perceptions. In order to do so, they conducted a between-subject experiment using a simulated scenario of job recruitment task. They further analyzed the differences in users’ perceptions with respect to the explanation style provided by the system. The second study is Choung et al., (Citation2023), who investigated people’s perceptions of ADM compared to HDM within the job application context while taking into account both favorable and unfavorable outcomes.
4. Experimental design
As mentioned above, the HR domain and especially the job application task is understandable and familiar to most people. Additionally, AI-based decision support systems are becoming a crucial tool in the recruitment process and further examination of users’ perception of ADM in this field is necessary (Hunkenschroer & Luetge, Citation2022). The purpose of this study is to investigate differences in users’ fairness and comprehension perceptions while considering the decision-maker, the explanation style and the interaction of both. The experiment conducted in (Shulner-Tal et al., Citation2023) presents a coherent structure for examining users’ perceptions of ADM with respect to different explanation styles while the experiment conducted in (Choung et al., Citation2023) presents a coherent structure for finding differences between ADM and HDM. Both (Choung et al., Citation2023) and (Shulner-Tal et al., Citation2023) used a simulated case study of job application task.
Therefore, in line with (Choung et al., Citation2023) and (Shulner-Tal et al., Citation2023), we replicated the experiment presented in (Shulner-Tal et al., Citation2023), with some modifications based on the experiment presented in (Choung et al., Citation2023). Our study employed a randomized between-subject design and include a wide range of modified scenarios, all related to a simulated job application hiring task. For the creation of the experiment, we used the manipulations presented in (Shulner-Tal et al., Citation2023) and based on (Choung et al., Citation2023), we included a new manipulation: presenting the decision-maker either as an “AI system” or a “human expert.” To keep the experiment tractable, while adding this new manipulation, we eliminated the manipulation of the certification stamp that was used in (Shulner-Tal et al., Citation2023) (i.e., whether or not the AI system comes with a VeriSign stamp, while keeping the explanation about certification). We also used the same descriptions of the explanations and experimental procedure presented in (Shulner-Tal et al., Citation2023).
Thus, the resulting experiment encompassed four categories of manipulations: (i) decision-maker type (HDM or ADM); (ii) input features (attributes that represent an above average candidate or a below average candidate); (iii) output results (desirable recommendation in which hiring the candidate is recommended, neutral recommendation in which no decision was made, or undesirable recommendation in which the candidate is not recommended for hiring); and (iv) XAI manipulation (no explanation (NON) or one out of five explanation styles: case-based (CAS), certification-based (CER), demographic-based (DEM), input features-based (INP), and sensitivity-based (SEN)). All explanation styles were considered for each combination of decision maker, candidate type and recommendation.
The explanations styles that were used in the XAI manipulation were formulated according to the guidelines presented in Gedikli et al., (Citation2014), and according to the wording and presentation format presented in (Binns et al., Citation2018; Dodge et al., Citation2019; Shulner-Tal et al., Citation2022, Citation2023). To clarify, the CAS explanation presented a scenario from the model’s training dataset that closely resembles the specific scenario. The DEM explanation offered collective demographic data, like age, gender, income level, or occupation, regarding the composition of the training dataset and/or the distribution of results. The INP explanation illustrated the impact of different input features on the decision using quantitative metrics. The SEN explanation involved sensitivity analysis, demonstrating how alterations in input feature values will affect the outcome and the CER explanation presented the results of an auditing process of the system. Additionally, Shulner-Tal et al., Citation2023) evaluated the quality of these explanation styles using the system causability scale (SCS) (Holzinger et al., Citation2020) and found that the quality of the explanations is above average.
Similarly to (Shulner-Tal et al., Citation2023), each participant was assigned to one hiring task in which a specific candidate’s characteristics were given, as well as a recommendation whether to recruit the candidate for the position and an explanation for the recommendation. Then, participants had to report their perceived levels of fairness and comprehension in relation to the presented scenario. To facilitate this investigation, a total of 72 (2 × 2 X 3 × 6) unique scenarios were created, each representing a combination of the aforementioned manipulations. The participants were randomly assigned to one of these scenarios and then they were presented with their assigned scenario only. For example, one such scenario involved an ADM system that receives the details of an above average candidate. The ADM’s decision is to hire her and the explanation for that decision is case-based. Another scenario involved a human decision maker (HR expert) that receives the details of a below average candidate and her decision is to hire her and the explanation for that decision is sensitivity-based.
Subsequently, the participants were requested to report their perceived levels of fairness and comprehension in relation to the presented scenario. For keeping our experiment as similar to (Shulner-Tal et al., Citation2023) and simple as possible, we used a six-point Likert scale, ranging from −3 (“extremely unfair” for users’ fairness perception or “thoroughly do not understand” for users’ comprehension perception) to 3 (“extremely fair” for users’ fairness perception or “thoroughly understand” for users’ comprehension perception). To avoid participants not making a clear judgement about their perceived fairness and comprehension, we did not introduce into the scale the respective options of “neither fair nor unfair” and “neither understand nor do not understand” (which would have been represented as 0).
Additionally, participants provided their demographic information, including gender, age group, education level, and computer skills level. Their personality characteristics were assessed as well, using the Ten Item Personality Inventory (TIPI) questionnaire (Gosling et al., Citation2003). The TIPI questionnaire consist ten-item measures of the Big Five Personality Domains (two measures for each personality characteristic). Each measure is examined on a 7-point scale from "Disagree strongly" (represented as 1) to "Agree strongly" (represented as 7). The two measures that relate the same personality characteristic are combined together and a single rating is calculated. A result above 4 represents high level of this personality characteristic and a result below 4 implies a low level of this characteristic.
4.1. Participants
Our online between-subject experiment involved 3,546 participants. In order to be able to perform statistical analysis, our “goal number” of participants was about 50 participants for each scenario, while meeting our budget limitations. The experiment took place during May 2023. The participants were recruited via Amazon Mechanical Turk (MTurk) and included only native English speakers (residing in the USA) who were 18 years of age or older. To ensure a high level of data quality, all selected participants possessed a minimum Human Intelligence Tasks (HIT) approval rate of 95% and had completed at least 1000 HITs (According to MTurk, these parameters represents an employee who accomplished high rating performance in various tasks). Each participant was limited to a single participation in the experiment. Participants received compensation of $1 for their involvement and, on average, their interaction with the system lasted 5.08 minutes.
Following a rigorous evaluation process, 478 participants were excluded from the analysis. The exclusion criteria comprised failure in the attention check for 127 participants and deviations from the expected execution times for 351 participants (the top 5% of participants with the longest completion times and the bottom 5% with the shortest completion times were excluded). As a result, a final sample set of 3,068 participants was retained for the subsequent analysis. The demographic (gender and age group) distribution of the participants is presented in .
Table 1. Participants’ demographic distribution (gender and age group).
5. Experimental results and analysis
5.1. Descriptive statistics
In general, when compatible input–output relations were considered (i.e., a desirable recommendation for the above average candidate and a neutral or undesirable recommendation for the below average candidate), participants rated both fairness and comprehension perceptions high for both ADM and HDM, with HDM having the higher rating. When contrasting input–output relations were considered (i.e., an undesirable recommendation for the above average candidate and a desirable recommendation for the below average candidate), participants rated both fairness and comprehension perceptions low for both ADM and HDM, with HDM having the higher rating. The distribution of the various manipulations that were used in the experiment, the number of cases (N) and the average score (STD) of the fairness and comprehension perceptions for each combination are presented in . A detailed analysis of the results follows in Section 5.2 and 5.3.
Table 2. Distribution of the various manipulations used in the experiment.
5.2. General analysis
Overall, the results of the descriptive statistics indicate that the fairness and comprehension perceptions of HDM are higher than for ADM in both compatible and contrasting input–output relations. Hence, as a first step, we aggregated all the case studies according to the decision-maker type and performed the Mann-Whitney test for independent samples to decide whether there are significant differences between users’ fairness and comprehension perceptions with respect to the decision-maker type. The aggregated results (Mean (STD)) of the fairness and comprehension perceptions according to the decision-maker type are presented in .
Table 3. Aggregated results according to the decision-maker type.
The results of the Mann-Whitney test indicate that: (1) there is a significant difference between participants’ fairness perceptions of HDM vs. ADM [U = 1083357, Z = −3.978, p = <0.001, r = 0.072] and that (2) there is a significant difference between participants’ comprehension perceptions of HDM vs. ADM [U = 1099493.5, Z = −3.302, p = <0.001, r = 0.060]. These results indicate that the decision-maker type affects participants’ fairness and comprehension perceptions. Specifically, ADM negatively influences these perceptions compared to HDM.
Based on the Mann-Whitney test results on the differential response to the decision-maker type (HDM vs. ADM), we performed a multivariate ordinal regression, examining the effect of the additional manipulation categories (input features, output characteristics, and XAI manipulations as well as the demographic and personality characteristics of the user). The results of the multivariate ordinal regression, namely, Beta coefficients, STD, and significance, are presented in . The Beta coefficients represent the predicted change in the dependent variable (participants’ fairness and comprehension perceptions) per a change in the value of the independent variable (the various manipulations, demographic and personality characteristics, and their values). The higher the absolute value of the Beta coefficient, the greater the change in the characteristic’s value. A positive/negative value signifies a positive/negative impact. Overall model fit is [ (20) = 84.634, p < 0.001] for HDM and [
(20) = 146.226, p < 0.001] for ADM, which indicates an acceptable fit.
Table 4. Multivariate ordinal regression results.
In general, we can see that there is some similarity between the Beta coefficients results for HDM and ADM in most comparisons, although there are many differences when it comes to comparing HDM and ADM explanations.
The results of the ordinal regression lead to the multiple observations regarding participants’ fairness and comprehension perceptions based on the various factors. The observations for the factors that relates to the scenario are presented in section 5.2.1 and the observations for users’ demographic and personality characteristics are presented in section 5.2.2.
5.2.1. Scenario related factors and their effect on users’ fairness and comprehension perceptions
This section describes the observations regarding the scenario related factors (i.e., input, output, and explanation style). Considering the input (above average candidate vs. below average candidate) we can say the following:
The fairness perceptions of decisions made for above average candidates are higher than the fairness perceptions of decisions made for below average candidates (0.235 and 0.285 for HDM and ADM, respectively), though the variation between the differences is modest in magnitude.
The comprehension perceptions of decisions made for above average candidates are higher than the comprehension perceptions of decisions made for below average candidates (0.207 and 0.223 for HDM and ADM, respectively) though the difference is modest in magnitude.
The practical meaning of the above results is that participants’ fairness and comprehension perceptions may be higher, for both HDM and ADM, when dealing with an above average candidate.
Another scenario related factor that was examined is the output. Based on the ordinal regression results for the output (desirable vs. neutral vs. undesirable), we can say that:
The fairness perceptions of a desirable output are higher than the fairness perceptions of an undesirable output (0.326 and 0.369 for HDM and ADM, respectively) and the fairness perceptions of a neutral output are higher than the fairness perceptions of an undesirable output (0.310 and 0.341 for HDM and ADM, respectively).
The comprehension perceptions of a desirable output are 0.278 higher than that of a neutral output for ADM, and the comprehension perceptions of a neutral output are 0.236 higher than that of an undesirable output for HDM.
This means that when the output of the decision-making process is a desirable or neutral recommendation, participants’ fairness perceptions may be higher, for both HDM and ADM, while participants’ comprehension perceptions of a desirable output may be higher for ADM and participants’ comprehension perceptions of a neutral output may be higher for HDM
The last scenario related factor that was considered in the analysis is the explanation provided for the decision. Taking into account the various explanation styles that were examined, we can say the following:
The fairness perceptions of ADM when the CER or SEN explanations are presented are 0.451 or 0.456 higher than when no explanation (NON) is presented. The fairness perceptions of ADM when the SEN, INP, CAS or CER explanations are presented are 0.620, 0.270, 0.615 and 0.388, respectively, higher than when the DEM explanation is presented. For HDM, no significant differences between when no explanation (NON) is given and when the various explanation styles are offered emerge. The only difference for HDM is that participants’ fairness perceptions when the CER explanation is presented are 0.378 higher than when the DEM explanation is presented.
The comprehension perceptions of HDM when the NON, SEN, INP or CAS explanations are presented are 0.374, 0.392, 0.475 and 0.510, respectively, higher than when the DEM explanation is presented. For ADM, the comprehension perceptions when the SEN explanation is presented are higher than when the NON, CAS, DEM and INP explanations are presented (0.458, 0.337, 0.485 and 0.329, respectively).
The meaning of those observations is that no difference in participants’ fairness perceptions appear for HDM, while for ADM, both whether or not an explanation exists, and the explanation style itself, can change participants’ fairness perceptions significantly. Regarding participants’ comprehension perceptions, we can say that participants’ comprehension perceptions when the DEM explanation is presented will be lower for HDM and that participants’ comprehension perceptions when the SEN explanation is presented will be higher for ADM.
5.2.2. Users’ demographics and personality related factors and their effect on users’ fairness and comprehension perceptions
As mentioned above, users’ demographic and personality characteristics may influence their perceptions. Hence, in addition to the scenario related factors, we also considered users’ demographic and personality characteristics in the ordinal regression analysis. The results of the ordinal regression analysis of participants’ demographic characteristics indicate the following:
There is no significant difference in participants’ fairness perceptions between gender groups for both HDM and ADM.
There is no significant difference in participants’ comprehension perceptions between gender groups for both HDM and ADM.
There are significant variations in participants’ fairness perceptions between different age groups. The fairness perceptions of participants in the 21–34 age group is higher than the fairness perceptions of participants in the 50+ age group (0.358 and 0.299 for HDM and ADM, respectively). The fairness perceptions of participants in the 35–50 age group is higher by 0.255 than the fairness perception of participants in the 50+ age group for HDM.
There is a significant variation in participants’ comprehension perceptions between different age groups. The comprehension perceptions of the 21–34 age group is 0.243 higher than the comprehension perceptions of the 35–50 age group for ADM.
There is a significant difference in participants’ fairness perceptions among education levels. For ADM, the fairness perceptions of participants with a bachelor’s or master’s degree is 0.544 and 0.721 higher than the fairness perceptions of participants who accomplished a high school diploma or lower.
There is a significant difference in the fairness perceptions of participants with different computer skills. When comparing participants with excellent vs. average computer skills levels, the fairness perceptions of participants with excellent computer skills is higher by 0.800 for ADM. The fairness perceptions of participants with good computer skills is 0.404 higher than participants with average computer skills for ADM and the fairness perceptions of participants with excellent computer skills is higher by 0.390 for HDM and 0.396 for ADM than the fairness perceptions of participants with good computer skills.
There is a significant difference in the comprehension perceptions of participants with different computer skills. For HDM, the comprehension perceptions of participants with excellent computer skills are higher by 0.781 than the comprehension perceptions of participants with average computer skills and the comprehension perceptions of participants with excellent computer skills are higher by 0.750 for HDM and 0.753 for ADM than the comprehension perceptions of participants with good computer skills.
The results of the ordinal regression analysis of participants’ personality characteristics indicate the following:
No significant differences appear between participants who reported high and low agreeableness levels.
The fairness perceptions of participants who reported high conscientiousness levels are significantly higher by 0.378 than the fairness perceptions of participants who reported low conscientiousness levels for ADM.
The comprehension perceptions of participants who reported high conscientiousness levels are significantly higher by 0.459 than the comprehension perception of participants who reported low conscientiousness levels for HDM.
The fairness perceptions of participants who reported high emotional stability levels are significantly higher by 0.275 than the fairness perceptions of participants who reported low emotional stability levels for HDM.
The comprehension perceptions of participants who reported high emotional stability levels are significantly higher by 0.436 for HDM and 0.285 for ADM than the comprehension perceptions of users who reported low emotional stability levels.
The fairness perceptions of participants who reported high extraversion levels are significantly higher by 0.395 for HDM and 0.256 for ADM than the fairness perception of participants who reported low extraversion levels.
The comprehension perceptions of participants who reported high extraversion levels are significantly higher by 0.261 for HDM and 0.343 for ADM than the comprehension perceptions of participants who reported low extraversion levels.
The comprehension perceptions of participants who reported high openness levels are significantly higher by 0.284 for HDM and 0.340 for ADM than the comprehension perceptions of participants who reported low openness levels.
In sum, these results indicate that participants’ fairness and comprehension perceptions are not affected by their gender (no significant differences were found between females and males for both HDM and ADM) and agreeableness level (no significant differences were found, for both HDM and ADM, between users who reported high and low agreeableness). With respect to the decision-maker type, however, we can say that participants’ age, educational level, computer skills, conscientiousness, emotional stability, extraversion, and openness levels influence their fairness and comprehension perceptions. Hence, we can say that: (i) the younger the participant, the higher their fairness and comprehension perceptions of the decision-making process for both HDM and ADM; (ii) the higher the participant’s education level, the higher their fairness perception vis-à-vis ADM; (iii) the higher the level of the participant’s computer skills, the greater will be their fairness and comprehension perceptions regarding decisions, especially for ADM; (iv) higher levels of extraversion are related to higher fairness perceptions for both HDM and ADM, while higher levels of conscientiousness are related to higher fairness perceptions only for ADM and higher levels of emotional stability are related to higher fairness perceptions only for HDM; and (v) higher levels of emotional stability, extraversion, and openness are related to higher comprehension perceptions for both ADM and HDM, while higher levels of conscientiousness are related to higher comprehension perceptions only for HDM.
5.3. Multi-level analysis for decision-maker and explanation style combinations
The results of the ordinal regression analysis show the association between the fairness and comprehension perceptions and the various factors that were considered in the experiment. The effect of a combination of two or more factors, however, cannot be seen in these results. In most factors, the variations between the HDM and ADM Beta coefficients was negligible, while in the explanation style comparisons we found major differences between these same coefficients. Furthermore, the explanation style is the only parameter that can be modified without changing the decision-making process or outcome. Hence, to test our hypotheses and based on the results of the multivariate ordinal regression, we aggregated the results of the fairness and comprehension perceptions according to the decision-maker type and explanation style, and then performed multi-level analysis. The aggregated results are presented in ; the fairness perceptions and comprehension perceptions are colored in orange and blue, respectively – the darker the color, the higher the perception level. The results in indicate that HDM is perceived as fairer and more comprehensible (darker colors) than ADM and that most explanation styles increased participants’ fairness and comprehension perceptions for both HDM and ADM.
Table 5. Aggregated results according to the decision-maker type and explanation style.
The multi-level analysis was carried out in three steps. Firstly, we examined the differences in participants’ fairness and comprehension perceptions between decision-maker types (section 5.3.1). Secondly, we conducted a comparative assessment to explore the differences between the explanation styles (section 5.3.2), and finally, we explored the differences between the various explanation styles in conjunction with the decision-maker type (section 5.3.3). To analyze the results, we used multi-level Non-Parametric Kruskal-Wallis tests (analogous to one-way ANOVA) in which we referred to the fairness perception and the comprehension perception (both ordinal) as the dependent variables and to the decision-maker type and explanation style (both categorical) as the independent variables.
5.3.1. The effect of the decision maker
This section refers to RQ1: How the type of the decision-maker (ADM or HDM) affects users’ fairness and comprehension perceptions?. To examine RQ1 we created the following hypothesis and sub-hypotheses:
H1: There are differences in users’ fairness and comprehension perceptions according to the type of the decision-maker (HDM vs. ADM).
H1.1: Users’ fairness perceptions are the same across the assorted decision-maker categories.
H1.2: Users’ comprehension perceptions are the same across the assorted decision-maker categories.
The results of the Kruskal-Wallis test indicate the following:
Participants’ fairness perception of HDM-NON are significantly higher than participants’ fairness perception of ADM-NON [H(1) = 4.560, P-value < 0.05,
= 0.009]. Consequently, H1.1 is rejected.
Participants’ comprehension perception of HDM-NON are significantly higher than participants’ comprehension perception of ADM-NON [H(1) = 4.344, P-value < 0.05,
The meaning of the above results is that the decision-maker type affects participants’ fairness and comprehension perceptions and that ADM is perceived negatively when no explanation is provided.
5.3.2. The effect of the explanation style
This section refers to RQ2: How the provision of various explanation styles affects users’ fairness and comprehension perceptions?. To examine RQ2 we created the following hypothesis and sub-hypotheses:
H2: There are differences in users’ fairness and comprehension perceptions according to the explanation style (no explanation (NON) vs. case-based (CAS) vs. certification-based (CER) vs. demographic-based (DEM) vs. input-features-based (INP) vs. sensitivity (SEN)).
H2.1: Users’ fairness perceptions are the same across explanation style categories.
H2.2: Users’ comprehension perceptions are the same across explanation style categories.
There is a significant difference in participants’ fairness perceptions between the various explanation styles [H(5) = 24.569, P-value < 0.001,
There is a significant difference in participants’ comprehension perception between the various explanation styles [H(5) = 14.563, P-value < 0.05,
Based on the results of the Non-Parametric Kruskal-Wallis, we further performed post-hoc multiple comparisons analysis using Bonferroni adjustment.
The results of the post-hoc multiple comparison analysis suggest that for H2.1 indicate that participants’ fairness perception of the SEN and CER explanation are significantly higher than of the DEM explanation (p < 0.05). No other differences were found.
The results of the post-hoc analysis for H2.2 indicate that participants’ comprehension perception of SEN is significantly higher than of DEM (p < 0.01). No other differences were found.
The meaning of the above results is that the explanation style affects participants’ fairness and comprehension perceptions and that SEN and CER explanations are more beneficial for increasing users’ fairness perception. And SEN explanation will be the most beneficial for increasing users’ comprehension.
5.3.3. The effect of the combination of decision maker and the explanation style
This section describes the examination of RQ3: How the interaction between the type of the decision-maker and the type of the explanation styles affects users’ fairness and comprehension perceptions? Accordingly, we created the following hypothesis:
H3: There are differences in users’ fairness and comprehension perceptions according to the interaction between the decision-maker type and the explanation style.
H3.1: Users’ fairness perceptions are the same across explanation style categories for a specific decision-maker.
H3.2: Users’ comprehension perceptions are the same across explanation style categories for a specific decision-maker.
H3.3: Users’ fairness perceptions are the same across decision-maker categories for a specific explanation style.
H3.4: Users’ comprehension perceptions are the same across decision-maker categories for a specific explanation style.
H3.5: Users’ fairness perceptions are the same for HDM when no explanation is given and for ADM with any explanation style.
H3.6: Users’ comprehension perceptions are the same for HDM when no explanation is given and for ADM with any explanation style.
H3.7: Users’ fairness perceptions are the same for HDM when no explanation is given and for ADM with a specific explanation style.
H3.8: Users’ comprehension perceptions are the same for HDM when no explanation is given and for ADM with a specific explanation style.
In order to examine H3 and it sub-hypotheses, we performed four different analyses.
Firstly, for the examination of H3.1 and H3.2, we compared the results of the various explanation styles (NON, CAS, CER, DEM, INP and SEN) within each decision-maker type (HDM and ADM) and we performed Non-Parametric Kruskal-Wallis test. The results suggest the following:
There is no significant difference in participants’ fairness perception between the various explanation styles for HDM [H(5) = 5.789, P-value > 0.05]. Therefore, we cannot reject H3.1 for HDM
There is a significant difference in participants’ fairness perception between the various explanation styles for ADM [H(5) = 22.065, P-value < 0.001,
There is no significant difference in participants’ comprehension perception between the various explanation styles for HDM [H(5) = 10.162, P-value > 0.05]. Therefore, we cannot reject H3.2 for HDM
There is a significant difference in participants’ comprehension perception between the various explanation styles for ADM [H(5) = 12.652, P-value < 0.05,
According to the results, no difference between the various explanation styles for HDM was found, while there is a difference between the explanation styles for ADM. Hence, we further performed post-hoc multiple comparisons analysis of the explanation styles using a Bonferroni adjustment within ADM.
The results of the post-hoc analysis indicate that:
Participants’ fairness perception of ADM-CER and ADM-SEN are significantly higher than of ADM-DEM (p < 0.01 and p < 0.001, respectively). No other differences were found.
Participants’ comprehension perception of ADM-SEN is significantly higher than of ADM-DEM (p < 0.05). No other differences were found.
Based on those results, we can say that within ADM, the DEM explanation negatively affects the fairness perceptions compared to the CER and SEN explanations, and the DEM explanation negatively affects the comprehension compared to the SEN explanation. In other words, it is important to select the right explanations for ADM results, as different types of explanations affect participants’ perceptions differently when presented with ADM results.
The second analysis was performed to examine H3.3 and H3.4. in order to do so, we compared the results of HDM and ADM within each explanation style and we performed Non-Parametric Kruskal-Wallis test on the different groups. The results (presented in ) indicate that we reject H3.3 when DEM and INP explanations are given but cannot reject H3.3 when CAS, CER and SEN explanation are given. And that we reject H3.4 for the CAS and INP explanations and cannot reject H3.4 for CER, DEM, and SEN explanations.
Table 6. Kruskal-Wallis Results of HDM compared to ADM for a specific explanation style. Significant results appear in bold font.
These results means that there is no difference in participants’ fairness perception and comprehension perception between HDM and ADM when CER or SEN explanations are provided. When a CAS explanation is provided for both HDM and ADM, participants’ comprehension perceptions are higher for HDM whereas no difference was found for participants’ fairness perceptions. When a DEM explanation is provided for both HDM and ADM, participants’ fairness perceptions are higher for HDM while no difference was found regarding participants’ comprehension perceptions. Finally, when an INP explanation is provided for both HDM and ADM, participants’ fairness and comprehension perceptions are higher for HDM. These results, again, show that by careful selection of explanation styles, ADM results may be perceived as fair as HMD results.
Thirdly, for the examination of H3.5 and H3.6, we compared HDM-NON (i.e., human decision maker when no explanation is provided for her decision) and ADM with any explanation style (i.e., AI-based decision support system that provide explanation for its decision, regardless of the explanation style). For convenience, we will refer to ADM with any explanation style as ADM-ALL. The results of the Non-Parametric Kruskal-Wallis test for this comparison suggest that:
There is no significant difference in participants’ fairness perceptions between HDM-NON and ADM-ALL [H(1) = 2.298, P-value > 0.05]. Therefore, we cannot reject H3.5.
There is no significant difference in participants’ comprehension perceptions between HDM-NON and ADM-ALL [H(1) = 3.704, P-value > 0.05]. Therefore, we cannot reject H3.6.
In other words, providing explanations for the ADM’s recommendation positively affects participants’ fairness and comprehension perceptions such that no differences can be recognized when comparing them to the HDM’s recommendation. The practical meaning is as before: explaining ADM results is important for enhancing users’ fairness and comprehension perceptions.
Finally, to examine H3.7 and H3.8, we performed a forth analysis in which we compared the results of HDM-NON with the results of ADM with specific explanation style (i.e., ADM-CAS, ADM-CER, ADM-DEM, ADM-INP and ADM-SEN). The results, presented in , indicate that the fairness and comprehension perception of ADM-DEM and the comprehension perception of ADM-CAS is significantly lower than HDM-NON. Therefore, we reject H3.7 for the DEM explanation and cannot reject H3.7 for the CAS, CER, INP, and SEN explanations. Moreover, we reject H3.8 for the CAS and DEM explanations and cannot reject H3.8 for the CER, INP, and SEN explanations.
Table 7. Kruskal-Wallis Results of HDM with no explanation vs. ADM with specific explanation style.
The implication seems to be that providing any explanation style for ADM, except for a DEM explanation, positively affects participants’ fairness perceptions. Additionally, no difference emerges when comparing it to HDM-NON and that providing any explanation style for ADM, except for the CAS and DEM explanations, positively affects participants’ comprehension perceptions. Accordingly, no difference can be found when comparing it to HDM-NON.
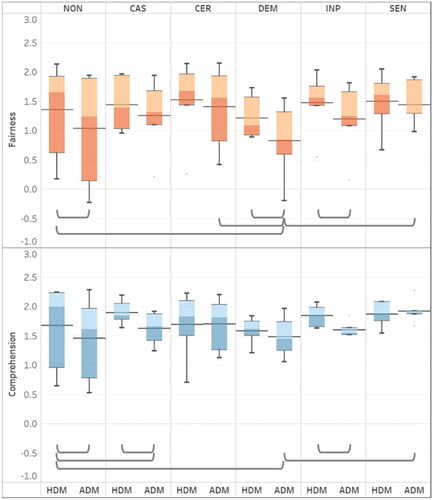
presents the distribution of the average fairness and compression scores for each decision-maker within the explanation style (based on the results in ). The comparisons (hypotheses) that turned out to be significant are also shown in the figure as a gray line. An interesting observation that can be made based on alone is that the distribution of the fairness and comprehension perceptions when no explanation (NON) is provided is wider than the distributions of any other explanation. This may indicate that when some explanation is provided, the distribution of the fairness and comprehension perception scores is more concentrated and there are fewer abnormal scores.
Figure 1. Distribution of the fairness (in orange) and compression (in blue) perception scores for each decision-maker type within the explanation style. The average score of the fairness and comprehension perceptions appear as the grey line intersecting each box. The box limits indicate the range of the Central 50% of the data (for example: dark blue represents the second quarter, light blue represents the third quarter), with a Central line marking the median value. Comparison (hypotheses) that were significant are marked with a connecting line.
6. Discussion
In this study we explored participants’ fairness and comprehension perceptions of ADM, in comparison to HDM, with respect to various explanation styles. To the best of our knowledge, this is the first study that combined these important issues. To do so, we replicated an experiment previously outlined in Shulner-Tal et al., (Citation2023) with some modifications. We performed an online between-subject experiment employing a case study of a hiring process and we measured participants’ fairness and comprehension perceptions with respect to the decision-maker type (ADM or HDM) and explanation style (NON, CAS, CER, DEM, INP and SEN).
We conducted multivariate ordinal regression analysis to examine the effect of the various manipulations (input, output, decision-maker type and explanation style) as well as participants’ demographic and personality characteristics, on participants’ fairness and comprehension perceptions. We found that both the input and output of the decision-making process affect users’ fairness and comprehension perceptions; however, the differences between the HDM and ADM vis-à-vis both fairness and compression perceptions are negligible. Hence, in the analysis of the experiment, we did not refer to the output (desirable or undesirable recommendation) and the relation between the input features (above average candidate vs. below average candidate) and the output. The results of the ordinal regression also indicate that participants’ demographic and personality characteristics have an impact on their fairness and comprehension perceptions. The demographic characteristics that affect users’ fairness and comprehension perceptions are their age (the fairness and comprehension perceptions of younger users is higher for both HDM and ADM), education level (the fairness perception of users who completed a bachelor’s or master’s degree is higher for ADM), and computer skills (the fairness and comprehension perceptions of users with a high level of computer skills is higher for ADM). The personality characteristics that affect users’ fairness and comprehension perceptions are their conscientiousness level, emotional stability level, extraversion level, and openness (the fairness perceptions of users who reported high levels of conscientiousness, emotional stability, and extraversion are higher while the comprehension perceptions of users who reported high levels of conscientiousness, emotional stability, extraversion, and openness are higher).
We note that each decision-maker type is related to a different set of demographic and personality characteristics that affect users’ perceptions of fairness and comprehension. The widespread influence of these characteristics should be investigated and addressed in future studies.
We further conducted multi-level Kruskal-Wallis analysis to examine the differences between the decision-maker types, the explanation style, and the combination of both. The results of the multi-level Kruskal-Wallis analysis are consistent with the results of the multivariate ordinal regression analysis.
Our results regarding the comparison between ADM and HDM are in line with previous studies (Bankins et al., Citation2022; Lee, Citation2018; Wesche et al., Citation2022) and suggest that participants’ fairness and comprehension perceptions are negatively affected by the fact that the recommendations/decisions were produced by an ADM (compared to an HDM), in cases where no explanation for the decision-making process or outcome is provided (H1.1, H1.2). Additionally, in accordance with (Binns et al., Citation2018; Conati et al., Citation2021; Dodge et al., Citation2019; Plane et al., Citation2017; Shin, Citation2021; Shulner-Tal et al., Citation2022, Citation2023), we found that providing explanations for ADM positively affects participants’ fairness and comprehension perceptions and that there are differences between the explanation styles (H2.1, H2.2, H3.1, H3.2) while no differences between explanation styles were found for HDM. In contrast, however, to Dodge et al., (Citation2019) and Binns et al., (Citation2018), we found that the CER and SEN explanations positively affect participants’ fairness and comprehension perceptions, when there is no consideration of other factors such as the decision-maker type.
The more interesting results are related to the combination of the decision-maker type and explanation style. Our results suggest that providing any style of explanation for ADM results can narrow the gap in users’ fairness and comprehension perceptions in comparison to HDM (H3.5, H3.6). Furthermore, in cases when CER or SEN explanations are provided for both HDM and ADM, there is no difference in participants’ fairness and comprehension perceptions (H3.3, H3.4), and that the differences in participants’ fairness and comprehension perceptions can be eliminated when an explanation is provided for ADM, in comparison to HDM with no explanation (H3.7, H3.8).
As any study, this study has limitations. Most of the studies cited in this paper, as well as our own, use hypothetical scenarios and rely on participants’ self-reporting. Consequently, it is unclear whether such results could be replicated in more realistic contexts. Additionally, the results may contain noise due to the use of MTurk and the representativeness of the participants. We had little control in selecting participants for the experiment, beside filtering MTurk employees according to their age, residence, HIT approval rate and amount of completed HITs. As part of the experiment we asked the participant for their computer skill level. 427 (13.9%), 1418 (46.2%) and 1223 (39.9%) participants reported an average, good and excellent computer skills level, respectfully. However, the participants were not asked to report their prior experiences or perceptions of AI-based systems which may have an impact on participants’ perceptions that were reported in this experiment.
Furthermore, the formulation, presentation and wording of the scenarios and the various explanation styles may have an impact on the results, and it is possible that using other explanation styles or using other formulation, presentation and/or wording of these explanations may lead to different results. The scenario itself could be another limitation. The study was carried out based on the assumption that the job application task is familiar to the majority of the population, however, we did not had control over the complexity of the decision process. Another limitation is related to the scale of which participants were reported their fairness and comprehension perceptions. In our experiment we used single item scale in order to keep the experiment simple and similar to (Shulner-Tal et al., Citation2023). But it is recommended to use multi-item scale for measuring complex ideas such as fairness and comprehension perceptions (Schrum et al., Citation2023).
Our findings may help in understanding when and how to use XAI to positively affect users’ perception regarding ADM. Nevertheless, it is worth noting that examination of the actual fairness of the system is still required, since we do not want to mislead users to think that a system is fair when it is not. In addition, this study illustrates the importance of providing and evaluating various XAI for ADM to establish users’ fairness and comprehension perceptions.
7. Conclusion and future work
As AI systems become increasingly entwined with our daily lives, understanding and addressing fairness perceptions of ADM becomes more and more vital. This complex issue weaves together threads from computer science, psychology, sociology, and ethics, reflecting the multifaceted nature of fairness.
Backed by our results, we argue that ADM negatively affects users’ fairness and comprehension perceptions, compared to HDM, and that providing CAS, CER and SEN explanations for the output of the decision-making process can change this situation. We also found that some of participants’ demographic and personality characteristics affected their fairness and comprehension perceptions and that there are different sets of characteristics that influence the fairness and comprehension perceptions for each decision-maker type. We speculate that CAS, CER and SEN explanations were the most beneficial since the CER explanation indicates that the system has been examined by an expert and this creates a “white-coat” which increase laypeople trust in the system (Shulner-Tal et al., Citation2023). It is worth noting that it requires performing an auditing process. In addition, SEN explanation (demonstrate how alterations in input feature values will affect the outcome) and CAS explanation (present a scenario from the model’s training dataset that closely resembles the specific input) have common element, both refer to the specific input features, in contrast to DEM and INP explanations. The finding of this study can be generalized to other decision-making contexts outside the HR domain by understanding the importance of explainable-AI and considering the specific characteristics of the domain of application and adapting explanations accordingly. Further examination of the effect of the decision maker, the explanation and the interaction of both as well as the examination of the effect of users’ demographic and personality characteristics on users’ fairness and comprehension of ADM is needed. A future research direction may be to examine the differences among the combinations of decision-maker type and explanations style with respect to the output and input-output correlation (compatible vs. not compatible), as well as to investigate how the interactions between users’ demographics and personality characteristics affect their fairness and comprehension perceptions of HDM versus ADM with respect to the various explanations. Another possible future direction could be to replicate this experiment in different contexts and tasks in the HR domain and also in other domains that can have a different level of impact on our lives (using a legal or financial case study, for example) and compare the fairness and comprehension perception results among the contexts.
To conclude, in our study, we showed the importance of users’ perceptions of ADM and the power that XAI has to modify them. In addition, we noted that users’ demographic and personality characteristics have an impact on their fairness and comprehension perceptions and suggested consider them when using ADM. In this study, we emphasized the importance of explainable-AI while taking into account the specific characteristics of the user as well as the specific characteristics of the domain of application and adjusting explanations accordingly. Therefore, we emphasize the need for ongoing interdisciplinary research to explore other factors that affect users’ perceptions of ADM, as well as the impact that users’ demographic and personality characteristics have on their fairness and comprehension perceptions. We stress that those important issues should be studied widely in future research.
Ethical approval
The research is approved by the ethics committee of the Faculty of Social Sciences, the University of Haifa (ethics approval 350/19).
Acknowledgments
Partial financial support was received from the Scholarship Program for Doctoral Students in High-Tech Professions at the University of Haifa, Israel, by the Data Science Research Center (DSRC) at the University of Haifa, Israel, and by the Center for Humanities and AI at the Technion – Israel Institute of Technology and the University of Haifa, Israel.
Disclosure statement
No potential conflict of interest was reported by the author(s).
Data availability statement
The dataset that was collected can be found at: https://zenodo.org/records/10374874.
Additional information
Notes on contributors
Avital Shulner-Tal
Avital Shulner-Tal is a faculty member at Braude college of engineering, Israel. Avital is a junior researcher and Ph.D. in the Information Systems Department at the University of Haifa, Israel. Avital’s main research interests and expertise are concentrated in the area of algorithmic transparency, explainability, algorithmic fairness and users’ perceptions.
Tsvi Kuflik
Tsvi Kuflik is a Full Professor at the Department of Information Systems, University of Haifa, Israel, specializing in intelligent user interfaces. His works on algorithmic transparency – making systems understandable to their users. Specifically, he focusses on users’ perception and the role of explanations in promoting trust in algorithmic systems.
Doron Kliger
Doron Kliger is a Faculty Member at the Department of Economics, University of Haifa, Israel, specializing in Finance and Behavioral Economics. His work has appeared in a range of journals in the fields of finance, economics, insurance, and probability, on topics including asset pricing, behavioral economics, finance, decision-making and more.
Azzurra Mancini
Azzurra Mancini is the co-founder of Logogramma – an innovative startup developing NLP solutions for human-machine interaction – and is a researcher with a PhD in Linguistics. She worked as professor of Translation at the University of Naples “L’Orientale.” Her research focuses on Linguistics, Computational Linguistics, Textual linguistics and Semiotics.
References
- Abdollahi, B., & Nasraoui, O. (2018). Transparency in fair machine learning: The case of explainable recommender systems. In Human and Machine Learning (pp. 21–35). Springer. https://doi.org/10.1007/978-3-319-90403-0_2
- Albassam, W. A. (2023). The power of artificial intelligence in recruitment: An analytical review of current AI-based recruitment strategies. International Journal of Professional Business Review, 8(6), e02089. https://doi.org/10.26668/businessreview/2023.v8i6.2089
- Araujo, T., Helberger, N., Kruikemeier, S., & de Vreese, C. H. (2020). In AI we trust? Perceptions about automated decision-making by artificial intelligence. AI & Society, 35(3), 611–623. https://doi.org/10.1007/s00146-019-00931-w
- Aysolmaz, B., Müller, R., & Meacham, D. (2023). The public perceptions of algorithmic decision-making systems: Results from a large-scale survey. Telematics and Informatics, 79, 101954. https://doi.org/10.1016/j.tele.2023.101954
- Bankins, S., Formosa, P., Griep, Y., & Richards, D. (2022). AI decision making with dignity? Contrasting workers’ justice perceptions of human and AI decision making in a human resource management context. Information Systems Frontiers, 24(3), 857–875. https://doi.org/10.1007/s10796-021-10223-8
- Barredo Arrieta, A., Díaz-Rodríguez, N., Del Ser, J., Bennetot, A., Tabik, S., Barbado, A., Garcia, S., Gil-Lopez, S., Molina, D., Benjamins, R., Chatila, R., & Herrera, F. (2020). Explainable Artificial Intelligence (XAI): Concepts, taxonomies, opportunities and challenges toward responsible AI. Information Fusion, 58, 82–115. https://doi.org/10.1016/j.inffus.2019.12.012
- Binns, R., Van Kleek, M., Veale, M., Lyngs, U., Zhao, J., & Shadbolt, N. (2018). Reducing a human being to a percentage’ perceptions of justice in algorithmic secisions[Paper presentation]. Proceedings of CHI Conference on Human Factors in Computing Systems (pp. 1–14). https://doi.org/10.1145/3173574.3173951
- Böckle, M., Yeboah-Antwi, K., & Kouris, I. (2021). Can you trust the black box? The effect of personality traits on trust in AI-enabled user interfaces [Paper presentation]. International Conference on Human–Computer Interaction (pp. 3–20). Springer. https://doi.org/10.1007/978-3-030-77772-2_1
- Choung, H., Seberger, J. S., & David, P. (2023). When AI is perceived to be fairer than a human: understanding perceptions of algorithmic decisions in a job application context. International Journal of Human–Computer Interaction. Advance online publication. https://doi.org/10.1080/10447318.2023.2266244
- Colquitt, J. A., & Rodell, J. B. (2015). Measuring justice and fairness. The Oxford Handbook of Justice in the Workplace, 1, 187–202. https://doi.org/10.1093/oxfordhb/9780199981410.013.8
- Conati, C., Barral, O., Putnam, V., & Rieger, L. (2021). Toward personalized XAI: A case study in intelligent tutoring systems. Artificial Intelligence, 298, 103503. https://doi.org/10.1016/j.artint.2021.103503
- Deldjoo, Y., Jannach, D., Bellogin, A., Difonzo, A., & Zanzonelli, D. (2023). Fairness in recommender systems: Research landscape and future directions. User Modeling and User-Adapted Interaction, 34(1), 59–108. https://doi.org/10.1007/s11257-023-09364-z
- Dodge, J., Liao, Q. V., Zhang, Y., Bellamy, R. K., & Dugan, C. (2019). Explaining models: An empirical study of how explanations impact fairness judgment [Paper presentation]. Proceedings of the 24th International Conference on Intelligent User Interfaces (pp. 275–285). https://doi.org/10.1145/3301275.3302310
- Ebermann, C., Selisky, M., & Weibelzahl, S. (2023). Explainable AI: The effect of contradictory decisions and explanations on users’ acceptance of AI systems. International Journal of Human–Computer Interaction, 39(9), 1807–1826. https://doi.org/10.1080/10447318.2022.2126812
- Efendić, E., Van de Calseyde, P. P., Bahník, Š., & Vranka, M. A. (2024). Taking algorithmic (vs. human) advice reveals different goals to others. International Journal of Human–Computer Interaction, 40(1), 45–54. https://doi.org/10.1080/10447318.2023.2210886
- Gedikli, F., Jannach, D., & Ge, M. (2014). How should I explain? A comparison of different explanation types for recommender systems. International Journal of Human-Computer Studies, 72(4), 367–382. https://doi.org/10.1016/j.ijhcs.2013.12.007
- Gosling, S. D., Rentfrow, P. J., & Swann, W. B. Jr, (2003). A very brief measure of the Big-Five personality domains. Journal of Research in Personality, 37(6), 504–528. https://doi.org/10.1016/S0092-6566(03)00046-1
- Grgic-Hlaca, N., Redmiles, E. M., Gummadi, K. P., & Weller, A. (2018). Human perceptions of fairness in algorithmic decision making: A case study of criminal risk prediction [Paper presentation]. Proceedings of the 2018 World Wide Web Conference (pp. 903–912). https://doi.org/10.1145/3178876.3186138
- Guidotti, R., Monreale, A., Ruggieri, S., Turini, F., Giannotti, F., & Pedreschi, D. (2019). A survey of methods for explaining black box models. ACM Computing Surveys, 51(5), 1–42. https://doi.org/10.1145/3236009
- Harrison, G., Hanson, J., Jacinto, C., Ramirez, J., & Ur, B. (2020). An empirical study on the perceived fairness of realistic, imperfect machine learning models [Paper presentation]. Proceedings of the 2020 Conference on Fairness, Accountability, and Transparency (pp. 392–402). https://doi.org/10.1145/3351095.3372831
- Helberger, N., Araujo, T., & de Vreese, C. H. (2020). Who is the fairest of them all? Public attitudes and expectations regarding automated decision-making. Computer Law & Security Review, 39, 105456. https://doi.org/10.1016/j.clsr.2020.105456
- Hilliard, A., Guenole, N., & Leutner, F. (2022). Robots are judging me: Perceived fairness of algorithmic recruitment tools. Frontiers in Psychology, 13, 940456. https://doi.org/10.3389/fpsyg.2022.940456
- Holzinger, A., Carrington, A., & Müller, H. (2020). Measuring the quality of explanations: The system causability scale (SCS). Kunstliche Intelligenz, 34(2), 193–198. https://doi.org/10.1007/s13218-020-00636-z
- Hu, Z. F., Kuflik, T., Mocanu, I. G., Najafian, S., & Shulner Tal, A. (2021). Recent studies of XAI-review [Paper presentation]. Adjunct Proceedings of the 29th ACM Conference on User Modeling, Adaptation and Personalization (pp. 421–431). https://doi.org/10.1145/3450614.3463354
- Huang, C., Zhang, Z., Mao, B., & Yao, X. (2023). An overview of artificial intelligence ethics. IEEE Transactions on Artificial Intelligence, 4(4), 799–819. https://doi.org/10.1109/TAI.2022.3194503
- Hunkenschroer, A. L., & Luetge, C. (2022). Ethics of AI-enabled recruiting and selection: A review and research agenda. Journal of Business Ethics, 178(4), 977–1007. https://doi.org/10.1007/s10551-022-05049-6
- Islam, M. R., Ahmed, M. U., Barua, S., & Begum, S. (2022). A systematic review of explainable artificial intelligence in terms of different application domains and tasks. Applied Sciences, 12(3), 1353. https://doi.org/10.3390/app12031353
- Kern, C., Gerdon, F., Bach, R. L., Keusch, F., & Kreuter, F. (2022). Humans versus machines: Who is perceived to decide fairer? Experimental evidence on attitudes toward automated decision-making. Patterns (New York, N.Y.), 3(10), 100591. https://doi.org/10.1016/j.patter.2022.100591
- Kouki, P., Schaffer, J., Pujara, J., O’Donovan, J., & Getoor, L. (2020). Generating and understanding personalized explanations in hybrid recommender systems. ACM Transactions on Interactive Intelligent Systems, 10(4), 1–40. https://doi.org/10.1145/3365843
- Krishnakumar, A. (2019). Assessing the fairness of AI recruitment systems [Master Thesis]. TU Delq. http://resolver.tudelft.nl/uuid:1ce06e89-72a7-47fe-bdbd-93775732a30c
- Lee, M. K. (2018). Understanding perception of algorithmic decisions: Fairness, trust, and emotion in response to algorithmic management. Big Data & Society, 5(1), 205395171875668. https://doi.org/10.1177/2053951718756684
- Lee, M. K., & Baykal, S. (2017). Algorithmic mediation in group decisions: Fairness perceptions of algorithmically mediated vs. discussion-based social division [Paper presentation]. Proceedings of the 2017 ACM Conference on Computer Supported Cooperative Work and Social Computing (pp. 1035–1048). https://doi.org/10.1145/2998181.2998230
- Lee, M. K., Jain, A., Cha, H. J., Ojha, S., & Kusbit, D. (2019). Procedural justice in algorithmic fairness: Leveraging transparency and outcome control for fair algorithmic mediation [Paper presentation]. Proceedings of the ACM on Human–Computer Interaction, 3(CSCW) (pp. 1–26). https://doi.org/10.1145/3359284
- Li, Y., Chen, H., Xu, S., Ge, Y., Tan, J., Liu, S., & Zhang, Y. (2023). Fairness in recommendation: Foundations, methods and applications. ACM Transactions on Intelligent Systems and Technology, 14(5), 1–48. https://doi.org/10.1145/3610302
- Mehrabi, N., Morstatter, F., Saxena, N., Lerman, K., & Galstyan, A. (2021). A survey on bias and fairness in machine learning. ACM Computing Surveys, 54(6), 1–35. https://doi.org/10.1145/3457607
- Millecamp, M., Htun, N. N., Conati, C., & Verbert, K. (2020). What’s in a user? Towards personalising transparency for music recommender interfaces [Paper presentation]. Proceedings of the 28th ACM Conference on User Modeling, Adaptation and Personalization (pp. 173–182). https://doi.org/10.1145/3340631.3394844
- Minh, D., Wang, H. X., Li, Y. F., & Nguyen, T. N. (2022). Explainable artificial intelligence: A comprehensive review. Artificial Intelligence Review, 55(5), 3503–3568. https://doi.org/10.1007/s10462-021-10088-y
- Nagtegaal, R. (2021). The impact of using algorithms for managerial decisions on public employees’ procedural justice. Government Information Quarterly, 38(1), 101536. https://doi.org/10.1016/j.giq.2020.101536
- Narayanan, D., Nagpal, M., McGuire, J., Schweitzer, S., & De Cremer, D. (2023). Fairness perceptions of artificial intelligence: A review and path forward. International Journal of Human–Computer Interaction, 40(1), 4–23. https://doi.org/10.1080/10447318.2023.2210890
- Newman, D. T., Fast, N. J., & Harmon, D. J. (2020). When eliminating bias isn’t fair: Algorithmic reductionism and procedural justice in human resource decisions. Organizational Behavior and Human Decision Processes, 160, 149–167. https://doi.org/10.1016/j.obhdp.2020.03.008
- Nunes, I., & Jannach, D. (2017). A systematic review and taxonomy of explanations in decision support and recommender systems. User Modeling and User-Adapted Interaction, 27(3-5), 393–444. https://doi.org/10.1007/s11257-017-9195-0
- Nyathani, R. (2022). AI-powered recruitment the future of HR digital transformation. Journal of Artificial Intelligence & Cloud Computing, 133, 1–5. https://doi.org/10.47363/JAICC/2022(1)133
- Pagano, T. P., Loureiro, R. B., Lisboa, F. V. N., Peixoto, R. M., Guimarães, G. A. S., Cruz, G. O. R., Araujo, M. M., Santos, L. L., Cruz, M. A. S., Oliveira, E. L. S., Winkler, I., & Nascimento, E. G. S. (2023). Bias and unfairness in machine learning models: A systematic review on datasets, tools, fairness metrics, and identification and mitigation methods. Big Data and Cognitive Computing, 7(1), 15. https://doi.org/10.3390/bdcc7010015
- Pessach, D., & Shmueli, E. (2022). A review on fairness in machine learning. ACM Computing Surveys, 55(3), 1–44. https://doi.org/10.1145/3494672
- Plane, A. C., Redmiles, E. M., Mazurek, M. L., & Tschantz, M. C. (2017). Exploring user perceptions of discrimination in online targeted advertising [Paper presentation]. 26th USENIX Security Symposium (USENIX Security 17) (pp. 935–951). https://www.usenix.org/conference/usenixsecurity17/technical-sessions/presentation/plane
- Schoeffer, J. (2022). A Human-Centric Perspective on Fairness and Transparency in Algorithmic Decision-Making [Paper presentation]. CHI Conference on Human Factors in Computing Systems, In Extended Abstracts (pp. 1–6). https://doi.org/10.1145/3491101.3503811
- Schoeffer, J., & Kuehl, N. (2021). Appropriate fairness perceptions? On the effectiveness of explanations in enabling people to assess the fairness of automated decision systems [Paper presentation]. Companion Publication of the 2021 Conference on Computer Supported Cooperative Work and Social Computing (pp. 153–157). https://doi.org/10.1145/3462204.3481742
- Schoeffer, J., Kuehl, N., & Machowski, Y. (2022). “There is not enough information”: On the effects of explanations on perceptions of informational fairness and trustworthiness in automated decision-making [Paper presentation]. Proceedings of the 2022 ACM Conference on Fairness, Accountability, and Transparency (pp. 1616–1628). https://doi.org/10.1145/3531146.3533218
- Schoeffer, J., Machowski, Y., & Kuehl, N. (2021). Perceptions of fairness and trustworthiness based on explanations in human vs. automated decision-making. arXiv preprint arXiv:2109.05792. https://doi.org/10.48550/arXiv.2109.05792
- Schrum, M., Ghuy, M., Hedlund-Botti, E., Natarajan, M., Johnson, M., & Gombolay, M. (2023). Concerning trends in likert scale usage in human-robot interaction: Towards improving best practices. ACM Transactions on Human-Robot Interaction, 12(3), 1–32. https://doi.org/10.1145/3572784
- Shin, D. (2021). The effects of explainability and causability on perception, trust, and acceptance: Implications for explainable AI. International Journal of Human-Computer Studies, 146, 102551. https://doi.org/10.1016/j.ijhcs.2020.102551
- Shulner-Tal, A., Kuflik, T., & Kliger, D. (2022). Fairness, explainability and in-between: Understanding the impact of different explanation methods on non-expert users’ perceptions of fairness toward an algorithmic system. Ethics and Information Technology, 24(1), 1–13. https://doi.org/10.1007/s10676-022-09623-4
- Shulner-Tal, A., Kuflik, T., & Kliger, D. (2023). Enhancing fairness perception–Towards human-centred AI and personalized explanations understanding the factors influencing laypeople’s fairness perceptions of algorithmic decisions. International Journal of Human–Computer Interaction, 39(7), 1455–1482. https://doi.org/10.1080/10447318.2022.2095705
- Silva, A., Schrum, M., Hedlund-Botti, E., Gopalan, N., & Gombolay, M. (2023). Explainable Artificial Intelligence: Evaluating the Objective and Subjective Impacts of xAI on Human-Agent Interaction. International Journal of Human–Computer Interaction, 39(7), 1390–1404. https://doi.org/10.1080/10447318.2022.2101698
- Speicher, T., Ali, M., Venkatadri, G., Ribeiro, F., Arvanitakis, G., Benevenuto, F., Gummadi, K., Loiseau, P., & Mislove, A. (2018). Potential for Discrimination in Online Targeted Advertising [Paper presentation]. Proceedings of the Conference on Fairness, Accountability, and Transparency (FAT*) PMLR 81 (pp. 5–19). https://proceedings.mlr.press/v81/speicher18a.html
- Stahl, B. C., Antoniou, J., Bhalla, N., Brooks, L., Jansen, P., Lindqvist, B., Kirichenko, A., Marchal, S., Rodrigues, R., Santiago, N., Warso, Z., & Wright, D. (2023). A systematic review of artificial intelligence impact assessments. Artificial Intelligence Review, 56(11), 1–33. https://doi.org/10.1007/s10462-023-10420-8
- Starke, C., Baleis, J., Keller, B., & Marcinkowski, F. (2022). Fairness perceptions of algorithmic decision-making: A systematic review of the empirical literature. Big Data & Society, 9(2), 205395172211151. https://doi.org/10.1177/20539517221115189
- Tal, A. S., Batsuren, K., Bogina, V., Giunchiglia, F., Hartman, A., Loizou, S. K., Kuflik, T., & Otterbacher, J. (2019). “End to end” towards a framework for reducing biases and promoting transparency of algorithmic systems [Paper presentation]. 2019 14th International Workshop on Semantic and Social Media Adaptation and Personalization (SMAP) (pp. 1–6). IEEE. https://doi.org/10.1109/SMAP.2019.8864914
- Van Berkel, N., Goncalves, J., Russo, D., Hosio, S., & Skov, M. B. (2021). Effect of information presentation on fairness perceptions of machine learning predictors [Paper presentation]. Proceedings of the 2021 CHI Conference on Human Factors in Computing Systems (pp. 1–13). https://doi.org/10.1145/3411764.3445365
- van Berkel, N., Sarsenbayeva, Z., & Goncalves, J. (2023). The methodology of studying fairness perceptions in Artificial Intelligence: Contrasting CHI and FAccT. International Journal of Human-Computer Studies, 170, 102954. https://doi.org/10.1016/j.ijhcs.2022.102954
- Vardarlier, P., & Zafer, C. (2020). Use of artificial intelligence as business strategy in recruitment process and social perspective. In Digital Business Strategies in Blockchain Ecosystems: Transformational Design and Future of Global Business (pp. 355–373). Springer. https://doi.org/10.1007/978-3-030-29739-8_17
- Wang, R., Harper, F. M., & Zhu, H. (2020). Factors influencing perceived fairness in algorithmic decision-making: Algorithm outcomes, development procedures, and individual differences [Paper presentation]. CHI Conference on Human Factors in Computing Systems, Proceedings of the 2020 (pp. 1–14). https://doi.org/10.1145/3313831.3376813
- Wang, Y., Ma, W., Zhang, M., Liu, Y., & Ma, S. (2023). A survey on the fairness of recommender systems. ACM Transactions on Information Systems, 41(3), 1–43. https://doi.org/10.1145/3547333
- Wesche, J. S., Hennig, F., Kollhed, C. S., Quade, J., Kluge, S., & Sonderegger, A. (2022). People’s reactions to decisions by human vs. algorithmic decision-makers: The role of explanations and type of selection tests. European Journal of Work and Organizational Psychology, 33(2), 146–157. https://doi.org/10.1080/1359432X.2022.2132940
- Woodruff, A., Fox, S. E., Rousso-Schindler, S., & Warshaw, J. (2018). A qualitative exploration of perceptions of algorithmic fairness [Paper presentation]. Proceedings of the 2018 CHI Conference on Human Factors in Computing Systems (pp. 1–14). https://doi.org/10.1145/3173574.3174230
- Xivuri, K., & Twinomurinzi, H. (2021). A systematic review of fairness in artificial intelligence algorithms. In Responsible AI and Analytics for an Ethical and Inclusive Digitized Society: 20th IFIP WG 6.11 Conference on e-Business, e-Services and e-Society, I3E 2021, Galway, Ireland, September 1–3, 2021, Proceedings 20 (pp. 271–284). Springer International Publishing. https://doi.org/10.1007/978-3-030-85447-8_24
- Yurrita, M., Draws, T., Balayn, A., Murray-Rust, D., Tintarev, N., & Bozzon, A. (2023)., April). Disentangling Fairness Perceptions in Algorithmic Decision-Making: The Effects of Explanations, Human Oversight, and Contestability [Paper presentation]. Proceedings of the CHI Conference on Human Factors in Computing Systems (pp. 1–21). https://doi.org/10.1145/3544548.3581161