
Abstract
This study examines the impact of visual assistance and cognitive load on situation awareness (SA) during takeover events in Level 3 (L3) autonomous driving, where drivers are permitted to engage in Non-Driving Related Tasks (NDRTs). Utilizing a driving simulator, the research explores how different NDRTs, occupying various sensory channels, influence drivers’ SA under two visual assistance conditions: full marking and key marking. Results from the Situation Awareness Global Assessment Technique (SAGAT) and NASA Task Load Index (NASA-TLX) scales, along with eye-tracking data, demonstrate significant interactions between visual assistance conditions and tasks, highlighting key marking’s superior effectiveness in enhancing SA across all NDRTs. The study reveals that cognitive workload, largely arising from NDRTs rather than road attention, remains unaffected by visual assistance conditions. Findings suggest that drivers’ strategies for allocating attention are consistent, regardless of the visual task presence. This research contributes to understanding SA in autonomous driving takeovers, offering valuable insights for developing Human-Machine Interface (HMI) designs to improve SA and takeover performance in autonomous driving systems.
1. Introduction
At present, research on takeover in autonomous driving primarily focuses on Level 3 (L3) conditional automation, where the driver is not required to constantly monitor the vehicle during autonomous operation (Matthews et al., Citation2019; McCall et al., Citation2019; Stephanidis et al., Citation1999; Tan et al., Citation2021; Wu et al., Citation2023; Xu et al., Citation2023). However, in emergencies or situations that the autonomous system cannot handle, resulting in a disengagement of the autonomous mode, the driver must respond to the vehicle’s Take-Over Request (TOR) and swiftly resume control of the driving task (Shi et al., Citation2023; Soares et al., Citation2021). This process necessitates that the driver possesses strong Situation Awareness (SA) capabilities to accurately perceive and judge the current vehicle status and make the correct decisions (Endsley, Citation2021; Stanton et al., Citation2010). The restoration of SA is a crucial component for the successful execution of a takeover.
According to the Society of Automotive Engineers (SAE On-Road Automated Vehicle Standards Committee, 2021), Automated Driving Systems (ADS) are classified into six levels, from L0 to L5, with L3 to L5 defined as systems that handle conditional or complete control of the driving task (Liang et al., Citation2021; Weigl et al., Citation2021). During L3 autonomous driving, drivers can engage in various Non-Driving Related Tasks (NDRTs) (Dillmann et al., Citation2021; Hungund & Pradhan, Citation2023; Liu et al., Citation2022). It was found that participants engaged in NDRTs more frequently in autonomous mode compared to manual driving (Rauffet et al., Citation2020; Wandtner et al., Citation2018). Non-driving tasks include reading, watching videos, browsing the internet, or making phone calls (Gruyer et al.,Citation2017). Drivers’ perceptions of NDRTs during commutes using ADS were explored through surveys and cluster analysis by Li et al. (Citation2020; Banks & Stanton, Citation2016). Their research indicates that drivers have a more positive attitude towards future ADS and suggests that working could be an advantage during commutes, thus highlighting efficient work as an essential need within autonomous driving scenarios.
In L3 autonomous driving, although drivers can engage in NDRTs, they must safely and smoothly take control of the vehicle within ADS takeover time budget in emergency situations that the ADS cannot handle, upon receiving a TOR warning (Lindgren et al., Citation2020). It is crucial to study drivers’ takeover behavior, situation awareness, and workload while engaged in NDRTs. Research found that engagement in NDRTs tends to increase takeover performance, potentially at the cost of more frequent takeovers or reduced visual attention to the forward roadway (Lee et al., Citation2021). The study also suggests that the workload increase, and SA decrease caused by NDRTs result in drivers possibly requiring more time to re-engage with the driving task and regain control; engagement in NDRTs of any kind could lead to a decrease in driver performance. Zhu et al. (Citation2022) explored how drivers’ visual engagement before a TOR in autonomous driving conditions affects their SA of the driving environment. Utilizing eye-tracking technology, the study found that longer observation times of the driving scene led to more dispersed visual attention but can generate better situation awareness. This research is significant for understanding the relationship between drivers’ visual behavior and SA in automated driving. Li et al. (Citation2023) focused on drivers’ level of SA during the operation of L3 autonomous driving systems. By introducing the theory of attention resource allocation, they conducted experiments on 90 participants in different road scenarios to develop a dynamic predictive model of SA recovery. This study provides a scientific basis for optimizing human-machine interface (HMI) in autonomous driving, contributing to enhancing road awareness among users of autonomous vehicles.
Most of the research mentioned above primarily focuses on various forms of visual information. According to Endsley (Citation1995), the process of SA recovery includes three stages: perception of many elements in the environment in terms of time and space (SA1), comprehension of their meaning (SA2), and projection of their future status (SA3). When engaged in NDRTs, the perception in the SA1 stage does not solely rely on visual channels but can also originate from auditory, tactile, and other sensory channels. Wintersberger et al. (Citation2021) investigated the performance of different modalities of NDRTs during highly automated driving, revealing that visual-manual tasks (such as using a handheld device) performed better than auditory-verbal tasks. Roche et al. (Citation2019) compared visual and auditory tasks and found that engagement in visual tasks resulted in fewer scans of the road compared to verbal tasks, but drivers responded better to auditory takeover requests during driving. Gruden et al. (Citation2022) discovered that drivers react faster to auditory alerts compared to tactile alerts. These findings suggest the importance of integrating multisensory cues to enhance SA and takeover readiness in autonomous driving, emphasizing the need for designing HMI that effectively utilize auditory and tactile feedback to support visual information, thereby facilitating quicker and safer takeover transitions.
In addition to detailed studies on NDRTs, SA, and takeover performance, researchers have proposed intervention measures designed to mitigate the risks associated with ADS usage and NDRTs. Cohen-Lazry et al. (Citation2020) conducted two experiments to examine the role of auditory feedback in takeover situations, finding that participants who received continuous feedback scored significantly higher in road scanning and significantly lower in NDRTs compared to those who received no feedback. Lu et al. (Citation2019) employed verbal monitoring cues prior to issuing takeover requests, showing that drivers who received cues demonstrated better takeover performance than those who did not receive any cues. Interventions through training for improving takeover performance and SA recovery were explored by researchers (Sahaï et al., Citation2021; Vogelpohl et al., Citation2020), revealing that training/education can help drivers take over more quickly and effectively. Feinauer et al. (Citation2022) provided training using gamified, non-gamified methods, and user manuals, with participants who received gamified information showing some improvement in the application of situational knowledge.
While previous studies have primarily used various forms of prompt information to provide decision support to drivers, they fundamentally rely on the computational capabilities of the automation system itself. Enhancing the driver’s SA level at the time of takeover and designing appropriate assistance methods to help drivers acquire as much environmental information as possible are crucial. Based on existing research, we propose an assistance design based on the salience of visual information. This study addresses the reduction in SA among drivers engaged in non-driving tasks during the autonomous driving takeover process. By marking visual information, it aims to enhance the driver’s level of SA, thereby assisting drivers in making better takeover decisions. The effectiveness of this assistance is tested through simulated driving experiments. This study primarily designs two visual assistance conditions for autonomous driving takeover and validates the feasibility of these designs through the Situation Awareness Global Assessment Technique (SAGAT) scale (Endsley, Citation1988) and eye-tracking data analysis (Vansteenkiste et al., Citation2015), providing insights for future research development and application.
2. Methods
2.1. Participants
The experiment recruited 36 participants, with an age range of 18–50 years. The selection criteria required participants to have uncorrected or corrected visual acuity between 4.9 and 5.0, without any conditions such as 3D vertigo or susceptibility to motion sickness. Among those who completed the experiment, there were 21 males and 15 females; 21 participants had extensive driving experience, while 9 had limited driving experience; 8 participants had experience with autonomous driving, whereas 28 did not. After confirming their eligibility for the study, participants provided written informed consent following the research ethics protocols approved by our institute.
2.2. Instruments and materials
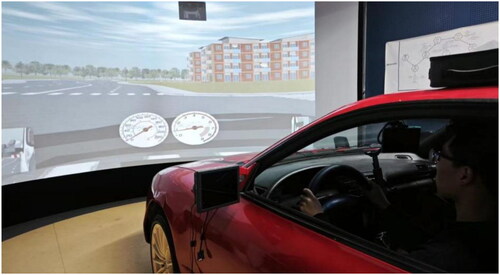
The experiment was conducted using the driving simulator at the HMI Design Lab at our institute. The architecture of the simulation scene experimental platform and data collection equipment is shown in . The platform includes a real car 1:1 modified driving simulator, professional projector, surround screen, and sound system, connected to the autonomous driving simulation software SCANeR Studio 2024, enabling simulation experiments for both manual and autonomous driving. The steering wheel, accelerator pedal, and brake pedal during the driving simulation meet the driving requirements of a real vehicle. The experiment utilized an L3 autonomous driving module, allowing for switching between autonomous and manual driving modes. Eye-tracking data were collected using the wearable head-mounted eye tracker Tobii Pro Glasses2 from Tobii company. This eye tracker has a sampling rate of 50 Hz or 100 Hz, a camera resolution of 1920*1080 pixels, supports corneal reflection, binocular collection, and dark pupil tracking technology.
Figure 1. Experimental vehicle and simulator.
2.3. Experimental design
2.3.1. Road scenario design
The experimental driving route was designed to mimic urban scenarios. The overall scene utilized the Community map on SCANeR Studio 2024, comprising both bidirectional four-lane and two-lane roads, with four driving paths designed to trigger takeover events. The road design was based on key events for control transition in autonomous driving takeover research, selecting four representative events where the system’s longitudinal function is limited: a decelerating vehicle ahead requiring a lane change, a stationary obstacle in the driving lane, pedestrian intrusion, and a vehicle cutting into the lane from adjacent lanes (Gold et al., Citation2016). The driving experiment consists of two parts: the autonomous driving part before the takeover and the part after the takeover. Before the takeover, the car autonomously drives at L3, with the system maintaining a speed of 40–50 km/h on low-density roads, staying to the right. The takeover request triggers the takeover event, and the vehicle speed is automatically reduced afterward to facilitate observation by the participant.
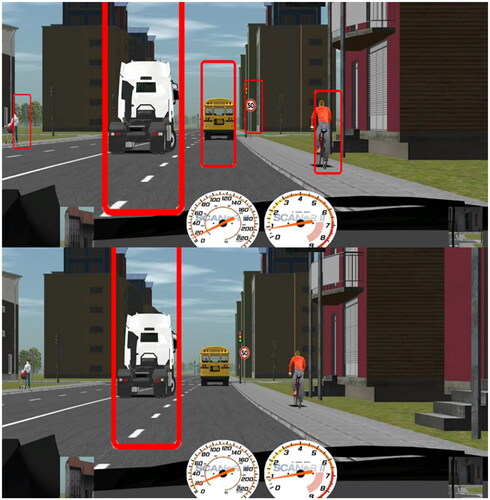
During simulator studies on autonomous driving, it was found that takeover times increased, and SA decreased when operating NDRTs under ADS driving conditions (Carsten et al., Citation2012; Merat et al., Citation2012). Our experiment is based on this finding as a foundation for research. According to Vlakveld et al. (Citation2018), drivers with a 6-s recovery time to manual driving had a better understanding of the relevant information about the environment after the transition than those with a 4-s recovery time. We propose that a visual information highlighting design, initiated after the takeover command, aids in the recovery of SA. Based on this, after the autonomous driving system issues a takeover prompt, we mark driving-related elements within the current visual range with red circles and follow the movement of these elements until the driver takes over the system. Since excessive marking of visual elements could lead to high cognitive load and thus affect the acquisition of current situational visual information, this study designed two approaches: full marking and key marking conditions, to investigate the impact of different levels of assistance information on the acquisition of driver SA (see ).
Figure 2. The driving scenarios, i.e., full marking condition (top) and key marking (bottom) condition.
2.3.2. Takeover process and experiment procedure
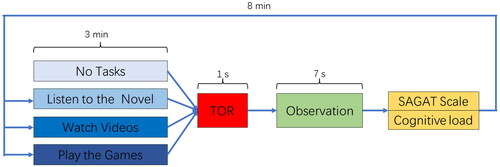
After the start of the experiment, the vehicle operates in autonomous mode, and the participants engage in a 3-min NDRTs session. The tasks include no task, visual task (watching videos), auditory task (listening to audiobooks), and visual-manual task (playing games), with task operations performed on a tablet. Participants wear an eye tracker throughout the experiment. Based on existing research, the time budget for the TOR was set as 7 s, which is a typical value in current studies (Eriksson & Stanton, Citation2017). The system issues a takeover command 7 s before a potential collision with other traffic elements. The takeover command consists of a repeating alert sound lasting 1 s. Simultaneously with the takeover command, the road in the driving simulation platform displays the marked information content. Upon hearing the takeover command sound, the driver stops performing NDRTs and shifts attention to the driving scene. At this point, the driver does not need to take actual takeover actions to avoid an accident, as the vehicle automatically reduces speed and continues to do so until the simulation ends. After the simulation ends, participants complete measures of SA and cognitive load, then rest for 8 min before proceeding to the next NDRTs. The takeover and experimental procedures are illustrated in .
Figure 3. The takeover and experimental procedures.
2.4. Measurement parameters and data analysis
2.4.1. Direct SA measurement
This study employs the SAGAT for measurement. It is a widely used freeze-probe method of measuring SA, requiring participants to engage in tasks within a simulated environment. At designated time points, the experiment is paused to allow participants to better understand their current environment and grasp the actual situation. This objective and direct method of measuring SA has been extensively applied in controlled environments for assessing SA (Zhang et al., Citation2023). In this study, based on the takeover scenarios prepared earlier, elements such as pedestrians, cars, and traffic lights are identified as components within the scene. These elements are categorized according to their impact on the takeover event into primary elements, general elements, and vehicle elements. Primary elements are the main influencers of the takeover, general elements are potential traffic participants that could interfere with the takeover, and vehicle elements include in-car facilities like rearview mirrors and dashboards. Assessment questions are formulated based on the characteristics of L1 (SA1) and L2 (SA2) SA, along with screenshots of scenarios excluding traffic participants to create the SAGAT questionnaire, consisting of 11 questions. After each round of the driving simulation experiment, the questionnaire is presented to the participants, who then answer based on the information from the recent scenario. SA scores are determined by the match between participants’ responses and the actual scenario. Specific questions are referenced in Appendix A.
2.4.2. Cognitive workload
Given the tasks are multimodal, it is necessary to investigate the relationship between cognitive workload and SA when performing different NDRTs. For this purpose, we utilized the NASA Task Load Index (NASA_TLX) scale. This scale comprises six sub-scales: Mental Demand (MD), Physical Demand (PhD), Temporal Demand (TD), Performance (Per), Effort (E), and Frustration Level (FL). The scores for each item are incremented in 21 levels, and the cognitive workload level is assessed by integrating the scores from the sub-scales. The internal consistency coefficient of the scale is 0.67. To evaluate the cognitive workload of drivers under all task conditions before the TOR, we used the NASA-TLX weighted score (Cao et al., Citation2009).
2.4.3. Eye-tracking
In this study, we selected several commonly used metrics related to SA and attention allocation for measurement.
Fixation Distribution: A fixation refers to an eye movement where the eyes remain within a radius of 30 pixels for an average duration exceeding 100ms. The intuitive distribution of fixations can be observed through heatmaps, reflecting the participants’ overall focus range and key focus areas. This distribution reveals the participants’ perception and understanding of the situation during the autonomous driving takeover process.
Areas of Interest (AOI) Fixation Duration: AOI are delineated manually (Manual mapping) to include traffic participation elements, categorized into primary elements, general elements, and vehicle elements according to research needs. The total fixation duration on AOIs, excluding vehicle element AOIs, is calculated to determine the AOI fixation duration.
First Fixation Time: The first fixation time refers to the time from the issuance of the takeover request to when the driver first places their gaze on an AOI. It reflects the driver’s prioritization in information acquisition.
Total Scan Path Length: The distance from one fixation point to another constitutes the scan path length, with the sum of all scan path lengths being the total scan path length. The scan path length reflects the participant’s understanding ability in information acquisition; shorter lengths indicate better situation awareness.
Saccade Duration: A saccade is a rapid movement of the eye between fixation points. The duration of saccades may be related to the difficulty level of information acquisition by the driver.
2.4.4. Data processing
Initially, raw data from the NASA-TLX and SAGAT questionnaires are processed. For NASA-TLX, the quantity selected for each dimension serves as the weight, and the sum of the weighted scores for each dimension constitutes the final score. SAGAT scores are composed of the sum of scores for each question and can be divided into SA1 scores and SA2 scores according to the classification types of situation awareness. Subsequently, total scan path length and normalized pupil diameter are calculated according to specific formulas. IBM SPSS 24.0 is utilized for data analysis. A repeated measures Analysis of Variance (ANOVA) tests the differences in participant performance across different cognitive workload tasks. Specifically, the independent variable is the type of cognitive task, including no task, listening to novels, watching videos on TikTok, and playing games. Dependent variables include cognitive workload, situation awareness, the proportion of AOI fixation duration, first fixation time, and saccade duration. An ANOVA is conducted for each dependent variable. If the ANOVA results are significant, further post-hoc pairwise comparisons are performed (with Bonferroni correction).
3. Results
3.1. SA measurement (see )
The main effect of the visual assistance method was significant (F(2,32)=41.65, p < 0.001), as was the main effect of the task (F(3,96)=100.44, p < 0.001), and the interaction between visual assistance method and task was significant (F(6,96)=11.70, p < 0.001).
Figure 4. The SAGAT score, i.e., comparing visual assistance within a fixed task type (top) and comparing task types within a fixed visual assistance (bottom).
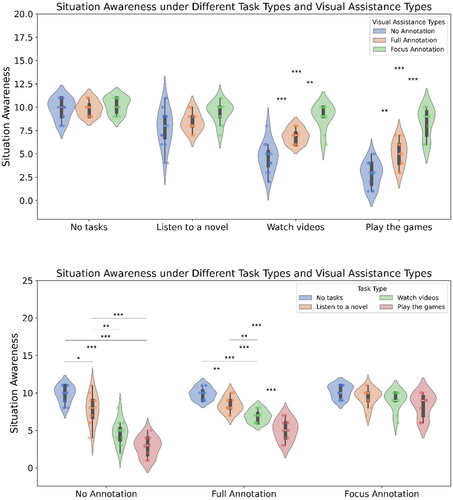
Simple effects analysis, with Bonferroni correction applied, showed that for situation awareness, under the no-marking visual assistance condition, the no-task condition was significantly higher than listening to novels (t = 3.55, p = 0.028). The listening to novels condition was significantly higher than playing games (t = 9.19, p < 0.001), significantly higher than watching TikTok videos (t = 5.27, p = 0.002), the no-task condition was significantly higher than playing games (t = 13.13, p < 0.001), and significantly higher than watching TikTok videos (t = 8.60, p < 0.001). There was no significant difference between playing games and watching TikTok videos (t = 3.12, p = 0.052).
Under the full-marking visual assistance condition, the no-task condition was significantly higher than listening to novels (t = 4.45, p = 0.006), listening to novels was significantly higher than playing games (t = 6.32, p < 0.001), significantly higher than watching TikTok videos (t = 4.45, p = 0.006), the no-task condition was significantly higher than playing games (t = 11.93, p < 0.001), and significantly higher than watching TikTok videos (t = 8.62, p < 0.001). Watching TikTok videos was significantly higher than playing games (t = 5.70, p < 0.001).
Under the key-marking visual assistance condition, there were no significant differences between different task conditions (|t|s < 3.19, ps > .057).
With no task, there was no significant difference between the visual assistance methods (|t|s < 0.84, ps = 1.000); with the task of listening to novels, there was no significant difference between the visual assistance methods (|t|s < 2.47, ps > .072). With the task of watching TikTok videos, key-marking visual assistance significantly outperformed full-marking (t = 4.48, p = 0.001) and was significantly higher than no marking (t = 7.02, p < .001), with full marking significantly higher than no marking (t = 4.33, p < 0.001). In the playing games task condition, key-marking visual assistance was significantly higher than full marking (t = 5.19, p < 0.001), significantly higher than no marking (t = 8.88, p < 0.001), and full marking was significantly higher than no marking (t = 4.09, p = 0.001).
3.2. Cognitive load Measurement (see )
The main effect of the visual assistance method was not significant (F(2,26)=0.47, p = 0.628), the main effect of the task was significant (F(3,78)=42.55, p < 0.001), and the interaction between visual assistance method and task was significant (F(6,84)=6.19, p < 0.001).
Figure 5. The cognitive load score, i.e., comparing visual assistance within a fixed task type (top) and comparing task types within a fixed visual assistance (bottom).
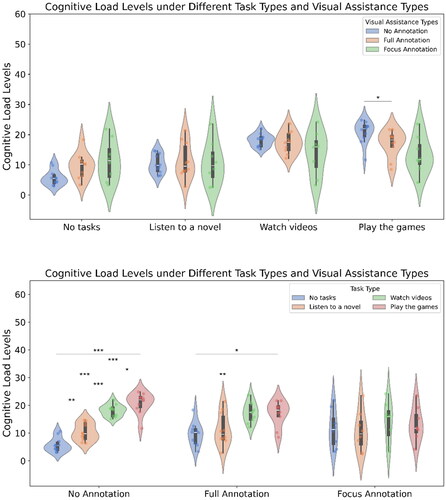
Simple effects analysis, with Bonferroni correction applied, indicated that for cognitive load, under the no-marking visual assistance condition, the listening to novels task condition was significantly higher than the no-task condition (t = 4.79, p = 0.004). The playing games task condition was significantly higher than listening to novels (t = 9.41, p < 0.001), watching TikTok videos was significantly higher than listening to novels (t = 8.19, p < 0.001), playing games was significantly higher than the no-task condition (t = 10.77, p < 0.001), and watching TikTok videos was significantly higher than the no-task condition (t = 11.43, p < 0.001). The playing games condition was significantly higher than watching TikTok (t = 3.30, p = 0.048).
Under the full-marking visual assistance condition, the playing games condition was significantly higher than the no-task condition (t = 3.82, p = 0.025), and watching TikTok videos was significantly higher than the no-task condition (t = 5.68, p = 0.002). There were no significant differences between other task conditions (|t|s < 3.09, ps >.078).
Under the key-marking visual assistance condition, there were no significant differences between different task conditions (|t|s < 1.82, ps >.670).
With no task, there was no significant difference between different visual assistance methods (|t|s < 2.53, ps >.071). In the listening to novels task condition, there was no significant difference between different visual assistance methods (|t|s < 0.48, ps = 1.000). In the watching TikTok task condition, there was no significant difference between different visual assistance methods (|t|s < 1.57, ps >.471). In the playing games task condition, the no-marking method was significantly higher than the full-marking method (t = 3.18, p = 0.027), with no significant differences between other visual assistance methods (|t|s < 2.12, ps >.146).
3.3. Eye-tracking measurement
3.3.1. AOI fixation duration (see )
The main effect of the visual assistance method was significant (F(2,28)=9.80, p < 0.001), as was the main effect of the task (F(3,84)=8.23, p < 0.001), and the interaction between visual assistance method and task was significant (F(6,84)=3.76, p = 0.002).
Figure 6. The AOI fixation duration, i.e., comparing visual assistance within a fixed task type (top) and comparing task types within a fixed visual assistance (bottom).
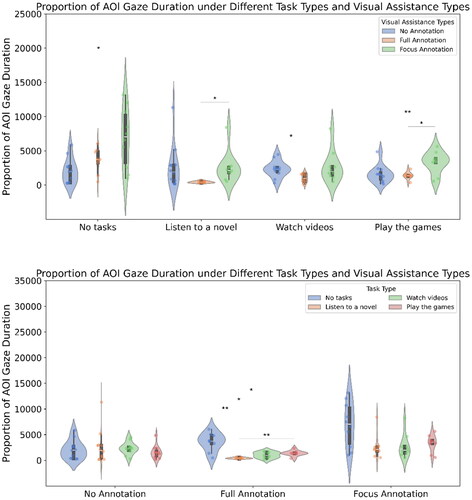
Simple effects analysis, with Bonferroni correction applied, showed that for AOI fixation duration, under the no-marking visual assistance condition, there was no significant difference between the different task conditions (|t|s < 1.57, ps > .873). Under the full-marking visual assistance condition, the no-task condition was significantly longer than listening to novels (t = 5.45, p = 0.004), the playing games condition was significantly longer than listening to novels (t = 5.25, p = 0.005), the no-task condition was significantly longer than playing games (t = 3.89, p = .028), and significantly longer than watching TikTok videos (t = 4.21, p = 0.018). There was no significant difference between listening to novels and watching TikTok videos (t = 2.91, p = 0.118), nor between playing games and watching TikTok videos (t = 1.33, p = 1.000).
Under the key-marking visual assistance condition, there was no significant difference between the different task conditions (|t|s < 3.35, ps >.051).
With no task, key-marking visual assistance was significantly higher than no marking (t = 3.31, p = 0.019), with no significant differences between other visual assistance methods (|t|s < 2.25, ps > .132). In the task of listening to novels, key-marking visual assistance was significantly higher than full marking (t = 3.06, p = 0.040), with no significant differences between other visual assistance methods (|t|s < 2.38, ps >.110). In the task of watching TikTok videos, no marking was significantly higher than full marking (t = 3.37, p = 0.011), with no significant differences between other visual assistance methods (|t|s < 2.23, ps >.147). In the playing games task condition, key-marking visual assistance was significantly higher than full marking (t = 3.76, p = 0.009), and key marking was significantly higher than no marking (t = 2.87, p = 0.031), with no significant difference between full marking and no marking (t = 0.52, p = 1.000).
3.3.2. First fixation time (see )
The main effect of the visual assistance method was significant (F(2,28)=5.33, p = 0.011), the main effect of the task was not significant (F(3,84)=1.56, p < 0.204), and the interaction between visual assistance method and task was significant (F(6,84)=3.30, p = 0.006).
Figure 7. The first fixation time, i.e., comparing visual assistance within a fixed task type (top) and comparing task types within a fixed visual assistance (bottom).
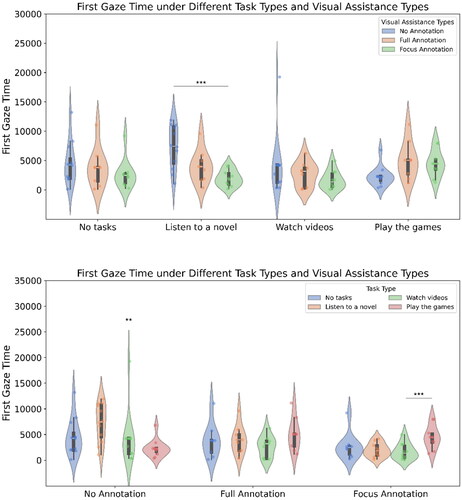
Simple effects analysis, with Bonferroni correction applied, indicated that for the first fixation time, under the no-marking visual assistance condition, the listening to novels task condition was significantly longer than playing games (t = 4.65, p = .004), with no significant differences between the other task conditions (|t|s < 2.05, ps >.393). Under the full-marking visual assistance condition, there were no significant differences between the different task conditions (|t|s < 1.63, ps >.851). Under the key-marking visual assistance condition, the playing games task condition was significantly longer than watching TikTok (t = 7.04, p < 0.001), with no significant differences between the other task conditions (|t|s < 3.18, ps >.067).
With no task, there was no significant difference between the visual assistance methods (|t|s < 1.46, ps >.484). In the listening to novels task condition, the no-marking visual assistance was significantly longer than key marking (t = 4.70, p < 0.001), with no significant differences between other visual assistance methods (|t|s < 2.41, ps >.079). In the watching TikTok task condition, there were no significant differences between visual assistance methods (|t|s < 1.65, ps >.366). In the playing games task condition, there were no significant differences between visual assistance methods (|t|s < 2.59, ps >.059).
3.3.3. Saccade duration (see )
The main effect of the visual assistance method was significant (F(2,28)=9.48, p < 0.001), as was the main effect of the task (F(3,84)=8.04, p < 0.001), and the interaction between visual assistance method and task was significant (F(6,84)=4.28, p < 0.001).
Figure 8. The saccade duration, i.e., comparing visual assistance within a fixed task type (top) and comparing task types within a fixed visual assistance (bottom).
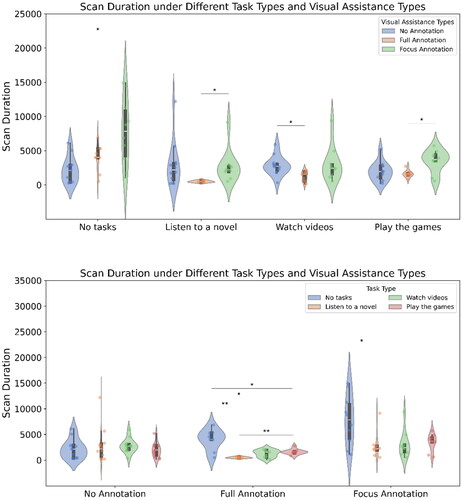
Simple effects analysis, with Bonferroni correction applied, indicated that for saccade duration, under the no-marking visual assistance condition, there were no significant differences between tasks (|t|s < 1.46, ps = 1.000). Under the full-marking condition, the no-task condition was significantly longer than listening to novels (t = 5.39, p = 0.004), playing games was significantly longer than listening to novels (t = 6.53, p = 0.001), no-task was significantly longer than playing games (t = 3.92, p = 0.027), and significantly longer than watching TikTok videos (t = 3.82, p = 0.031). There was no significant difference between watching TikTok and listening to novels (t = 3.20, p = 0.075), nor between playing games and watching TikTok (t = 1.17, p = 1.000).
Under the key-marking condition, the no-task condition was significantly longer than listening to novels (t = 3.42, p = 0.046), with no significant differences between other task conditions (|t|s < 2.69, ps >.149).
With no task, key-marking was significantly longer than no marking (t = 3.43, p = 0.016), with no significant differences between other visual assistance methods (|t|s < 17.04, ps >.126). In the listening to novels task, key-marking was significantly longer than full marking (t = 2.97, p = 0.047), with no significant differences between other visual assistance methods (|t|s < 2.49, ps >.090). In watching TikTok videos, no marking was significantly longer than full marking (t = 3.32, p=.012), with no significant differences between other visual assistance methods (|t|s < 2.13, ps >.175). In playing games, key-marking was significantly longer than full marking (t = 3.55, p = 0.014), with no significant differences between other visual assistance methods (|t|s < 2.42, ps > .079).
4. Discussion
4.1. The impact of different NDRTs on SA with two visual assistance conditions
This study’s findings reveal a significant interaction between visual assistance methods and tasks. Thus, SA changes with the variation of markings while performing different NDRTs. In the eye-tracking analysis, the main effect of the NDRTs task on the first fixation time was not significant. This indicates that regardless of the type of NDRTs performed prior to the takeover request, there was no difference in the time taken to first fixate on the road upon hearing the takeover request. This also corroborates the study conducted by Zeeb et al. (Citation2015). Using the k-means clustering algorithm for clustering analysis of fixation parameters, they found that although there were some significant differences in takeover behaviors, the differences in the first fixation on the road between groups were not significant.
4.2. The key-marking visual assistance condition has a greater impact on changes in SA
Based on the results from SAGAT, AOI fixation duration, and total scan time, it was observed that regardless of the type of NDRTs performed, the scores for key marking were significantly higher than those for full marking and no marking. This suggests that key marking provides a more effective aid in helping drivers understand the information obtained and assists participants in more quickly identifying the primary factors affecting the takeover situation. Higher dwell times within AOIs may indicate that individuals conducted a more detailed assessment of information in certain areas. In terms of the duration of scans within AOIs, there was no significant difference between key marking and no marking when performing visual tasks, auditory tasks, and visual-manual tasks. However, SA was significantly higher for key marking than for no marking. This implies that there is no difference in the redistribution of attention after SA recovery. Participating in detection tasks with visual involvement does not change the level of interconnectedness among different information elements extracted by drivers from the driving environment. Regardless of whether a visual detection task is present, the strategy drivers use to allocate attention is similar.
4.3. Full marking condition has some impact on the cognitive resource occupancy for auditory tasks
First fixation time is an indicator that assesses how quickly a driver can notice key information after starting to observe. It reflects whether the driver can quickly understand the obtained information and swiftly focus attention on the most important information. By evaluating the time, it takes for a driver to notice key information from the start of observation, first fixation time can indicate whether the driver can rapidly comprehend the current information and thus allocate attention to more important information. According to the results, the impact of the visual assistance condition by task type is not pronounced; however, under full marking, auditory tasks are slightly more impacted than visual and visual-manual tasks. This suggests that full marking has a certain effect when cognitive resources through the auditory channel are occupied, but the effect is not clear when cognitive resources through the visual channel are occupied. This could be because participants, while engaged in auditory tasks, still maintain most of their visual resources on the driving scenario. The full marking method can serve to somewhat compensate for the visual resources. However, when visual resources are heavily occupied by visual tasks, using full marking can no longer timely replenish the needed visual resources.
4.4. Impact on cognitive workload
In our experiment, under no-task, visual, auditory, and visual-manual operation tasks, none of the visual assistance conditions impacted cognitive workload. This is consistent with findings from other researchers’ study, where NASA-TLX scores did not show significant differences across three experimental conditions. This may be because, during autonomous driving, cognitive workload primarily originates from performing NDRTs rather than focusing on the road. Walker et al. (Citation2019) examined real-time changes in driver trust and attention and found that participants spent more time on secondary tasks and less time observing the road. Research on L2 and L3 automation found a decrease in drivers’ visual attention to the main road, indicating an increase in attention to NDRTs (Naujoks et al., Citation2018). Additionally, due to potential confounding factors before the takeover, such as cognitive workload and environmental impacts (e.g., lighting), pupil diameter size was not considered an effective measure in the assessment (Mathôt et al., Citation2018). Therefore, we did not use pupil diameter size in our eye-tracking experiment.
5. Conclusions
During the operation of L3 autonomous driving, drivers are allowed to engage in NDRTs that are unrelated to driving. It is only when the system issues a TOR due to malfunctions, limitations, or sudden events that drivers need to take control of the system and perform manual driving tasks. In this process, drivers need to undergo perception transfer, cognitive processing, and decision-making to finally make appropriate takeover actions. Drivers need to acquire good SA through visual search to provide a basis for takeover decisions, which in turn affects takeover performance. It is necessary to explore the impact mechanism of drivers’ cognitive load on SA during the takeover process of L3 autonomous driving and explore methods to improve their level of situation awareness.
This study first used a driving simulator to simulate takeover tasks in L3 autonomous driving, experimenting with how the cognitive load brought by NDRTs, which occupy different sensory channel cognitive resources, affects drivers’ SA of the takeover scenario. Through the investigation of existing research, we found that with the increased use of ADS, drivers engage more in NDRTs during driving, pay less attention to the road ahead, and experience reduced workload. However, this increases takeover time and the response time of the first action, reduces SA, and thus brings concerning effects on predicting and mitigating dangers. Providing interventions or HMI feedback is a way to improve SA and takeover performance. Based on this, we designed two visual assistance conditions by marking the traffic elements in the takeover scenario: full marking (i.e., marking all traffic participation elements) and key marking (i.e., marking key elements affecting the takeover). We measured participants’ direct SA and cognitive load using the SAGAT questionnaire and NASA-TLX scale and obtained eye movement evidence using a head-mounted eye tracker. The results show that both designs have a significant impact on improving SA, with key marking having a greater impact.
This study provides a detailed discussion on SA during the takeover process in L3 autonomous driving. The conclusions can provide direction for research on SA in the field of autonomous driving and offer theoretical foundations and design ideas for the design of autonomous driving takeover HMI.
Institutional review board statement
The study was conducted according to the guidelines of the Declaration of Helsinki and approved by the Ethics Committee of the Beijing Normal University (Code: 202403040052).
Disclosure statement
No potential conflict of interest was reported by the author(s).
Additional information
Notes on contributors
Yancong Zhu
Yancong Zhu is a lecturer at Faculty of Psychology at Beijing Normal University. Her research interests include human factors, ergonomics, interactive technology, and maker education. She received her Ph.D. at School of Biological Science and Medical Engineering at Beihang University.
Chengyu Li
Chengyu Li is a master student at Faculty of Psychology at Beijing Normal University. His research interests include cognitive psychology and user system interaction design.
Zixuan Qiao
Zixuan Qiao is a master student at Faculty of Psychology at Beijing Normal University. His research interests include applied psychology and user system interaction design.
Rong Qu
Rong Qu is a master student at Faculty of Psychology at Beijing Normal University. Her research interests include cognitive psychology and applied psychology.
Yu Wang
Yu Wang is a master student at Faculty of Psychology at Beijing Normal University. His research interests include experimental psychology and user interface design.
Jiaqing Xiong
Jiaqing Xiong is a master student at Faculty of Psychology at Beijing Normal University. His research interests include cognitive neuroscience and human-computer interaction.
Wei Liu
Wei Liu is an associate professor and leads the user experience master program at Faculty of Psychology at Beijing Normal University. His research interests include engineering psychology, user experience, interaction design, and entrepreneurship education. He received his Ph.D. at Faculty of Industrial Design Engineering at Delft University of Technology.
References
- Banks, V. A., & Stanton, N. A. (2016). Keep the driver in control: Automating automobiles of the future. Applied Ergonomics, 53 Pt B, 389–395. https://doi.org/10.1016/j.apergo.2015.06.020
- Carsten, O., Lai, F. C., Barnard, Y., Jamson, A. H., & Merat, N. (2012). Control task substitution in semiautomated driving: Does it matter what aspects are automated? Human Factors, 54(5), 747–761. https://doi.org/10.1177/0018720812460246
- Cao, A., Chintamani, K. K., Pandya, A. K., & Ellis, R. D. (2009). NASA TLX: Software for assessing subjective mental workload. Behavior Research Methods, 41(1), 113–117. https://doi.org/10.3758/BRM.41.1.113
- Cohen-Lazry, G., Borowsky, A., & Oron-Gilad, T. (2020). The impact of auditory continual feedback on take-overs in Level 3 automated vehicles. Transportation Research Part F: Traffic Psychology and Behaviour, 75, 145–159. https://doi.org/10.1016/j.trf.2020.10.003
- Dillmann, J., Den Hartigh, R. J. R., Kurpiers, C. M., Raisch, F. K., De Waard, D., & Cox, R. F. A. (2021). Keeping the driver in the loop in conditionally automated driving: A perception-action theory approach. Transportation Research Part F: Traffic Psychology and Behaviour, 79, 49–62. https://doi.org/10.1016/j.trf.2021.03.003
- Endsley, M. R. (2021). Situation awareness. In Handbook of human factors and ergonomics (pp. 434–455). John Wiley & Sons Inc.
- Endsley, M. R. (1995). Measurement of situation awareness in dynamic systems. Human Factors: The Journal of the Human Factors and Ergonomics Society, 37(1), 65–84. https://doi.org/10.1518/001872095779049499
- Endsley, M. R. (1988). Design and evaluation for situation awareness enhancement. Proceedings of the Human Factors Society Annual Meeting, 32(2), 97–101. https://doi.org/10.1177/154193128803200221
- Eriksson, A., & Stanton, N. A. (2017). Takeover time in highly automated vehicles: Noncritical transitions to and from manual control. Human Factors, 59(4), 689–705. https://doi.org/10.1177/0018720816685832
- Feinauer, S., Schuller, L., Groh, I., Huestegge, L., & Petzoldt, T. (2022). The potential of gamification for user education in partial and conditional driving automation: A driving simulator study. Transportation Research Part F: Traffic Psychology and Behaviour, 90, 252–268. https://doi.org/10.1016/j.trf.2022.08.009
- Gold, C., Körber, M., Lechner, D., & Bengler, K. (2016). Taking over control from highly automated vehicles in complex traffic situations: The role of traffic density. Human Factors, 58(4), 642–652. https://doi.org/10.1177/0018720816634226
- Gruden, T., Tomažič, S., Sodnik, J., & Jakus, G. (2022). A user study of directional tactile and auditory user interfaces for take-over requests in conditionally automated vehicles. Accident; Analysis and Prevention, 174, 106766. https://doi.org/10.1016/j.aap.2022.106766
- Gruyer, D., Magnier, V., Hamdi, K., Claussmann, L., Orfila, O., & Rakotonirainy, A. (2017). Perception, information processing and modeling: Critical stages for autonomous driving applications. Annual Reviews in Control, 44, 323–341. https://doi.org/10.1016/j.arcontrol.2017.09.012
- Hungund, A. P., & Pradhan, A. K. (2023). Impact of non-driving related tasks while operating automated driving systems (ADS): A systematic review. Accident; Analysis and Prevention, 188, 107076. https://doi.org/10.1016/j.aap.2023.107076
- Lee, S. C., Yoon, S. H., & Ji, Y. G. (2021). Effects of non-driving-related task attributes on takeover quality in automated vehicles. International Journal of Human–Computer Interaction, 37(3), 211–219. https://doi.org/10.1080/10447318.2020.1815361
- Li, M., Feng, Z., Zhang, W., Wang, L., Wei, L., & Wang, C. (2023). How much situation awareness does the driver have when driving autonomously? A study based on driver attention allocation. Transportation Research Part C: Emerging Technologies, 156, 104324. https://doi.org/10.1016/j.trc.2023.104324
- Li, X., Schroeter, R., Rakotonirainy, A., Kuo, J., & Lenné, M. G. (2020). Effects of different non-driving-related-task display modes on drivers’ eye-movement patterns during take-over in an automated vehicle. Transportation Research Part F: Traffic Psychology and Behaviour, 70, 135–148. https://doi.org/10.1016/j.trf.2020.03.001
- Liang, N., Yang, J., Yu, D., Prakah-Asante, K. O., Curry, R., Blommer, M., Swaminathan, R., & Pitts, B. J. (2021). Using eye-tracking to investigate the effects of pre-takeover visual engagement on situation awareness during automated driving. Accident; Analysis and Prevention, 157, 106143. https://doi.org/10.1016/j.aap.2021.106143
- Lindgren, T., Fors, V., Pink, S., & Osz, K. (2020). Anticipatory experience in everyday autonomous driving. Personal and Ubiquitous Computing, 24(6), 747–762. https://doi.org/10.1007/s00779-020-01410-6
- Liu, W., Zhu, Y., Huang, R., Ohashi, T., Auernhammer, J., Zhang, X., Shi, C., & Wang, L. (2022). Designing interactive glazing through an engineering psychology approach: Six augmented reality scenarios that envision future car human-machine interface. Virtual Reality & Intelligent Hardware, 5(2), 157–170. https://doi.org/10.1016/j.vrih.2022.07.004
- Lu, Z., Zhang, B., Feldhütter, A., Happee, R., Martens, M., & De Winter, J. C. (2019). Beyond mere take-over requests: The effects of monitoring requests on driver attention, take-over performance, and acceptance. Transportation Research Part F: Traffic Psychology and Behaviour, 63, 22–37. https://doi.org/10.1016/j.trf.2019.03.018
- Mathôt, S., Fabius, J., Van Heusden, E., & van der Stigchel, S. (2018). Safe and sensible preprocessing and baseline correction of pupil-size data. Behavior Research Methods, 50(1), 94–106. https://doi.org/10.3758/s13428-017-1007-2
- Matthews, G., Neubauer, C., Saxby, D. J., Wohleber, R. W., & Lin, J. (2019). Dangerous intersections? A review of studies of fatigue and distraction in the automated vehicle. Accident; Analysis and Prevention, 126, 85–94. https://doi.org/10.1016/j.aap.2018.04.004
- Merat, N., Jamson, A. H., Lai, F. C., & Carsten, O. (2012). Highly automated driving, secondary task performance, and driver state. Human Factors, 54(5), 762–771. https://doi.org/10.1177/0018720812442087
- McCall, R., McGee, F., Mirnig, A., Meschtscherjakov, A., Louveton, N., Engel, T., & Tscheligi, M. (2019). A taxonomy of autonomous vehicle handover situations. Transportation Research Part A: Policy and Practice, 124, 507–522. https://doi.org/10.1016/j.tra.2018.05.005
- Naujoks, F., Höfling, S., Purucker, C., & Zeeb, K. (2018). From partial and high automation to manual driving: Relationship between non-driving related tasks, drowsiness and take-over performance. Accident; Analysis and Prevention, 121, 28–42. https://doi.org/10.1016/j.aap.2018.08.018
- Rauffet, P., Botzer, A., Chauvin, C., Saïd, F., & Tordet, C. (2020). The relationship between level of engagement in a non-driving task and driver response time when taking control of an automated vehicle. Cognition, Technology & Work, 22(4), 721–731. https://doi.org/10.1007/s10111-019-00611-1
- Roche, F., Somieski, A., & Brandenburg, S. (2019). Behavioral changes to repeated takeovers in highly automated driving: Effects of the takeover-request design and the nondriving-related task modality. Human Factors, 61(5), 839–849. https://doi.org/10.1177/0018720818814963
- SAE On-Road Automated Vehicle Standards Committee. (2014). Taxonomy and definitions for terms related to on-road motor vehicle automated driving systems. SAE Standard Journal 3016, 1.
- Sahaï, A., Barré, J., & Bueno, M. (2021). Urgent and non-urgent takeovers during conditional automated driving on public roads: The impact of different training programmes. Transportation Research Part F: Traffic Psychology and Behaviour, 81, 130–143. https://doi.org/10.1016/j.trf.2021.06.001
- Shi, J., Wu, C., Zheng, H., Zhang, W., Zhang, X., Lu, P., & Chai, C. (2023). Toward hazard or action? Effects of directional vibrotactile takeover requests on takeover performance in automated driving. International Journal of Human–Computer Interaction, 39(19), 3786–3801. https://doi.org/10.1080/10447318.2022.2105479
- Soares, S., Lobo, A., Ferreira, S., Cunha, L., & Couto, A. (2021). Takeover performance evaluation using driving simulation: A systematic review and meta-analysis. European Transport Research Review, 13(1), 18. https://doi.org/10.1186/s12544-021-00505-2
- Stanton, N. A., Salmon, P. M., Walker, G. H., & Jenkins, D. P. (2010). Is situation awareness all in the mind? Theoretical Issues in Ergonomics Science, 11(1–2), 29–40. https://doi.org/10.1080/14639220903009938
- Stephanidis, C., Salvendy, G., Akoumianakis, D., Arnold, A., Bevan, N., Dardailler, D., Emiliani, P. L., Iakovidis, I., Jenkins, P., Karshmer, A., Korn, P., Marcus, A., Murphy, H., Oppermann, C., Stary, C., Tamura, H., Tscheligi, M., Ueda, H., Weber, G., & Ziegler, J. (1999). Toward an information society for all: HCI challenges and R&D recommendations. International Journal of Human-Computer Interaction, 11(1), 1–28. https://doi.org/10.1207/s15327590ijhc1101_1
- Tan, H., Sun, J., Wenjia, W., & Zhu, C. (2021). User experience & usability of driving: A bibliometric analysis of 2000–2019. International Journal of Human–Computer Interaction, 37(4), 297–307. https://doi.org/10.1080/10447318.2020.1860516
- Vansteenkiste, P., Cardon, G., Philippaerts, R., & Lenoir, M. (2015). Measuring dwell time percentage from head-mounted eye-tracking data–comparison of a frame-by-frame and a fixation-by-fixation analysis. Ergonomics, 58(5), 712–721. https://doi.org/10.1080/00140139.2014.990524
- Vlakveld, W., van Nes, N., de Bruin, J., Vissers, L., & van der Kroft, M. (2018). Situation awareness increases when drivers have more time to take over the wheel in a Level 3 automated car: A simulator study. Transportation Research Part F: Traffic Psychology and Behaviour, 58, 917–929. https://doi.org/10.1016/j.trf.2018.07.025
- Vogelpohl, T., Gehlmann, F., & Vollrath, M. (2020). Task interruption and control recovery strategies after take-over requests emphasize need for measures of situation awareness. Human Factors, 62(7), 1190–1211. https://doi.org/10.1177/0018720819866976
- Walker, F., Wang, J., Martens, M. H., & Verwey, W. B. (2019). Gaze behaviour and electrodermal activity: Objective measures of drivers’ trust in automated vehicles. Transportation Research Part F: Traffic Psychology and Behaviour, 64, 401–412. https://doi.org/10.1016/j.trf.2019.05.021
- Wandtner, B., Schömig, N., & Schmidt, G. (2018). Secondary task engagement and disengagement in the context of highly automated driving. Transportation Research Part F: Traffic Psychology and Behaviour, 58, 253–263. https://doi.org/10.1016/j.trf.2018.06.001
- Weigl, K., Schartmüller, C., Riener, A., & Steinhauser, M. (2021). Development of the Questionnaire on the Acceptance of Automated Driving (QAAD): Data-driven models for Level 3 and Level 5 automated driving. Transportation Research Part F: Traffic Psychology and Behaviour, 83, 42–59. https://doi.org/10.1016/j.trf.2021.09.011
- Wintersberger, P., Schartmüller, C., Sadeghian, S., Frison, A. K., & Riener, A. (2021). Evaluation of imminent take-over requests with real automation on a test track. Human Factors, 65(8), 1776–1792. https://doi.org/10.1177/00187208211051435
- Wu, Z., Zhao, L., Liu, G., Chai, J., Huang, J., & Ai, X. (2023). The effect of AR-HUD takeover assistance types on driver situation awareness in highly automated driving: A 360-degree panorama experiment. International Journal of Human–Computer Interaction, 1–18. https://doi.org/10.1080/10447318.2023.2254645
- Xu, W., Dainoff, M. J., Ge, L., & Gao, Z. (2023). Transitioning to human interaction with AI systems: New challenges and opportunities for HCI professionals to enable human-centered AI. International Journal of Human–Computer Interaction, 39(3), 494–518. https://doi.org/10.1080/10447318.2022.2041900
- Zeeb, K., Buchner, A., & Schrauf, M. (2015). What determines the take-over time? An integrated model approach of driver take-over after automated driving. Accident; Analysis and Prevention, 78, 212–221. https://doi.org/10.1016/j.aap.2015.02.023
- Zhang, T., Yang, J., Liang, N., Pitts, B. J., Prakah-Asante, K., Curry, R., Duerstock, B., Wachs, J. P., & Yu, D. (2023). Physiological measurements of situation awareness: A systematic review. Human Factors, 65(5), 737–758. https://doi.org/10.1177/0018720820969071
- Zhu, Y., Tang, G., Liu, W., & Qi, R. (2022). How post 90’s gesture interact with automobile skylight. International Journal of Human–Computer Interaction, 38(5), 395–405. https://doi.org/10.1080/10447318.2021.1948687