
Abstract
Advances in mobile consumer technology, especially in smartphones, have given rise to numerous new crowdsourcing opportunities. With the miniaturization of sensors and the growing number of smartphone models containing a wide range of them, we are now capable of creating digital imitations of real-world objects using everyday mobile devices. In this study, we created four augmented reality (AR) applications utilizing LiDAR sensors that were designed for crowdsourcing the creation of such digital imitations, i.e., digital twins. A user study was undertaken where video recordings, audio recordings, point cloud, and mesh data were collected in forest settings. Each approach was evaluated in terms of the characteristics and quality of the crowdsourced data acquired, as well as the participants’ behavior and experience. Our findings demonstrate that through gamification approaches, we can influence not only the user experience but also the type and quality of the crowdsourced data. Our findings offer guidance on which gamification dynamics and interactions are best suited for several types of crowdsourcing tasks. We also show that the collection of meaningful data is not limited to specific interactions or experiences and suggest that there are multiple routes in gamification design for reaching the desired outcomes.
1. Introduction
In the modern, globalized, digital world, almost everyone carries a mobile device with them as they move around. For example, in the UK, only 2% of individuals report that they do not own a mobile device, while 27% own two devices or more (Statista, Citation2022). Each year, the newest mobile phones being released are equipped with increasingly more processing power and memory, as well as higher-quality sensors. At the same time, faster mobile data networks with larger bandwidths, such as 5G, are being built around the world. This enables better connectivity and larger, and cheaper, data transmission capabilities. These developments offer new possibilities for spatial crowdsourcing, a phenomenon where members of the public use their mobile devices to map the real world, documenting objects within it (Heipke, Citation2010; Zhao & Han, Citation2016). In addition to building map services, such as OpenStreetMaps (OSM) (Chilton, Citation2009), spatial crowdsourcing has been utilized, for example, in the detection of free parking spots (Morschheuser et al., Citation2019), in the discovery of playful points of interest (PoIs) (Laato et al., Citation2019), in recording textured models of cultural heritage site objects (Ch’ng et al., Citation2019) and in understanding land cover in higher detail than is possible from satellite images (Fritz et al., Citation2009).
One of the more recent advances in spatial crowdsourcing, which has also been adopted by industry leaders in location-based applications like Niantic, is the characterization of physical objects using point clouds. In addition to the camera sensor, LiDAR can be used to support obtaining the exact physical shape of objects (Çakir et al., Citation2021; Luetzenburg et al., Citation2021; Tatsumi et al., Citation2022). In essence, this leads to the creation of digital replicas of real-world objects, which can be coupled with location information and metadata. Past academic research (e.g., Tatsumi et al., Citation2022) has involved producing consumer applications where it is possible to take part in the collection of three-dimensional (3D) point clouds on trees, forests, and other real-world objects. Previously, professionals had to go onsite with expert equipment to perform mapping activities, but with cameras and LiDAR-equipped smart devices, the general population now has the potential to perform the same activities. However, research on digital twins that specifically discuss forests or nature is currently lacking in HCI research (Liu et al., Citation2023). Certain unique characteristics and features of forests and nature require special consideration when creating a digital twin. Unlike built environments, factors, such as seasonality, growth, and diverse irregular forms must be taken into account. However, because digital twins have the potential to offer significant benefits for nature conservation, forestry, tourism, science, education, etc., more research must be conducted in this area.
LiDAR sensors are not yet widely available on mobile devices. However, the technology is being included in consumer mobile devices not just for augmented reality applications and mapping, but also for photography, video capture, and facial recognition. Apple has included rear-facing LiDAR capability in its professional line of mobile phones since the iPhone 12 Pro, as well as in its professional line of iPads since 2020 (Whitney, Citation2024). The quality of the point cloud may improve if the LiDAR sensor is getting better, but also when LiDAR and cameras are used together more optimally.
While advancements in the sensors embedded in personal mobile devices promise a big leap in the quality of the data produced through spatial crowdsourcing, there is a lack of prior research that demonstrates how people can be motivated to take part in crowdsourcing this kind of data collection. The main challenges here are understanding how to motivate people to participate and designing motivational mechanisms that produce data with the desired quality. The set of actions that would result in high-quality scanning is demanding for users, and solutions for facilitating this process are lacking. We propose that gamification has the potential to offer a cost-effective and scalable solution to both of these issues, as there is no need to pay users for their participation, and game activities can be designed and employed to direct data collection (Laato et al., Citation2019; Laato & Tregel, Citation2023; Morschheuser et al., Citation2017, Citation2019). Employing a gamification approach may prove beneficial in recruiting, expanding, and retaining a user base for volunteered geographic information, considering that the willingness of participants to engage in desired tasks is a limitation in crowdsourcing strategies (Gómez-Barrón et al., Citation2019). Also, previous research shows that gamification has been an effective method for motivating people to traverse locations where they would not normally go if it were not for the game’s activities (Baer et al., Citation2022; Schneider & Jadczaková, Citation2016). Another research gap is related to our lack of understanding of how various gamification designs in crowdsourcing impact the resulting data that we obtain. While we have evidence of crowdsourcing being used in various situations, these studies (e.g., Laato & Tregel, Citation2023; Morschheuser et al., Citation2019) have not empirically compared two or more gamification solutions with each other from the perspective of the type and quality of data they produce. By addressing these two research gaps through the same experimental setup, we are also able to explore how to design a user experience (UX) that would be enjoyable while still producing usable information from the crowdsourcing tasks. Accordingly, to investigate these issues we propose the following two research questions (RQs) for this study:
RQ1: How do different gamified solutions affect the user experience in an augmented reality-led collection of point clouds?
RQ2: What are the defining characteristics of the resulting point cloud data across the different gamified solutions?
To address these RQs, we first designed and implemented three gamified solutions for AR point cloud collection and a fourth control scenario with no gamification involved. We then conducted a user study (N = 16) where we asked participants to use all four AR point cloud collection applications but did not explicitly explain that the applications would be capturing point cloud data so that the focus would be on the AR experience. The findings demonstrate that we can collect meaningful data with multiple different interactions and that users can scan areas unknown to them, with specific interactions enabling different behaviors.
2. Background and related work
2.1. Point cloud data and close-range sensing
A point cloud is a set of points in space representing the 3D structure of an object or environment. Each point in a point cloud is assigned 3D coordinates (x, y, z) to define its position in space and is accompanied by attributes to characterize the object attributes, such as spectral information or point classification. Generating a point cloud involves 3D measurements from the object of interest to characterize its 3D structure. The two prevalent techniques for this task are LiDAR and photogrammetry (Baltsavias, Citation1999; Leberl et al., Citation2010; Wehr & Lohr, Citation1999). LiDAR is an active remote sensing method where laser beams are emitted and received back after reflecting from the surface of an object. The distance between the scanner and the reflecting object surface is measured and its position in space is defined with 3D coordinates (Lefsky et al., Citation1999, Citation2002; Wehr & Lohr, Citation1999). The distance measurements are calculated from the velocity of light waves in a given medium and the time delay that occurs between the emitted and received laser signal (Bachman, Citation1979).
The measurement of forests using satellite-based remote sensing falls short of adequately capturing all wood biomass in a landscape (Liu et al., Citation2023). Therefore, close-range sensing methods can be valuable in filling this gap. Indeed, in a forest environment, close-range sensing methods are most often used for the detailed characterization of trees and tree communities through point clouds (Iglhaut et al., Citation2019; Morsdorf et al., Citation2018). Close-range sensing refers to an approach of acquiring information from trees and tree communities remotely within a distance ranging from ∼1 to 100 m. Sensors employing either laser scanning technology or photogrammetric approaches are attached to static or kinematic, terrestrial, or aerial platforms thus enabling the sensor-platform system to acquire point clouds to characterize trees and tree communities from different viewpoints.
2.2. Crowdsourcing data from the participants’ physical environment
The crowdsourcing of real-world data has been discussed in a variety of contexts, including, but not limited to, location-based crowdsourcing (Alt et al., Citation2010) and spatial crowdsourcing (Zhao & Han, Citation2016). Some studies also explicitly talk about the crowdsourcing of geospatial data (Heipke, Citation2010). Despite the differences in the chosen terminology, all these streams of research have studied techniques for harnessing individuals without specialized expertise to collect data from the physical world, typically through their own personal mobile devices. In most cases, the crowdsourcing participant installs an application on their device, which then offers tools for collecting data through the device’s sensors (most often camera) (Liang et al., Citation2022). However, it is also possible to utilize a wide range of other sensors, such as a microphone or Global Navigation Satellite System (GNSS) data.
A novel advancement in the readily available methods of scanning objects in the environment in greater detail is LiDAR sensors (Çakir et al., Citation2021). For example, contemporary Apple devices using the LiDAR functionality have already been shown to be usable for, collecting data for forest measurement purposes (Gollob et al., Citation2021; Tatsumi et al., Citation2022). LiDAR sensors can also be used in combination with other sensors, such as the mobile device’s camera.
A popular approach making use of the crowdsourcing participants’ camera data is mass photogrammetry (Granshaw, Citation2015), where collections of photos from a location are used to reconstruct the 3D space digitally. This approach can be used for spatial crowdsourcing purposes (e.g., to capture cultural heritage objects) (Ch’ng et al., Citation2019). Similarly, LiDAR data can be used to reconstruct point clouds of objects or terrain in the physical world.
2.3. AR applications and location-based games
Location-based games that utilize AR are attractive to players for a variety of reasons; they present a fun challenge, they encourage outdoor activity, and they provide a novel way to explore new places (Hamari et al., Citation2019). Games like Pokémon GO and Ingress Prime, which have utilized and integrated AR capabilities in a variety of imaginative ways, have been hugely popular and have motivated players of all ages to explore their local areas and be playfully active (Alha et al., Citation2019; Xu et al., Citation2023). There has been much experimentation in using AR in location-based games including within the global scavenger hunt-type game, Geocaching. Here, the use of AR has varied between applications that guide players through the landscape safely (Luna, Citation2017), turn players into social sensors while they search for virtual caches (Tursi et al., Citation2014) to games that use other applications, such as “Metaverse” to solve the puzzles in AR to determine the final coordinates of the hidden physical caches (Konig, Citation2016).
There are, however, certain limitations when using AR in location-based games as they rely on mobile devices that can only utilize camera imaging and motion sensing. This results in restricted functionality as there are limits to the achievable accuracy of 3D scene recognition which relies on two-dimensional images as input. These factors also affect the kind of data that can be collected, as accurate data is not available in the first place so it cannot be stored. When examining the observed affordances in popular AR applications listed on the analytics service Statista (Citation2023), most of the games, such as Dragonquest Walk and Pikmin Bloom offer digital content on top of a map interface but do not provide higher fidelity AR interactions. In contrast, Pokémon GO, much like Minecraft Earth and Walking Dear: Our World, has an AR mode that works by detecting real-world plane surfaces with the camera and placing digital content on these surfaces (Laato et al., Citation2021). Players can interact with the AR content by tapping and swiping their smartphone screen, but it has been demonstrated that ultimately, AR features remain as gimmicks in most locative AR games as opposed to being a central part of the playing experience (Alha et al., Citation2023). There are also developments in the field of wearables (Lindberg et al., Citation2016) that might be relevant for AR gaming, such as the Pokémon GO+, Gotcha, and PokéBall + devices which enable players to play Pokémon GO without having to look at the smartphone screen. With the introduction of new technologies to the market, such as Apple’s Vision Pro headset (AppleInc., Citation2023), there will likely be further innovations within the field of AR gaming affordances (Laato et al., Citation2024). However, the use of AR in popular games currently remains in its infancy (Alha et al., Citation2023).
Technological limitations can curb how experiences are designed as it can be difficult to interact with scene geometry realistically. Shapes can often be hard to detect reliably so this leads to interactions that largely utilize detected planes. Indeed, AR interaction in mobile applications is often limited to interacting with an object that could be in any location. Therefore, the interaction would be experienced as being equal no matter where the content is experienced [e.g., in the game Siege Breakers (Halfbrick, Citation2017) or AR Sports Basketball (Triangle Factory, Citation2017)].
These issues can also diminish the user experience of AR functionalities, and academic studies report low (<10%) adoption rates for AR features in popular location-based games (Laato et al., Citation2021). Furthermore, so far, we have seen little success among AR games. For example, Minecraft: Earth, a high-profile AR publication for mobile platforms, was recently shut down (Minecraft Earth Staff, Citation2021). While AR is yet to see mainstream success (outside perhaps Pokémon GO), new technological developments, such as Microsoft’s Holo Lens and Apple’s Vision Pro, and also better mobile devices, give reason to investigate the technology and also innovate new use purposes for it.
3. Research design
3.1. Scenario designs
To answer our research questions, we implemented four AR scenarios that provided different experiences, but in a way where each of the experiences would be able to capture 3D data using the LiDAR capability of an Apple Smart device. The first implementation is a non-interactive experience where nothing is shown to be happening on the screen except for the camera viewfinder being displayed. The other three implementations are interactive experiences with playful and interactive elements, ranging from simply visualizing the captured points, to artistic play and score-based play. Instead of plane detection, the interactive experiences utilize the 3D polygonal mesh which is captured in real-time by the device. Multiple surfaces are therefore usable for these AR implementations resulting in rich, engaging experiences. The design of the playful experiences relied on prototyping practices common in game development (Schell, Citation2014) due to the novelty of the experiences and their intended purpose. Effort was also made to ensure that aspects of realism were incorporated into the designs so that they would not feel too disconnected from the experiment locations.
It is worth noting that in this approach, there is a lack of multimodal reward systems that are connected to the broader game ecosystems, such as those seen in games by companies, such as Niantic. Previous research on crowdsourcing contributions has demonstrated that the surrounding ecosystem, and social dynamics within it, are critical in understanding participants’ overall motivation to contribute (Laato & Tregel, Citation2023; Morschheuser et al., Citation2019). This experiment focused on the scenarios in isolation, but it is maintained that connecting activities to external reward systems, as exemplified by Niantic, could make them more enjoyable.
3.1.1. Design 1: Nothing
The idea of this scenario is to simply activate the user’s camera and ask them to point the camera around an object or area for a specified amount of time. One of the current industry leaders of gamified crowdsourcing of real-world data, Niantic, has chosen to adopt this design so that they ask players to walk around a specified object while pointing their device’s camera at it in applications, such as Pokémon GO and Ingress Prime. As a reward for doing this, players either obtain a “scout controller” recognition in Ingress Prime, or a field research task completion and eventual PokéStop power-up in Pokémon GO. While the activities are thus rewarded, the activity itself contains no gameful interaction. We specifically use the activity as a basis for this scenario and do not include any reward mechanisms. The goal of this design is to use it as a baseline control condition for the following two reasons: (1) it is very simple, and (2) it is currently adopted by one of the industry leaders.
3.1.2. Design 2: Spider vacuuming
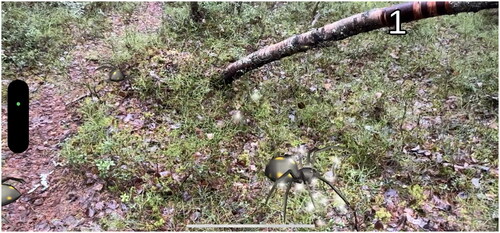
With the second experimental scenario, we applied a gamification approach that directs the user’s attention to locations of interest. The goal of the design is to have on-screen interactive elements that prompt users to move their mobile devices to capture the environment with the device’s sensors. Building on the real-time surface detection capabilities of high-end mobile devices with LiDAR, we created a design where we spawn moving spiders to the real-world environment that the user is in. The user is then tasked to vacuum these spiders. We can control the areas where spiders spawn, and accordingly influence where users direct their mobile device’s camera. Spiders were chosen for this design as they are realistic creatures in the forest that move about on surfaces. Spiders have special characteristics that make them particularly suitable for this task, as they can also walk vertically on surfaces (e.g., walk up trees). Roaming about, seemingly aimlessly, is also a suitable action for an in-game spider, thus providing sufficient need for movement from the user. Their appearance is intentionally unrealistic, rendered as low-detail game objects that are large and bright enough to be clearly visible and identifiable as playful game elements. The vacuuming task was chosen as it was deemed to be non-violent. A screenshot of this application is depicted in .
Figure 1. A screenshot of the spider vacuuming application.
3.1.3. Design 3: Spray painting
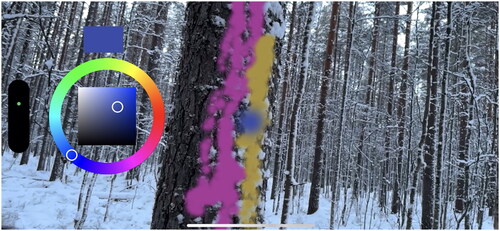
The third experimental condition was inspired by the point cloud visualization in Design 4. Here we wanted to give players more artistic freedom without a certain task, contrary to Design 2. The goal of the design is to motivate users to move their device slowly at a sufficiently close range from a target surface, to capture the environment with the device’s sensors. We introduced a color selection palette and the opportunity to spray and paint objects in the real world. While players are creating virtual urban art, the application is simultaneously scanning the objects and creating a point cloud of them. Just as spiders exist in nature and provide a real-life connection, spray painting is also a realistic outdoor activity that also happens to be a common task in forestry inventory. A screenshot of this application is displayed in .
Figure 2. A screenshot of the spray painting application.
3.1.4. Design 4: Environment scanning
The fourth and final experimental condition is similar to Design 1, but here we display the point clouds that the users create in real-time as they are scanning the environment. This approach is depicted in . The purpose of this scenario was to allow players some visual support for their activity and to scaffold their conceptualization of the activity by displaying the result in real-time as opposed to in retrospect or not at all. The goal of the design was also to be similar to existing point cloud scanning applications, such as ForestScanner (Tatsumi et al., Citation2022). While this scenario is tool-like compared to the previous two playful scenarios and is similar to scanning products available for mobile devices, the creation of a blocky 3D view of the environment can also be seen to have gameful characteristics.
Figure 3. A screenshot of the point cloud visualization application.
3.2. Technical implementation
The experiments were built as a Unity application as separate scenes. In the application, point cloud collection and export features have been implemented in a way that allows for easily implementing various AR experiences on top of those core features. The rationale for choosing Unity for the experiments is that it is easy to create new interactions for data collection. The base-level component that is created is also easily usable in other Unity-based AR applications if there is the desire to add data collection capabilities to such applications. The idea is that the component is very transparent and does not hinder the development of an application. Currently, the technical requirements include the use of a LiDAR-enabled Apple device and the use of ARMeshManager in the application. Capture is still possible without ARMeshManager, excluding mesh output, and the optimization explained shortly.
The main component behind the solution is the point cloud collection feature which uses the depth image provided by the Unity AR Foundation framework on LiDAR-enabled Apple devices by way of ARKit. The depth information is then mapped to Unity screen points with color information when the device is moved or rotated by sampling the depth image and color image. The point cloud collection functionality and the display of points in the environment scanning condition are built by expanding an existing project by Penekli (Citation2020). The appearance of false positive points is reduced by an optimization only allowing the scan of points that are within a 1 cm distance from a mesh of the environment generated using the Unity ARMeshManager. ARMeshManager uses the full features of ARKit to generate the mesh. This solution was implemented deliberately to have as accurate data as possible of big objects, such as trees, as the closeness of the points to edges of real-world objects can be verified against the ARMeshManager mesh. The downside is that meshes are not generated for very small objects, so certain small objects are not scanned if their potentially captured points exist far from the generated mesh. However, as certain limitations exist with the accuracy of the LiDAR sensor used in Apple devices (Luetzenburg et al., Citation2021), a choice needs to be made regarding whether accuracy or the volume of data collected with support for smaller features is more important. The data that is exported after scanning includes (1) the scanned points in the XYZ format with color information and (2) the current mesh held by ARMeshManager.
To maintain focus on interactions and the user experience, and because the proposed solutions are applicable to different setups and future devices that may offer a variety of improvements, we have not evaluated the absolute quality of the collected data. For the same reason, we have not delved deeply into creating the best possible optimization techniques for data collection or post-collection data cleanup procedures that might have been able to yield more usable data in our test setup.
4. User study
4.1. Data collection
A single application containing the four experimental scenarios and additional information screens was created using the Unity real-time development platform. This meant that the user studies could be conducted in the space of 7 min—6 min of intensive scanning and 1 min of information screens. This application was installed on Apple’s iPhone 13 pro and iPhone 14 pro devices. At the beginning of each user study, the participants were brought into a forest area if not already in one (in the case of three participants a tree-filled garden area) and handed one of these devices. They were asked to follow the instructions on the screen of the device while talking about their experiences at the same time. The on-screen instructions were always displayed for 5 s and, for each of the scenarios in order, said: (1) Get ready to look around (2) Scan the environment by moving your device! (3) Catch as many spiders as you can. Vacuum by pressing the screen. (4) Make some art, Spray the environment. These instructions were reinforced with explanations from the researcher conducting the experiment, and they would also answer questions the participants had. The participants were given an explanation about the purpose of the research in general, but they were not told that they would be creating point clouds of the environment while they were playing with each of the AR scenarios. Verbal consent was obtained (recorded as audio) from each of the participants to use recordings and any generated data anonymously in this research. Including a possible walk to the scanning site and the interview after the participants had experienced all of the AR scenarios, the user studies ranged in total from 10 to 25 min per participant. The interview portion after the experience took between 3 and 9 min per participant.
Table 2. Interview guide.
The location used for each user study was not the same for all of the participants and the study did not focus on a certain plot within any of the forests visited. Participants were asked to undertake the study in forests close to where they lived, worked, or near where a field trip was taking place. These areas ranged from woodland surrounding landscaped gardens to commercial forests and recreation areas. The choice not to focus on a specific location was due to the exact details of the location not having a meaningful effect on our analysis and the fact that we did not strongly want to control where users could move during the study. This meant we were able to collect data that was more varied, which, for our analysis, was seen as more important than keeping the location the same. During the time the user studies were conducted, the season changed from autumn to winter which meant some of the user studies were conducted with snow on the ground. So, in addition to the variety of locations, other variables included temperature, time of day, and ground conditions.
In order to evaluate the four applications, depth was favored over breadth, meaning we collected multiple sources of data. Our aim with this approach was to understand the differences between the four scenarios and to answer our two RQs more broadly than just stating statistical differences in outcomes.
Each participant was instructed to play sequentially through all four AR scenarios. The consistent order of the scenarios, from start to finish, was Nothing, Spider vacuuming, Spray painting, and Environment scanning. This order was deliberately chosen to ensure that the participants first experienced the scenario with no interactive features, Nothing before they encountered the more interactive scenarios. Additionally, we chose the Environment scanning scenario to be the last experience, as that experiment shows the user what happens behind the scenes, and we did not want to easily reveal the environmental scanning aspect before they played with the interactive features. While the sequencing of Spider Vacuuming and Spray Painting could have been randomized, our primary objective was to assess the potential of the approaches rather than making direct comparisons. Therefore, randomization was not considered necessary. Furthermore, we also asked participants to “think out loud” by vocalizing their thoughts while playing.
We collected the following data on the research phone: (1) point clouds and mesh data (2) a screen recording (3) a voice recording (see ). After the participants had completed the user study, a short interview about the experience was conducted where participants were asked basic questions about all four AR experiences. They were also asked to indicate which experiences they preferred the most and least. The full interview guide used to support the interview process is given in .
Table 1. Data sources collected for this study.
Altogether 16 participants participated in the research. For recruitment, we used convenience sampling by contacting participants through our professional networks. This allowed us to achieve a relatively even and diverse distribution in terms of age, gender, education level, as well as experience with games, AR applications, and forest recreation. Basic demographic information of the participants is provided in , as well as the environment conditions of the location where they participated in the experiment. The participants were all adults who were either researchers, forest professionals, or regular recreational users of forests. Even though a portion of the participants were researchers, none had information about the study being conducted at the time of taking part in the experiments. One of the researchers, due to his expertise with LiDAR and point clouds, later took part in the analysis of the quantitative data collected for this article.
Table 3. Demographic characteristics of the participants and the environment for their experiment.
4.2. Analyses
Since we collected a wide range of data, including gameplay footage, interviews, and the participant-generated point cloud and mesh data, we had to employ multiple analyses. Namely, we first divided the analysis into two parts: (1) understanding the user experience, where the main data sources were the recorded gameplay footage and post-experiment interviews, and (2) understanding the generated data, where the main data sources were the objective data (mesh + point cloud) generated by the participants during the experiment. Following these two, we then combined our analyses to obtain a more holistic understanding of how the four scenarios were linked to the user experience and further to the generated data. Next, we describe our analyses in more detail.
For answering RQ1: How do different gamified solutions affect the user experience in an augmented reality-led collection of point clouds? we focused on the video recordings, the “think-out-loud” recordings, and the post-experiment interviews. The video recordings were analyzed by examining the interactions and events that took place in each video and the “think-out-loud” recordings were used to fill in details for the video recording analysis. Instead of resorting to popular qualitative data analysis approaches, such as a thematic analysis Braun et al. (Citation2022), we wanted to understand the user experience in relation to the four scenarios. As is typical with inductive analyses, such as this one, the analysis process was non-linear, and we refined our understanding of the user experiences as our understanding of the data evolved. Despite the process being somewhat non-linear, here we present it in a linear fashion for clarity.
First, we familiarized ourselves with the qualitative data collected from the experiments to understand differences within single experiments (i.e., between the four scenarios) as well as differences between the experiments (i.e., between the participants). After the familiarization step, we proceeded to code the data for things related to the user experience. In this process, the “think-out-loud” recordings and the post-experiment interviews were transcribed and thematically analyzed with the support of Atlas.ti’s AI coding feature. Our transcription process utilized Microsoft’s AI transcription tools to produce an initial transcription that was manually refined. Third, the researchers discussed together and refined the descriptions of the user experiences pertaining to the four scenarios, and isolated examples of participants who did not conform to the majority. We extracted quotes from the interviews as well as the experiment recordings and translated them into English when relevant. All the researchers read the descriptions of the user experiences and participated in commenting on them, ensuring that they matched the collected data.
For answering RQ2: What are the defining characteristics of the resulting point cloud data across the different gamified solutions? we focused on the generated point clouds and captured mesh data for all four experiments for all participants.
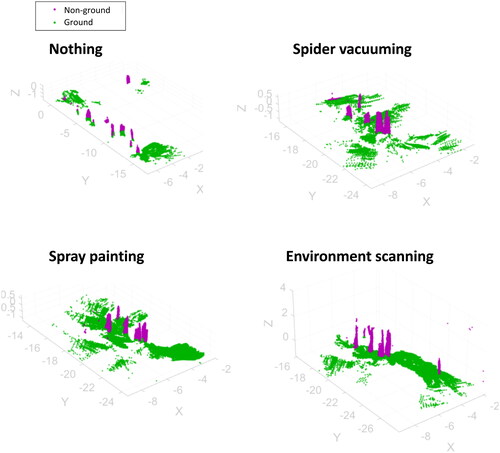
To analyze the characteristics of the acquired point clouds in the different scenarios, we computed a set of features characterizing the capacity of the point cloud to reconstruct its environment. The number of points was used to measure the number of 3D observations made during each 90-s experiment. The points were further classified into points representing ground surface (i.e., ground points) and points representing structures other than ground (i.e., non-ground points) to analyze how the experimental scenarios affected the reconstruction of different objects of interest in the applied environment. This separation is necessary for measuring tree stem volume (non-ground points) as well as, e.g., understory structure and density (ground points). The classification was conducted using the simple morphological filter (SMRF) algorithm (Pingel et al., Citation2013) where a series of morphological opening operations are applied into a regularly spaced minimum elevation grid to estimate ground surface and to separate ground points from non-ground points. Making use of the ground classification, topography was removed from the point clouds by normalizing the Z coordinates with the respective ground elevation information. The height-normalized, ground-segmented point clouds were then used to compute the percentage of non-ground points out of the total number of observed points that aimed to measure how the observations were distributed among the objects of interest. The area covered by the point clouds was estimated as an area of a convex hull enveloping point cloud points that were projected onto the XY plane. Observation density was obtained by dividing the total number of points by the area covered. The Z range was computed as a range between the lowest and highest non-ground points in the point cloud. See for an example.
Figure 4. Ground points and non-ground points of P12.
5. Findings
5.1. Differences in the scenarios in user experiences
5.1.1. Nothing
In the first scenario, participants were asked to view the environment through the mobile device and to describe their experience of doing so. As this scenario didn’t require the participants to perform any task other than using the phone to view the environment, most participants took the opportunity to walk in the forest and enjoy exploring the area. This meant that most participants provided literal descriptions of what they saw and expressed either appreciation or displeasure with details that they noticed. Many related that they found the environment calming or peaceful (P5, P11, P16) while a few expressed sadness or displeasure (P3, P15) in what they saw. When participants had knowledge of some environmental features, they often conveyed that by providing information that would add to their appreciation (P3, P5, P8, P10). Only a few of the participants articulated displeasure or confusion and often this was related to not knowing the purpose of what they were doing. A few commented on the technology they were handling in an effort to understand what was going on with some concluding that they were just taking a video like they would with their own phone—“Not quite sure what I’m looking at here. I’m seeing pretty much a similar image to what I see around me. I think this is just, yeah, just the same as if I would be taking a video of something myself” (P12). One participant (P15) took the opportunity to search out a nicer spot to film/scan than where they started.
5.1.2. Spider vacuuming
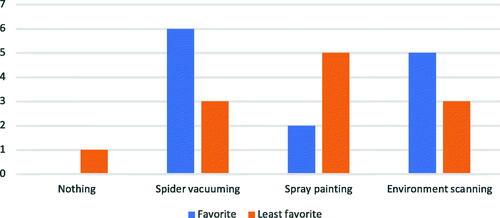
In the second scenario, participants were asked to catch spiders that were appearing in AR on the phone screen as they pointed the phone at trees in the forest. This experience was the first time that many of the participants experienced AR. This meant there was a range of feelings and cognitive responses expressed as they grappled with both the technology as well as the task at hand, from joy, excitement, and surprise, to wariness, fear, and confusion. Even though the most vocalized expressions were those of confusion and frustration, this experience was the most liked of all the scenarios presented to the participants (see ).
Figure 5. Most and least favorite AR scenario.
It takes some time for the spiders to spawn and start appearing on the screen so many were not sure whether to continue walking and some stopped still. When the spiders did appear, many were delighted. However, the most common reactions were confusion and frustration. This appeared to be due to some participants not understanding what they were being asked to do, with many mentioning that they didn’t have time to read the question on the screen before the scenario began, but also there was difficulty with the functioning of the mechanism how to catch or “vacuum up” the spiders. One participant expressed disappointment as for them, “the spiders don’t look too real-like” (P10).
A couple of the participants (P5, P16) found the exercise to be funny and were enjoying the playfulness of the task, while others (P15, P16) found the task of catching the spiders to be a bit scary and one even went as far as to say that they wouldn’t “want to see them suffering” (P16). They then proposed that should the game be “made for nature protection people, probably you would be hoovering the machinery in the forest that is logging down the forest” which illustrated that they were thinking of the possible applications for such a game.
5.1.3. Spray painting
In the third scenario, when participants were asked to be creative and paint on the surfaces in the forest, such as on the trees and the ground, the reactions ranged from curiosity and playfulness with the task to confusion and discomfort as they experimented with what they could do when drawing in three dimensions.
Some participants expressed enjoyment and excitement “Wow, this is fun. I like this part. It’s like playing Holi with trees” (P10), and some participants were reminded of past forestry work “OK. Ha. This is like old times when we, when we planned some harvesting, then we mapped trees quite similarly” (P6) or started to see the possible future forestry applications of this technology “OK, that marking aspect is nice. I like that I can see the applications” (P11). However, many of the participants (P5, P8, P9, P15) were confused by what they were being asked to do. This was likely due to the perceived brief time that the instructions appeared on the screen but also due to the lack of instructions on how to use the painting tool on the screen. A couple of participants went as far as expressing some discomfort in the very concept of what they were being asked to do in the task and gave the following responses:
“For me, I feel like nature is always an art and artistic. So, I don’t need to draw something out there. I can see art in every bit of it. So, it was like a bit like, OK, do I have to?” (P13)
“To me, this is somehow, hmm, disturbing because I feel like I’m destroying the natural environment and making a mess there, and like this doesn’t belong in the forest. It doesn’t belong there. It looks ugly” (P16).
5.1.4. Environment scanning
In the fourth scenario, the participants experienced a pixelation phenomenon on the phone’s screen. As they scanned the surfaces in the forest by holding the phone near the trunks and branches, small pixels were generated, and the resulting image elicited a variety of responses from the participants.
A few expressed amazement and appreciation for what they were seeing happen on the screen, “Wow, it’s lovely. Yeah, I see, like lots of small pixels on the trees… like a Pixie dust. Wow, it looks so cool. Ooh, it’s lighting up like snow. Adorable” (P10), and “it’s like dressing up a tree. In a natural way. This is somehow, it feels more respectful” (P16). Other participants (P8, P12, P14) found the experience confusing and were perplexed although fewer expressed this compared to the previous two scenarios. This confusion was also again related to not knowing what they were being asked to do, “OK, this just looks like I’m taking a video at this point. Not sure what I’m scanning for” (P12) but this confusion dissipated when they started to notice the pixels, “OK, I think I see some dots. Ah. Oh yeah, this is interesting” (P8).
5.1.5. Preference
After the trial with each of the four scenarios, participants were asked to name the scenarios that they liked the most and the least and explain why this was so. The results are depicted in . Generally, the Nothing scenario was not felt strongly about, but the interactive scenarios divided the opinions of the participants with most participants marking Spider vacuuming as their favorite. Spray painting came up the most times as the least favorite scenario but was also picked by some as their favorite.
5.2. Differences in terms of user behavior
5.2.1. Nothing
Perhaps as expected, the participants seemed to move and turn the least in the first scenario where they were just filming the landscape. While some participants (e.g., P4, P15) walked around a little bit, they mostly focused their camera on the distance. Only a few participants (P14) filmed specific objects and only for a short duration.
5.2.2. Spider vacuuming
The locations of the spiders determined where the users pointed the camera, and when the spiders were further away, participants would walk toward the spiders. This was observable in most recordings, such as P1, P2, P3, and P16. Players also seemed to quickly grasp that the spiders were tied to surfaces, and accordingly they also noticeably pointed their camera more toward the ground compared to the baseline Nothing scenario. The spiders could climb trees and other more vertical objects, and sometimes the spiders would prompt the participants to also point the camera toward these objects (e.g., P15 mostly filmed a pine tree filled with spiders).
For some participants, the spider scenario was not self-evident, and we observed that one participant (P5) stood still during this scenario, not realizing they could move. This highlights that there were some UX issues in our design related to the understandability of the system for certain audiences. While in general the spider experiment was well understood, this served as a reminder to focus on proper onboarding to ensure users correctly understand the real-world-related mechanics of AR apps. It is not enough to instruct users to tap the correct buttons on their mobile devices, real-world device positioning and other real-world aspects are also critical.
5.2.3. Spray painting
The most variance in terms of behavior was seen in the spray painting condition, which was designed to offer users expressive freedom. Some participants tried creating AR art in their surroundings, making use of the non-flat surface of trees and other objects in the location (e.g., P2, P3), some (e.g., P1) simply painted some art on the ground. However, a few started walking around tagging trees, showing a different use case for the implemented gamification approach and not what we initially expected. P15 had an interesting artistic approach as they approached a snow-covered pine tree and started painting on top of the white snow with a green color that matched the real cover of that tree.
Some participants took some time to understand this scenario, for example, P4 first started painting the sky and as soon as they realized that the paint did not stick to the sky, they walked next to a tree and started painting on that. For others, this was even a frustrating experience, as P14 did not seem to get paint to stick to almost anything. This highlights also how the scenario forces participants to get within the close range of objects required for obtaining high-quality point clouds through LiDAR, but also shows a limitation of the current implementation, as it is not clear enough for users that they need to be close to the painting target.
There was some empty time spent on selecting colors, where the participants did not focus on what they were filming, but rather, their focus was on the color palette on the screen as they tried to select the optimal color.
5.2.4. Environment scanning
In the scenario where participants could see the point cloud being formed, they were more careful to fill empty spots in the scan. Here participants focused the most on details and placed the device close to the target. For example, P2, P5, and P15 moved their camera so close to the object that they could see individual points being formed and assigned around the object they were targeting. This behavior was almost as if they held a magnifying glass to a plant in nature, observing the details and focusing on it. This demonstrated how the scanner condition could direct participants’ focus to specific details in nature that might otherwise go unnoticed.
In the recording of P4, we can see that the participant is committed to creating a full 3D scan of the object as they can see the point clouds being generated in real-time. Unlike the other scenarios, here the participant focuses on finishing the point cloud model of the object, as the focus is on the object, and not somewhere else. Furthermore, once P4 appears to have filled the “gaps” in the model, they then shift their focus to the next target. Similar behavior could be seen among other participants in this scenario. For example, P14 and P16 scanned an entire tree, reaching out to the top of the tree, aiming to get a full scan with all spots populated with points.
5.2.5. Movement and focus
This experiment showed that through various gamification methods, we can influence participants’ behavior in forests, and even direct things, such as their attention (focus) and movement.
We can distill three simplified dimensions that depict the effects of the players’ movement and focus: movement, focus on detail, and vertical change. shows these dimensions in each scenario.
Table 4. Summarizing a crude estimate of the effects of the four gamification designs on three key categories in terms of point cloud generation: movement, focus on detail, and vertical change.
5.3. Differences in the scenarios in terms of data characteristics and quality
In this section, the characteristics and quality of the collected data are presented. It is necessary to note here that we report the data as it was collected and cannot evaluate the success of the participants in their given tasks based on this data. This is due to the task of the participants being considered something else other than data collection, except for the task “Environment scanning.” The gamification designs can themselves be evaluated in terms of their data collection potential based on the data collected.
5.3.1. Point volume and verticality
All scenarios that contained interactive elements motivated the users to acquire more observations from the environment. The number of points in the generated point clouds increased by 350% for the Spider vacuuming scenario, 1240% for the Spray painting scenario, and 2030% for the Environment scanning scenario.
The Spray painting and Environment scanning scenarios elicited the highest number of points acquired in total while also motivating the user to acquire significantly more points from non-ground objects when compared to the Spider vacuuming and Nothing scenarios.
The Spider vacuuming scenario guided the user to acquire a significantly higher proportion of ground points (64.8% of all the acquired points on average) when compared to that acquired with the other scenarios (26.1–39.6%).
5.3.2. Area and density
There were no statistically significant (p < 0.05) differences in the projection areas covered by the point clouds between the interactive scenarios, although some of the highest coverage areas of 395 and 573 m2 were recorded in the nothing scenario with just 6008 and 3824 points, respectively, leading to rather low point cloud densities.
Regarding observation density, the Environment scanning scenario featured the most points recorded on the covered projection area on the XY plane (7279 pts/m2 on average) followed by the Spray painting scenario (4692 pts/m2) while the Spider vacuuming scenario (1122 pts/m2) remained at the same level as the Nothing scenario (1637 pts/m2).
The Environment scanning scenario seemed to motivate the user to extend the point cloud vertically more than the other interactive scenarios, featuring an average Z range of 2.85 m above the ground, while the respective average range for the other interactive scenarios was 1.95 m.
5.3.3. Mesh generation
The mesh generation extended the point cloud data coverage mainly horizontally but also vertically. Compared to the point clouds, the acquired meshes featured a generally larger area of coverage with an average of 141 m2 for meshes and 68 m2 for point clouds. They also featured a relatively higher proportion of observations from the ground (87.1 vs. 41.4%) while also capturing more non-ground structures in the vertical direction (3.0 vs. 2.2 m). The differences were statistically significant (p < 0.05) regardless of which interactive scenario was applied.
5.3.4. Point cloud metrics
See for a box plot of the variation in the point cloud-derived metrics by the applied scenario. compares the scenarios based on specific point cloud metrics.
Figure 6. A Boxplot showing the variation in the point cloud-derived metrics by the applied gamified scenario. On each box, the red vertical line indicates the median and the bottom and top edges of the box indicate the 25th and 75th percentiles, respectively. The whiskers extend to the most extreme data points not considered outliers, and the outliers are plotted individually using the “+” marker symbol.
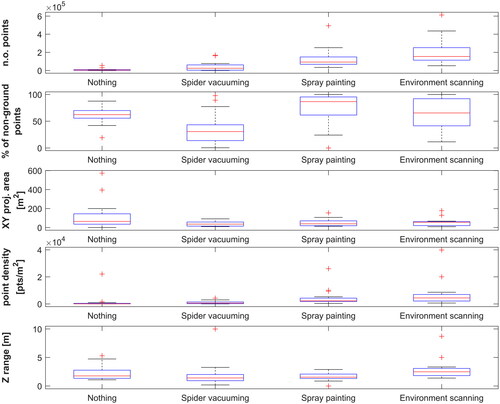
Table 5. The p-values of paired-sample t-tests quantifying statistical differences in the point cloud metrics between gamified scenarios. Bolded values imply statistical significance in the observed difference at 95% confidence (i.e., p < 0.05).
6. Discussion
Based on our experiment, it seems that by applying different game mechanics or playful interactive features, it is possible to guide or direct users to collect observations from the objects or areas of interest. In our experiment, in the Spider vacuuming scenario, the spiders were mainly moving on the ground, and this led to a higher proportion of points representing the ground surface. In the Spray painting and Environment scanning scenarios, participants mainly interacted with the objects that were easy to interact with while standing or walking, which appeared as a higher proportion of points representing non-ground structures. In a forest environment, large trees and rocks are these kinds of objects, and according to the results obtained in this study, the interactions used in spray painting and environment scanning supported the acquisition of point cloud data characterizing these objects.
In all of the interactive scenarios, on average the vertical range in the point cloud that participants acquired was around 2 m indicating the potential to collect information, especially from the lower parts of the tree stems, understory, and topography.
Considering that each gaming scenario lasted only 90 s, all of the obtained results should be interpreted with caution, especially the results related to the area covered by the collected point clouds (XY projection area). However, it seems that in a rather short time, it could be possible to collect point clouds from the ground and lower parts of the trees from areas typically used in forest surveys.
Many forest surveys are based on sample plot measurements and the area of one sample plot usually varies from 100 to 1000 m2. In their studies, Mokroš et al. (Citation2021) successfully used 625 m2 subplots and Tatsumi et al. (Citation2022) used 400 m2 subplots of a larger area, so even decently sized sample plots are observable using mobile devices. However, it may be beneficial to combine data from several sessions where even a rather small area is observed when attempting to acquire high-density data. This also mitigates potential limitations with hardware or game design, such as lack of memory and processing capability on the device, or game interactions that do not have activities that sufficiently cover a large enough area in one session.
Based on our results, the correct scanning approach for a certain task may be determined. In other words, we can see which approach is best suited to scanning areas where the focus of interest is collecting ground points with low-density capture requirements, or areas where the focus of interest is collecting above-ground points, such as trees, that have high-density capture requirements (see ).
Table 6. Suitable interactions for specific goals.
6.1. Key findings
Out of the four scenarios, predictably, the worst in terms of data quality (precision + breadth) was the Nothing scenario. Additionally, all of the interactive experiences were preferred by at least two participants, while no one preferred the Nothing scenario.
Regarding RQ1, there were a lot of individual differences in how users perceived the four scenarios, and how they utilized the provided game mechanics in the interactive scenarios. The Nothing scenario, acting as a baseline with no interactive elements, resulted in users “filming” the area from afar. The experience did not evoke strong feelings or motivate the users to move much. The experience was considered similar to taking a video of the scenery. The Spider vacuuming scenario, designed to prompt users to move their device when following interactive elements, influenced movement and was a playful activity. However, it also resulted in a range of feelings among the participants, and it was not always clear to all of them how they should play the activity. Nevertheless, it was the experience that was picked as the favorite by the largest number of participants, indicating that the experience has properties that positively affect point cloud collection. The Spray painting scenario, designed to motivate users to move their device slowly at a sufficiently close range from surfaces, resulted in various behaviors due to the freedom and artistic affordances that the painting mechanic provided. This experience was the least favorite for the largest number of participants, but also the favorite for some. It was seen as rather realistic, bringing up feelings of not wanting to disturb nature, but it was also reminiscent of real-life professional tree-marking activities. The activity therefore successfully blended the augmented content with real life. Finally, in Environment scanning, with a design similar to other point cloud scanning applications, the activity was not immediately obvious to all participants, but the effects on the screen were seen as interesting and novel for many. Even though the experience was similar to how dedicated scanning applications operate, for those not familiar with these applications, it may be considered further from reality compared to the others. This demonstrates that augmented reality solutions for point cloud scanning do not need to be fully grounded in reality.
For RQ2, it can be said that the characteristics for each scenario do differ, but all provide usable data. The Nothing scenario provides a less detailed overview of the scene without requiring much user interaction, especially as a mesh. This type of data could be used, for example, for positioning by comparing the scan to a previously collected scan of the area. The Spider vacuuming scenario made the users move and scan ground points. The Spray painting scenario can provide a very varied result, as it is a more free-form activity as seen by the variance in the approaches the users took to the activity and the results that followed. Environment scanning can provide highly accurate data at a slow pace. Here the users were able to see the scanned dots on the screen, making it possible to add detail where needed. Spray painting and Environment scanning produced more non-ground points compared to Spider vacuuming, a result which is clearly due to the spiders mostly crawling on the ground but could also be a result of it being more comfortable to scan or draw on the height where the phone is held.
Since successful capture relies on movement, it is essential to motivate users to be more active during the experiences. While the spider experiment does encourage movement, it may not immediately appear to players that movement is the best strategy for being successful in this task. Using the device for spray painting does require movement, so it is important to note that creating art at a single location only truly captures that specific area well. When scanning the environment to create a point cloud, with only dots representing the points displayed on the screen, it may not be immediately evident that movement yields more data than remaining stationary.
The Environment scanning experience can be viewed as a reference implementation where the user’s primary task is to scan the environment with a visual tool. The experience can be described as tool-like but can also be seen as a novel experience, particularly for users who have not encountered AR applications before. This scenario was favored by some participants but not all. Our results show that the Environment scanning experience performed generally very well, but was not the best in all cases, and even when it was the best, the results from the other experiences that were designed to be more directly gameful and playful also provided good results. This demonstrates that a variety of experiences can be used to offer users novel and fresh interactions. This remains true even in situations where users might lose interest in a single experience, particularly when user interest hinges solely on the novelty factor of the experience. This means that data collection does not need to rely on one experience or a specific novelty factor. Furthermore, the divergence of opinions on favorite and least favorite experiences highlights the importance of offering a range of scanning experiences.
6.2. Limitations
We have identified five main limitations of the work: (1) real-world voluntary usage with currently popular devices, (2) the experimental condition length, order, and separation of interactions, (3) clarity of instructions, (4) experiment environment, (5) convenience sampling of participants.
Real-world application of this system is limited due to the inclusion of LiDAR capabilities being limited to only a few high-end devices. These devices are currently not accessible to the large majority of the global population, but this is suspected to change as mobile technologies advance and become cheaper for consumers.
The order of the scenarios was the same for each user, so there might have been order effects in the data. The previous scenarios may have affected the result of the next. The effect of this is mitigated by the users having a different task in each scenario and with them not being told that they are scanning the environment before the final scenario, but an effect is still possible. Also, the time for each task was only 90 s, so there was not a lot of time to collect data or to get to grips with each scenario. In the real world, users would be offered, e.g., a tutorial, and they would be able to have multiple, potentially longer, play sessions. In such a real-world setting, it is also possible that multiple interactions would be combined into one experience instead of engaging with the interactions separately. This would likely result in more data being gathered cumulatively, but the presence of various interactions might limit engagement in some of those interactions.
The clarity of the on-screen instructions, and the limited time that they were displayed for, is also identified as a limitation but this was mitigated by clarifications and the repeating of the instructions given by the researcher overseeing the experiment. Also, the capability of the test subjects to read instructions was not a target of research.
It is possible that the conditions in which some of the studies were conducted may have had some effect on the results. For instance, the underfoot conditions in the forest in the fall included muddy areas and during winter there were snow depths of up to 9 inches in places. These conditions may have affected how people moved, and the decisions that they made to follow the on-screen instructions, due to safety concerns. Moreover, because several of the study participants were forest researchers, as many as five of the study recruits had an idea that scanning was taking place and, in some cases, imagined what potential real-world use cases might be and behaved accordingly. However, as this was an exploratory study, the fact that prior professional knowledge may have influenced behavior is not seen as a concern as this also widened the range of behaviors and presented a broader set of results to be considered during the analysis and discussion.
Convenience sampling may also lead to biased outcomes. However, the explorative nature of this research did not rely on an unbiased result, as the main goal was to explore the possibilities of the approach. Any additional information generated is viewed as valid data that can be used for exploring the possibilities of our approach, as we did not set out to prove the exact quality of our scenarios but to find interesting properties present within them.
6.3. Implications
The large-scale implications of this work may only be realized further down the line, but it can be seen that many stakeholders can gain many benefits in the future. Specifically, forest professionals, forest owners, and recreational forest visitors may all benefit from the work.
By crowdsourcing forest data collection, forest professionals can access up-to-date information more frequently while minimizing the need for more targeted data collection efforts. This approach can be particularly useful for tracking changes and identifying areas where more focused data collection may be necessary. Additionally, forest professionals may also use gamified solutions themselves during their forestry work site visits. Forest owners can also benefit from new, interesting, and playful methods of collecting data on their own forests and leveraging the data collected by others. Recreational users can enjoy new and engaging ways of interacting with forests while contributing to data collection efforts.
Additionally, this work can benefit designers and developers of augmented reality applications and applications developed for data collection. This is because we have demonstrated how data collection can be integrated into a range of augmented reality applications and we have also shown that gamification can be effective in facilitating data collection.
7. Conclusions and future work
In this study, we created four augmented reality scenarios for mobile devices that could be used to crowdsource environmental observations using the LiDAR sensors present on Apple iPhone Pro devices. Two of the scenarios included specific gamified elements (painting and spider vacuuming), one had the appearance of a real-time point cloud scanning tool, and one had no augmented content drawn on the screen. We capture screen recordings, audio recordings, point cloud, and mesh data for analysis from 16 participants. Each of the scenarios was evaluated in terms of user experience, the behavior of the users, and the characteristics and quality of the crowdsourced LiDAR data.
Based on our experiment and the analysis of the results, gamified AR applications can be used for the collection of 3D spatial data, such as point cloud data from nature, showing that such applications can be deployed for crowdsourcing purposes. The design of the AR applications will affect the kind of data that will be collected, as well as the experience of the user. Spider vacuuming, designed to prompt users to move their device when following interactive elements, resulted in the most movement. Environment scanning, a design similar to other point cloud scanning applications, resulted in the most focus on detail and most vertical change. Spray painting, designed to motivate users to move their device slowly at a sufficiently close range from surfaces, had a varied mix of movement, with focus on detail and vertical change. The Nothing scenario, acting as a baseline with no interactive elements, was low an all three. The Nothing scenario also resulted in the acquisition of the lowest number of points. Spray painting and Environment scanning resulted in acquiring the most points, also with a higher proportion of non-ground points compared to the other scenarios. Spider vacuuming produced the most ground points proportionally. The selection of the favorite and least favorite experiences was otherwise diverse, but the non-interactive Nothing scenario was not picked as anyone’s favorite. However, the data from all of the scenarios was deemed to be useful for some purpose, even if the type of data collected was different. We conclude that data collection can be used with any AR application on a LiDAR-capable smart device to collect data, but the design of the experience will affect the data that will be collected.
This work sets up many interesting research avenues such as: (1) investigating specific interactions or queues to nudge users to scan specific data, (2) use for a specific purpose, such as forest surveys, (3) using gamified AR solutions for scanning indoor locations for digital twins of buildings, (4) evaluating larger scale applications that combine multiple interactions and which are built to support longer engagement, (5) gamifying professional devices.
Much of the proposed future work will also rely on accurately georeferencing the data. Due to the possibility of using a combination of the GNSS of the device as well as the detected objects, the spatial accuracy of the collected data can be highly accurate. It is also possible to envision alternative approaches to crowdsourcing, such as to gamify the devices’ professional use. In this scenario, gamified interaction does not necessarily need to intensely focus on playfulness, but it can still make many tasks more engaging through suitably designed visual or auditory cues. In this future scenario, the sensors used to collect the data (LiDAR, GNSS, and so on) may be a lot more expensive and a bit bulkier. For example, the Artec Leo (Artec, Citation2024) is a portable LiDAR device with an integrated display and gamified features could be implemented into such a device.
Gamified crowdsourcing shows promise as a scalable approach in close-range sensing, and through our findings, we support endeavors for large-scale scanning globally. Our work can be seen as complementing existing approaches, such as satellite scanning, offering more detailed data acquisition of the world around us, and contributing to the creation of a digital twin of the earth. This work also has value beyond crowdsourcing implementations in the realm of professional data collection, as gamification strategies could also be applied to suitable professional devices.
Ethical approval
This research has been conducted in accordance with the general guidelines set forth by the Finnish National Board on Research Integrity (TENK). According to these guidelines, specific committee approval is not required for this research. Additionally, according to the guidelines, documented verbal consent is sufficient for this research and the consent of each participant was recorded as audio.
Disclosure statement
No potential conflict of interest was reported by the author(s).
Additional information
Funding
Notes on contributors
Timo Nummenmaa
Timo Nummenmaa is a Senior Research Fellow at the Faculty of Information Technology and Communication Sciences at Tampere University. He received his PhD in Computer Science in 2013. Nummenmaa is a versatile researcher who concentrates on such topics as gamification, augmented reality, hybrid experiences, game development, and playful interactions.
Samuli Laato
Samuli Laato works as a Postdoctoral Researcher at Tampere University, Finland. He is the world’s most published researcher on location-based games, and he has conducted a wide variety of inter-disciplinary research on the topic. His current research relates to the potential of location-based gaming for enhancing people’s nature connections.
Philip Chambers
Philip Chambers is a doctoral researcher at the University of Eastern Finland’s School of Forest Sciences and a member of the Gamification Group at Tampere University. Philip focuses on the intersection of gamification and forestry, where games and playful technologies can support data collection and participatory processes in forest planning.
Tuomas Yrttimaa
Tuomas Yrttimaa is a postdoctoral researcher at School of Forest Sciences, University of Eastern Finland. Background in utilizing close-range sensing techniques, such as laser scanning, or LiDAR, for the characterization of trees and forests. Expertise in the development of computational methods to extract eco-physiological knowledge from point clouds.
Mikko Vastaranta
Mikko Vastaranta is a professor in digitalization and knowledge leadership in forest-based bioeconomy in the School of Forest Sciences at the University of Eastern Finland. Vastaranta received his PhD in forest resource science and technology 2012. In his research, he explores nature-human-machine interactions using geoinformation science-based technologies and methods.
Oğuz Turan Buruk
Oğuz Turan Buruk is an Assistant Professor of Gameful Experience at Tampere University, Finland. His research focuses on designing gameful environments for various contexts, such as body-integrated technologies, computational fashion, posthumanism, urban spaces, extended reality, and nature. He adopts research-through-design methods, such as speculative design, design fiction, and participatory design.
Juho Hamari
Juho Hamari is a Professor of Gamification at Faculty of Information Technology and Communication Sciences at Tampere University, Finland. He leads research on gamification broadly across Flagship, Center of Excellence and Strategic Profiling programs of Research Council of Finland.
References
- Alha, K., Koskinen, E., Paavilainen, J., & Hamari, J. (2019). Why do people play location-based augmented reality games: A study on Pokémon GO. Computers in Human Behavior, 93, 114–122. https://doi.org/10.1016/j.chb.2018.12.008
- Alha, K., Leorke, D., Koskinen, E., & Paavilainen, J. (2023). Augmented play: An analysis of augmented reality features in location-based games. Convergence: The International Journal of Research into New Media Technologies, 29(2), 342–361. https://doi.org/10.1177/13548565231156495
- Alt, F., Shirazi, A. S., Schmidt, A., Kramer, U., & Nawaz, Z. (2010). Location-based crowdsourcing: Extending crowdsourcing to the real world. In Proceedings of the 6th Nordic Conference on Human-Computer Interaction: Extending Boundaries (pp. 13–22).
- AppleInc. (2023). Apple vision pro. Retrieved June 12, 2023, from https://www.apple.com/apple-vision-pro/
- Artec (2024). Artec Leo. Retrieved February 3, 2024, from https://www.artec3d.com/portable-3d-scanners/artec-leo
- Bachman, C. G. (1979). Laser radar systems and techniques. Artech House.
- Baer, M., Tregel, T., Laato, S., & Söbke, H. (2022). Virtually (re) constructed reality: The representation of physical space in commercial location-based games. In Proceedings of the 25th International Academic Mindtrek Conference (pp. 9–22).
- Baltsavias, E. P. (1999). A comparison between photogrammetry and laser scanning. ISPRS Journal of Photogrammetry and Remote Sensing, 54(2–3), 83–94. https://doi.org/10.1016/S0924-2716(99)00014-3
- Braun, V., Clarke, V., & Hayfield, N. (2022). ‘A starting point for your journey, not a map’: Nikki Hayfield in conversation with Virginia Braun and Victoria Clarke about thematic analysis. Qualitative Research in Psychology, 19(2), 424–445. https://doi.org/10.1080/14780887.2019.1670765
- Çakir, G. Y., Post, C. J., Mikhailova, E. A., & Schlautman, M. A. (2021). 3D LiDAR scanning of urban forest structure using a consumer tablet. Urban Science, 5(4), 88. https://doi.org/10.3390/urbansci5040088
- Ch’ng, E., Cai, S., Zhang, T. E., & Leow, F.-T. (2019). Crowdsourcing 3D cultural heritage: Best practice for mass photogrammetry. Journal of Cultural Heritage Management and Sustainable Development, 9(1), 24–42. https://doi.org/10.1108/JCHMSD-03-2018-0018
- Chilton, S. (2009). Crowdsourcing is radically changing the geodata landscape: Case study of OpenStreetMap. In Proceedings of the UK 24th International Cartography Conference (Vol. 6).
- Fritz, S., McCallum, I., Schill, C., Perger, C., Grillmayer, R., Achard, F., Kraxner, F., & Obersteiner, M. (2009). Geo-wiki. org: The use of crowdsourcing to improve global land cover. Remote Sensing, 1(3), 345–354. https://doi.org/10.3390/rs1030345
- Gollob, C., Ritter, T., Kraßnitzer, R., Tockner, A., & Nothdurft, A. (2021). Measurement of forest inventory parameters with apple iPad pro and integrated LiDAR technology. Remote Sensing, 13(16), 3129. https://doi.org/10.3390/rs13163129
- Gómez-Barrón, J.-P., Manso-Callejo, M.-Á., & Alcarria, R. (2019, January). Needs, drivers, participants and engagement actions: A framework for motivating contributions to volunteered geographic information systems. Journal of Geographical Systems, 21(1), 5–41. https://doi.org/10.1007/s10109-018-00289-5
- Granshaw, S. I. (2015). Editorial: Imaging technology 1430–2015: Old masters to mass photogrammetry. The Photogrammetric Record, 30(151), 255–260. https://doi.org/10.1111/phor.12112
- Halfbrick (2017). 8 cool ways to use LiDAR on your iPhone and iPad. Retrieved October 16, 2023, from https://www.halfbrick.com/blog/demolish-castles-augmented-reality-halfbricks-siege-breakers/
- Hamari, J., Malik, A., Koski, J., & Johri, A. (2019). Uses and gratifications of Pokémon GO: Why do people play mobile location-based augmented reality games? International Journal of Human–Computer Interaction, 35(9), 804–819. https://doi.org/10.1080/10447318.2018.1497115
- Heipke, C. (2010). Crowdsourcing geospatial data. ISPRS Journal of Photogrammetry and Remote Sensing, 65(6), 550–557. https://doi.org/10.1016/j.isprsjprs.2010.06.005
- Iglhaut, J., Cabo, C., Puliti, S., Piermattei, L., O’Connor, J., & Rosette, J. (2019). Structure from motion photogrammetry in forestry: A review. Current Forestry Reports, 5(3), 155–168. https://doi.org/10.1007/s40725-019-00094-3
- Konig, D. (2016). Geocaching in augmented reality. Medium.com. Retrieved June, 2023, from https://medium.com/@GoMeta/augmented-reality-geocaches-c5bbd75bc524
- Laato, S., & Tregel, T. (2023). Into the unown: Improving location-based gamified crowdsourcing solutions for geo data gathering. Entertainment Computing, 46, 100575. https://doi.org/10.1016/j.entcom.2023.100575
- Laato, S., Hyrynsalmi, S. M., & Paloheimo, M. (2019). Online multiplayer games for crowdsourcing the development of digital assets. In International Conference on Software Business (pp. 387–401).
- Laato, S., Inaba, N., & Hamari, J. (2021). Convergence between the real and the augmented: Experiences and perceptions in location-based games. Telematics and Informatics, 65, 101716. https://doi.org/10.1016/j.tele.2021.101716
- Laato, S., Xi, N., Spors, V., Thibault, M., & Hamari, J. (2024). Making sense of reality: A mapping of terminology related to virtual reality, augmented reality, mixed reality, XR and the metaverse. In Proceedings of the 57th Hawaii International Conference on System Sciences (HICSS), Hawaii, USA.
- Leberl, F., Irschara, A., Pock, T., Meixner, P., Gruber, M., Scholz, S., & Wiechert, A. (2010). Point clouds. Photogrammetric Engineering & Remote Sensing, 76(10), 1123–1134. https://doi.org/10.14358/PERS.76.10.1123
- Lefsky, M. A., Cohen, W. B., Parker, G. G., & Harding, D. J. (2002). LiDAR remote sensing for ecosystem studies: LiDAR, an emerging remote sensing technology that directly measures the three-dimensional distribution of plant canopies, can accurately estimate vegetation structural attributes and should be of particular interest to forest, landscape, and global ecologists. BioScience, 52(1), 19–30. https://doi.org/10.1641/0006-3568(2002)052[0019:LRSFES]2.0.CO;2
- Lefsky, M., Cohen, W., Acker, S., Parker, G., Spies, T., & Harding, D. (1999). LiDAR remote sensing of the canopy structure and biophysical properties of Douglas-fir Western Hemlock forests. Remote Sensing of Environment, 70(3), 339–361. https://doi.org/10.1016/S0034-4257(99)00052-8
- Liang, X., Kukko, A., Balenovic, I., Saarinen, N., Junttila, S., Kankare, V., Holopainen, M., Mokros, M., Surovy, P., Kaartinen, H., Jurjevic, L., Honkavaara, E., Nasi, R., Liu, J., Hollaus, M., Tian, J., Yu, X., Pan, J., Cai, S., … Hyyppa, J. (2022). Close-range remote sensing of forests: The state of the art, challenges, and opportunities for systems and data acquisitions. IEEE Geoscience and Remote Sensing Magazine, 10(3), 32–71. https://doi.org/10.1109/MGRS.2022.3168135
- Lindberg, R., Seo, J., & Laine, T. H. (2016). Enhancing physical education with exergames and wearable technology. IEEE Transactions on Learning Technologies, 9(4), 328–341. https://doi.org/10.1109/TLT.2016.2556671
- Liu, S., Brandt, M., Nord-Larsen, T., Chave, J., Reiner, F., Lang, N., Tong, X., Ciais, P., Igel, C., Pascual, A., Guerra-Hernandez, J., Li, S., Mugabowindekwe, M., Saatchi, S., Yue, Y., Chen, Z., & Fensholt, R. (2023). The overlooked contribution of trees outside forests to tree cover and woody biomass across Europe. Science Advances, 9(37), eadh4097. https://doi.org/10.1126/sciadv.adh4097
- Luetzenburg, G., Kroon, A., & Bjørk, A. A. (2021). Evaluation of the Apple iPhone 12 pro LiDAR for an application in geosciences. Scientific Reports, 11(1), 22221. https://doi.org/10.1038/s41598-021-01763-9
- Luna, N. V. (2017). Arcaching: Using augmented reality on mobile devices to improve geocachers’ experiences [Master’s thesis]. Texas A&M University. Retrieved June 27, 2023, from https://core.ac.uk/download/pdf/87261861.pdf
- Minecraft Earth Staff (2021). Minecraft earth coming to an end. Retrieved October 16, 2023, from https://www.minecraft.net/en-us/article/minecraft-earth-coming-end
- Mokroš, M., Mikita, T., Singh, A., Tomaštík, J., Chudá, J., Wężyk, P., Kuželka, K., Surový, P., Klimánek, M., Zięba-Kulawik, K., Bobrowski, R., & Liang, X. (2021). Novel low-cost mobile mapping systems for forest inventories as terrestrial laser scanning alternatives. International Journal of Applied Earth Observation and Geoinformation, 104, 102512. https://doi.org/10.1016/j.jag.2021.102512
- Morschheuser, B., Hamari, J., & Maedche, A. (2019). Cooperation or competition–When do people contribute more? A field experiment on gamification of crowdsourcing. International Journal of Human–Computer Studies, 127, 7–24. https://doi.org/10.1016/j.ijhcs.2018.10.001
- Morschheuser, B., Hamari, J., Koivisto, J., & Maedche, A. (2017). Gamified crowdsourcing: Conceptualization, literature review, and future agenda. International Journal of Human–Computer Studies, 106, 26–43. https://doi.org/10.1016/j.ijhcs.2017.04.005
- Morsdorf, F., Kükenbrink, D., Schneider, F. D., Abegg, M., & Schaepman, M. E. (2018). Close-range laser scanning in forests: Towards physically based semantics across scales. Interface Focus, 8(2), 20170046. https://doi.org/10.1098/rsfs.2017.0046
- Penekli, H. I. (2020). Visualizing a point cloud using depth in unity. GitHub. Retrieved October 16, 2023, from https://github.com/cdmvision/arfoundation-densepointcloud
- Pingel, T. J., Clarke, K. C., & McBride, W. A. (2013). An improved simple morphological filter for the terrain classification of airborne LiDAR data. ISPRS Journal of Photogrammetry and Remote Sensing, 77, 21–30. https://doi.org/10.1016/j.isprsjprs.2012.12.002
- Schell, J. (2014). The art of game design: A book of lenses (2nd ed.). A. K. Peters, Ltd.
- Schneider, J., & Jadczaková, V. (2016). Mutual impacts of geocaching and natural environment. Acta Universitatis Agriculturae et Silviculturae Mendelianae Brunensis, 64(5), 1739–1747. https://doi.org/10.11118/actaun201664051739
- Statista (2022). Do you personally use a mobile phone? how many mobile phones with different telephone numbers do you use at least once a month? Retrieved October 31, 2022, from https://www.statista.com/statistics/387193/mobile-phone-numbers-per-person-in-the-uk/
- Statista (2023). Highest grossing geolocation AR mobile games worldwide in 1st quarter 2022, by revenue. Retrieved September 3, 2023, from https://www.statista.com/statistics/272332/top-grossing-ar-mobile-games/
- Tatsumi, S., Yamaguchi, K., & Furuya, N. (2022). ForestScanner: A mobile application for measuring and mapping trees with LiDAR-equipped iPhone and iPad. Methods in Ecology and Evolution, 14(7), 1603–1609. https://doi.org/10.1111/2041-210X.13900
- Triangle Factory (2017). AR sports basketball. Game[iOS].
- Tursi, G., Deplano, M., & Ruffo, G. (2014). Aircacher: Virtual geocaching powered with augmented reality (pp. 330–332). Association for Computing Machinery. https://doi.org/10.1145/2631775.2631778
- Wehr, A., & Lohr, U. (1999). Airborne laser scanning—An introduction and overview. ISPRS Journal of Photogrammetry and Remote Sensing, 54(2–3), 68–82. https://doi.org/10.1016/S0924-2716(99)00011-8
- Whitney, L. (2024). 8 cool ways to use LiDAR on your iPhone and iPad. Retrieved February 3, 2024, from https://www.zdnet.com/article/how-to-use-lidar-on-the-iphone-and-ipad/
- Xu, J., Papangelis, K., Dunham, J., Boulanger, C., Lee, J. H., Lalone, N., & Saker, M. (2023). Understanding social interactions in location-based games as hybrid spaces: Coordination and collaboration in raiding in Pokémon GO. In Proceedings of the 2023 Chi Conference on Human Factors in Computing Systems (pp. 1–19). https://doi.org/10.1145/3544548.3581544
- Zhao, Y., & Han, Q. (2016). Spatial crowdsourcing: Current state and future directions. IEEE Communications Magazine, 54(7), 102–107. https://doi.org/10.1109/MCOM.2016.7509386