
 ?Mathematical formulae have been encoded as MathML and are displayed in this HTML version using MathJax in order to improve their display. Uncheck the box to turn MathJax off. This feature requires Javascript. Click on a formula to zoom.
Abstract
Spreadsheets are a widespread functional programming paradigm that offer liveness and directness of interaction. However, spreadsheets are notoriously error-prone and difficult to debug. To overcome this limitation and improve the expressive power of spreadsheets, we propose an extension to the spreadsheet paradigm in the form of sheet-defined lambdas – user-defined functions that abstract computations on the sheet. This concept was developed and deployed in our web-based spreadsheet application named Lattice. We evaluate this approach through a user study which compared the user experience of programming in a spreadsheet with and without lambdas, as well as the difference in performance between learner (N = 12) and experienced (N = 12) programmers. The study measured participant task performance (task time, success rate and number of errors) and the quality of their user experience of using Lattice (video recordings of use, interviews and questionnaire responses). Our findings indicate that programming with lambdas is not only more efficient than writing formulas in a conventional way, but also provides a rewarding hedonic experience. However, we found that learners perceived the concept of functional abstractions with lambdas as difficult to comprehend; while experienced programmers noted potential utilitarian advantages that aid in managing the complexity of a spreadsheet program. The results obtained in this work contribute to a better understanding of human-spreadsheet interaction and can inform the future design of user-friendly computational systems.
1. Introduction
While spreadsheets are well-known as a data management and analysis tool across various businesses, they are in fact an example of a functional programming paradigm. However, spreadsheet code is often poorly documented and difficult to maintain. Many authors have proposed various approaches to solving these problems, ranging from changing or extending the spreadsheet interface or the formula language for effective analysis and debugging of errors to abstracting data/procedures to prevent them (see Section 2). In recent years, industry-leading spreadsheet software, such as Microsoft Excel and Google Sheets, have introduced the LAMBDA command, which lets their users define custom functions without needing to rely on scripting languages. However, these systems rely on additional layers of interaction with the user interface to achieve this functionality. We believe that the experience of programming in a spreadsheet can be improved with the addition of a mechanism to abstract computations into functions directly on the sheet.
Historically, the design and development of programming languages and environments primarily focused on such aspects as computational efficiency and syntactic complexity, which optimize the computer’s understanding of the instructions. However, programming is a human-centered activity and thus, usability and user experience of programming languages and tools are equally important aspects to consider (Myers et al., Citation2016).
In this paper, we report our findings from a user study which focused on exploring the hedonic and pragmatic experiences of programming in a spreadsheet with and without functional abstractions. Furthermore, we compare the differences in performance between learner and experienced programmers, which in turn informs us on the programming needs of users of varying experience levels.
2. Related work
2.1. Spreadsheet programming
Thinking of a spreadsheet as a programming language might be unnatural to many who have been primarily exposed to textual programming languages through their formal education and work experience. However, what is a programming language if not a way to communicate with computers? To that degree, spreadsheets have been successfully used to write formulas for instructing computers to perform laborious tasks of data analysis and calculations for years. Many authors argue that spreadsheet programming is actually functional programming (Abraham et al., Citation2009; Burnett et al., Citation2001; De Hoon et al., Citation1995) with a great emphasis on the liveness and reactiveness of the interaction (Gulwani & Marron, Citation2014; Hermans et al., Citation2016).
When it comes to limitations, spreadsheets are infamous for being susceptible to vexing errors that are difficult to debug (Panko, Citation1998). This is commonly attributed to the fact that spreadsheets hide computations and dependencies in exchange for data visibility (Sarkar et al., Citation2018). Typical spreadsheet errors include writing incorrect formulas, referencing incorrect cell coordinates in formulas and hard-coding numbers into formulas (Powell et al., Citation2009). Many efforts have been made to resolve this problem through various add-ons and tools that visualize the program structure and relationships between its components (Hermans et al., Citation2012; Mittermeir & Clermont, Citation2002), assist in testing user programs (Wilson et al., Citation2003) or redesign the interface of the formula editor (Jansen & Hermans, Citation2019).
An alternative approach to address this limitation is to minimize its likelihood altogether by introducing abstraction mechanisms to the spreadsheet paradigm. Examples of this include visually-manipulated forms (Burnett et al., Citation2001), sheet-defined functions (Bock et al., Citation2020; Jones et al., Citation2003) and, most recently, computational abstractions (the LAMBDA function in Excel and Google Sheets) (Sarkar et al., Citation2022). In our research we focus on the second approach of introducing sheet-defined lambdas.
2.2. User studies of spreadsheets
Many user studies of spreadsheets in the literature have primarily focused on analyzing errors made while authoring programs. Brown and Gould (Citation1987) report that of the 27 spreadsheet programs created by nine experienced users in their study, 44% contained errors, with the most prevalent being incorrect formulas. Teo and Tan (Citation1997) found that of the 168 spreadsheets developed by the participants in their study, 41.7% contained errors in the first exercise and 50% – in the second exercise. They identified three main error types: (i) logic (incorrect algorithm/formula), (ii) omission (incomplete model of a solution) and (iii) mechanical (typo/incorrect cell reference) errors. The authors also note that logic and omission errors made in the first exercise were more difficult for participants to detect and correct in the second exercise than mechanical errors.
In their study of the factors affecting spreadsheet error detection, Howe and Simkin (Citation2006) found that their participants (228 Information Systems students) identified only 67% of all errors present in the test spreadsheets. The authors also report that none of their predictors (age, gender, years of programming and spreadsheet experience, among others) explained the ability of users to detect errors, which they deemed unexpected.
A number of studies in this field have attempted to understand the precursors of spreadsheet errors. One notable example of a common source of errors is the complexity of spreadsheet formulas. Having interviewed ten industrial spreadsheet users in their study of formula smells, Hermans et al. (Citation2015) conclude that complex formulas are difficult to understand and modify, particularly for non-authors. The researchers note that the complexity of formulas most frequently stems from either coding multiple operations into a single formula, or chaining multiple formulas to perform a calculation as an alternative approach.
Much effort in the spreadsheet research community has been dedicated to developing and testing various approaches of reducing spreadsheet errors. Based on the results of two user studies, Janvrin and Morrison (Citation1996) note that participants, who designed the structure of a spreadsheet (using data-flow diagrams) prior to implementing it in a software program, completed the task faster and made fewer linking errors in the process. In their study of the relationship between errors and task complexity using spreadsheet programming and programming by example paradigms, Thorne et al. (Citation2013) observed that solutions produced by spreadsheet programming participants were more prone to errors and misinterpretations, as the task complexity grew. The authors propose that building spreadsheet programming models using a machine learning algorithm based on the user input data may reduce the likelihood of defects in programs.
One of the most underexplored research avenues is the interplay between programming and spreadsheets, which we are particularly interested to delve into. An exploratory survey conducted by Sarkar et al. (Citation2020) shows a correlation between programming expertise and formula expertise, whereby experienced programmers are likely to become proficient in formula writing, and vice versa. However, as noted by the authors, further studies are necessary to understand this phenomenon.
3. Sheet-defined functional abstractions
In the context of this paper, a lambda is a custom function that a user defines on the grid of a spreadsheet application like any other formula. The main purpose of extending the spreadsheet paradigm with sheet-defined lambdas is to enable functional abstraction of computations as a reusable unit that is native to the formula language. The addition of this abstraction mechanism enables users to develop complex programs that are easier to maintain by virtue of a modular incremental design. Traditionally, spreadsheets have lacked such functionality, which meant users had to rely on external scripting languages (such as VBA or JavaScript) to be able to create their own custom functions. However, this arguably made writing custom functions inaccessible for the average user who may not have been familiar with programming, as it required switching to a programming language different not only syntactically, but also conceptually from the formula language (Peter Sestoft, Citation2014).
To evaluate the usability and user experience of sheet-defined lambdas, we have developed a web-based spreadsheet application, named Lattice, that includes this abstraction mechanism.
In our spreadsheet tool lambdas are defined using the following formula:
(1)
(1)
where
argument_range is a range of arguments that are used in the body;
body_range is a range of cells that are calculated to produce a result;
return_cell is a cell containing the return value of a function (the result).
Declaring a lambda on the sheet in Lattice implicitly defines it as a reusable function, which differs from the multi-step approach of the commercial spreadsheets (Microsoft Excel and Google Sheets) that requires an additional interaction with a distinct user interface layer.
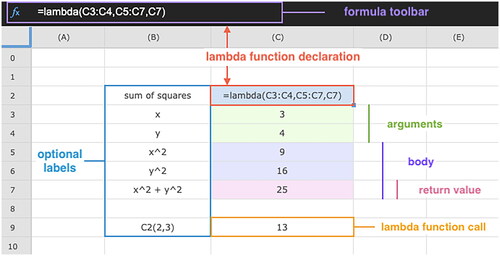
illustrates an example program that calculates the sum of squares of two given numbers. We begin by inputting two test values, 3 and 4, in cells C3 and C4, respectively. Next, we calculate the square of each of these values by writing a formula of the form “=X*X” in cells C5 and C6, where X is replaced by the corresponding cell coordinates (C3 and C4). The final step is to add the resulting squared values in cell C7. Lastly, we define a lambda in cell C2 following the template in EquationEquation (1)(1)
(1) to reuse these calculations. It is worth noting that a lambda can be defined before or after the logic of a function has been implemented. To call a lambda with another set of inputs, we use its cell coordinate. For example, “=C2(2,3)” in cell C9.
Figure 1. An example of a lambda function definition in Lattice. The declaration formula lives in cell C2, while the colored cells C3:C7 represent the constituent parts of a lambda, i.e., the arguments, followed by the body and the return value cell within the body range.
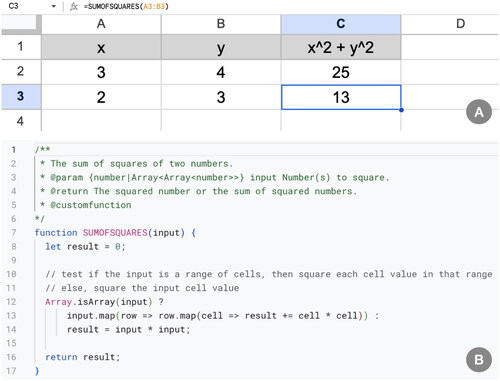
By comparison, demonstrates how a custom function to achieve the same goal might be implemented in a conventional scripting language using the Apps ScriptFootnote1 platform that is integrated into Google Sheets. Screenshot B shows a JavaScript function SUMOFSQUARES that calculates the square of the input (a cell or a range) and outputs the squared cell value or the sum of squares in the case of a range input. Once this function is saved, it can be called in a spreadsheet, as shown in screenshot A. It is worth noting that the user is required to be familiar with writing functions and understand how to work with objects (e.g., Array) in JavaScript. Additionally, Apps Script is launched in its own development environment that is different from a standard spreadsheet, which means the user has to become accustomed to a potentially unfamiliar separate user interface.
Figure 2. An example of a user-defined function SUMOFSQUARES, that calculates the sum of the squares of two numbers, implemented in Apps Script (B) and used in Google Sheets (A).
4. Methods
To evaluate the impact of using lambda on the user experience of programming in a spreadsheet, we conducted a within-subjects experiment. We also wished to explore how the experience of programming in a spreadsheet differed for people of varying levels of programming expertise.
The two research questions that we attempted to answer in our study were:
Q1 does using lambdas improve the user performance and user experience of programming in a spreadsheet?
Q2 does programming expertise affect the perception of programming in a spreadsheet?
H1 the user experience of programming in a spreadsheet differs when using lambda or not;
H2 programming expertise affects the task completion time when using lambda or not.
4.1. Study design
4.1.1. Variables
The independent variable in our study was the use of functional abstraction (Lambda), which had two levels (conditions):
With Lambda (WL) – completing programming tasks in a spreadsheet using lambdas;
No Lambda (NL) – completing programming tasks in a spreadsheet without the use of lambdas.
To reduce the carryover practice effects, the ordering of these conditions was counterbalanced using a Latin square, such that half of the participants in each group started with NL.
The dependent variables in our study were both quantitative and qualitative in nature. We sought to measure participant performance and attitudes.
Performance metrics (Rogers et al., Citation2023) that we recorded were:
completion time – the time it takes to successfully complete a task (the mean in minutes);
success rate – the number of participants who completed a task (expressed as a percentage);
errors – the number and types of errors made during task completion.
To assess the subjective experience of interacting with the spreadsheet (see Section 4.4), we defined the following three qualitative variables:
ease of programming – comparison of the two methods of programming (WL and NL) to determine their perceived level of complexity;
quality of the experience – evaluation of the hedonic value of the experience of programming using the two methods (WL and NL);
preference – participants’ reported inclinations towards the two methods of programming (WL and NL).
To evaluate the “quality of experience” of our extended spreadsheet system from the pragmatic (efficiency and effectiveness) and hedonic (aesthetic value and emotional impact) perspectives, we chose the standardized User Experience Questionnaire (UEQ (Schrepp, Citation2015)) for our study. Compared to another option that we considered (AttrakDiff (Hassenzahl et al., Citation2003)), the terms used in the UEQ are perceived as easier to understand (Walter et al., Citation2023). Additionally, the UEQ use is widespread in the literature and has been growing at a faster rate than AttrakDiff in recent years (Díaz-Oreiro et al., Citation2019).
The programming tasks were an extraneous variable in our study. In order to control its effects, the tasks were standardized, such that every participant received the same set of tasks, and the same set of tasks in the same order were used to test both conditions in this study. The theme of the programming tasks was Boolean Algebra and Logic Gates, which are fundamental topics in the curriculum of Computer Science/Engineering degree courses (Jiménez‐Hernández et al., Citation2020; Ristov et al., Citation2016). These topics can be effectively translated into spreadsheet programs owing to the data-flow model of the spreadsheet programming paradigm, whereby values flow between cells depending on the relationship specified by the formulas, similar to logic circuits and Boolean equations.
4.1.2. Apparatus
We carried out our study in an online voice call format with screen sharing and audio recording using Zoom software. The questionnaires were distributed via a link to Google Forms.
We used our research spreadsheet tool, Lattice,Footnote2 for the experiment. It is based on the open-source spreadsheet web application (ipgridFootnote3) that was implemented in JavaScript. Lattice is similar in appearance to most modern spreadsheets (such as Google Sheets and Microsoft Excel), albeit with fewer customization options. The web page of Lattice can be accessed using the latest version of the recommended browsers (Chrome, Safari or Firefox).
4.2. Participants
We invited a total of 24 participants (mean age: 26.79 years (SD: 7.81), 2 females, 22 males) to take part in our study. Half of the participants were learner programmers and the other half were experienced programmers. Learners were Bachelor’s or Master’s students in Computer Science or related disciplines. Experienced programmers were Software Developers/Engineers or PhD students in the field of Computer Science. All participants were over 18 years old, fluent in English and familiar with using spreadsheet software. They were recruited via the ProlificFootnote4 platform and paid GBP 15 for participating. Ethical approval for this study was obtained from the ethics committee at the first author’s university (see Section Ethical approval). Every participant submitted an electronic informed consent form to take part in the study.
The distribution of participant programming experience (in years) and the highest education levels are specified in and , respectively. illustrates the distribution of study participants by the self-reported levels of programming knowledge and spreadsheet expertise. No experienced programmers possessed an introductory level of programming knowledge, and no learner programmers were expert spreadsheet users. Approximately half of the participants self-assessed their skill levels in programming and spreadsheet use as intermediate. A summary of the demographic and skills data of the participants is listed in . P01 to P12 were learners and P13 to P24 were experienced programmers.
Figure 3. Highest education levels of the participants in each category (learner/experienced).
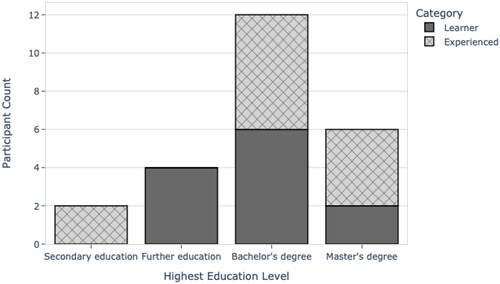
Figure 4. Distribution of the self-assessed levels of programming knowledge (from introductory to expert) and spreadsheet expertise (from beginner to expert) per participant category (learner/experienced).
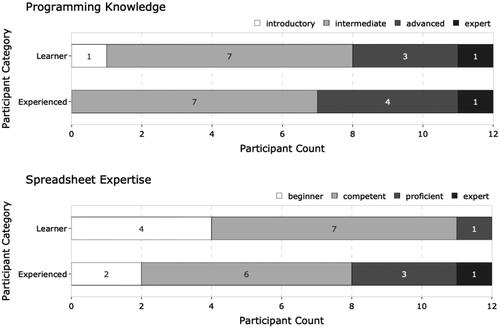
Figure 5. Information on the demographics and skills of the participants. P01-P12 are learners; P13-P24 are experienced programmers. Education refers to the highest education level achieved. Programming knowledge and spreadsheet expertise were self-assessed by the participants.
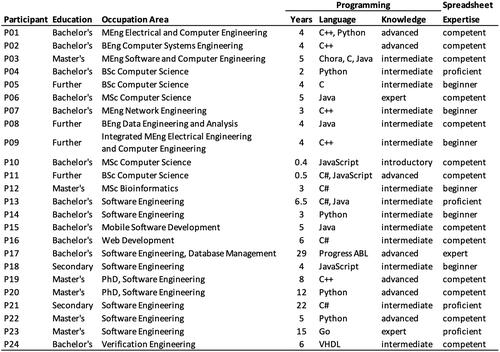
Table 1. Distribution of the years of programming experience of the participants per category (learner/experienced).
When it comes to familiarity with the themes of the study, three participants (P10, P21, P24) were new to the concept of lambdas in programming and one participant (P16) was unfamiliar with the topic of Logic Gates/Boolean Algebra.
4.3. Procedure
The Zoom call with each participant lasted approximately 90 minutes. At the start of the call participants were asked to fill out a demographics-and-skills questionnaire. Next, they watched a video clip that provided a summary of logic gates and demonstrated our research tool, Lattice. Participants got hands-on experience of the tool and practiced defining lambdas prior to completing the experimental programming tasks.
The process of task completion was as follows:
Complete two programming tasks under the starting condition;
Fill out the User Experience Questionnaire for the starting condition;
Complete two programming tasks under the second condition;
Fill out the User Experience Questionnaire for the second condition;
Participants were advised to work under each condition for 20 minutes, however they were allowed to move on to the next section if they finished earlier and were not stopped if they needed a reasonable amount of extra time to finish the task.
The final stage of the study consisted of a semi-structured interview, followed by a short post-activity questionnaire.
4.3.1. Tasks
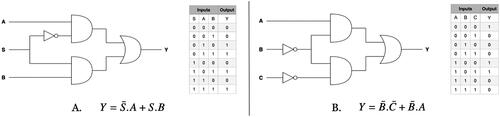
During the task completion phase, participants were asked to implement two Boolean equations with (WL) and without (NL) the use of lambdas. They were presented with a diagram of the digital circuit and a truth table for each of the equations (). Participants were allowed to reuse parts of their solution to task 1 in task 2. Additionally, they were asked to verify that their programs were correct by testing them with the values from the truth tables.
Figure 6. Schematic and the corresponding truth table of each of the two Boolean equations (A – left and B – right) that participants needed to implement during task completion.
4.4. Data collection
The task completion process of the experiment was screen-recorded during the voice call. The resulting video files were analyzed by the first author to record the task duration, completion and errors made. The interview part of the study was audio-recorded and transcribed verbatim after the voice call. All recordings were deleted after the analysis for anonymity and data protection purposes.
The data collected using the User Experience Questionnaire (UEQ) (see , Appendix A), semi-structured interview and post-activity questionnaire (Appendix B) was used to measure the qualitative dependent variables in our study.
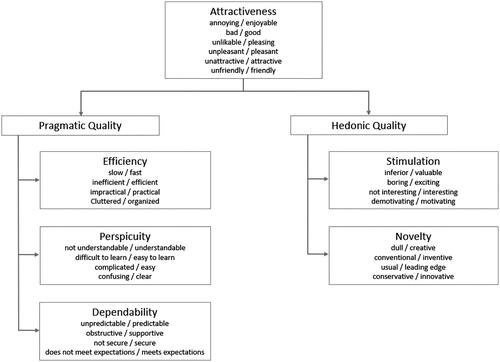
The 7-point semantic differential items of the UEQ are arranged into 6 different scales (see , Appendix A). Schrepp et al. (Citation2017), the authors of the UEQ, define its scales as follows:
attractiveness: overall impression of liking or disliking the system;
perspicuity: the measure of how difficult it is to learn to use the system;
efficiency: the measure of the amount of effort required to operate the system;
dependability: the quality of the system behaving as expected, allowing the user to feel in control of the interaction;
stimulation: the degree to which the system elicits the excitement and motivation to use it;
novelty: the evaluation of whether the user perceives the system as innovative and creative.
Participants complete the UEQ by selecting responses on 7-point Likert items. Each scale of the UEQ is then measured by averaging the transformed user scores of its constituent items, as defined in the official UEQ Data Analysis Tool (freely available on the UEQ websiteFootnote5). Additionally, the obtained values may be compared to the average scores of the benchmark data set in the provided tool, resulting in one of the five evaluations (Bad, Below Average, Above Average, Good, Excellent).
The goal of the semi-structured post-activity interview was to gather participant feedback on the areas of their experience that were not covered by the UEQ. The interview used the following four questions as starting points for discussions with the participants about their experience:
Please could you describe what you just experienced?
What did you find most enjoyable about the experience?
How would you compare the two methods that you used to complete the tasks?
What was the most challenging aspect of programming in a spreadsheet? Did either of the two methods help to make it less challenging?
We purposefully phrased these questions in a broad, open-ended manner to enable a dialogue with the participants by means of further enquiries based on their responses. Furthermore, during the interview we asked the participants to explain their thought process in relation to any interesting patterns of behavior that we observed in task completion. The purpose of the interview Question 1 was to give the participants an opportunity to express their impressions of the study and describe their understanding of the experience, without enforcing any particular direction. The next item, Question 2, sought to identify what participants prioritized when describing their hedonic experiences. The goal of Question 3 was to determine if the participants noticed any similarities or differences between the two study conditions, which could guide our understanding of the participant programming needs. Question 4 was designed to uncover any challenges related to spreadsheet programming in general that could have affected the user experience. Additionally, we wished to understand if either of the two conditions assisted the participants in overcoming said challenges.
We designed a post-activity questionnaire (PQ) made of 7 statements to compare the two methods of completing the tasks (with lambdas and without them). For each statement, we asked the participants to choose a method for which they agreed with the statement, giving a brief reasoning for their choice. The statements of the PQ were specific to the programmer experience rather than the overarching user experience. Thus, we asked the participants to make a direct comparison between the two implementation methods to assess the perceived complexity, efficiency and personal preference. Due to the long duration of the experiment and the high cognitive load of the tasks, we constrained the PQ to 7 statements with binary outcomes in an attempt to reduce respondent fatigue (Dolnicar et al., Citation2011; Dolnicar & Leisch, Citation2012).
5. Results
In the following subsections we report the quantitative and qualitative results collected in our user study.
5.1. Task completion
To assess the quantitative dependent variables in our study, we analyzed participant performance measurements related to the three aspects of task completion: success rate, time and errors. Success rate represents the proportion of participants who completed a task successfully out of the total number of participants who attempted it. We define success as following the instructions fully and arriving at the correct final result; while failure means abandoning the task completion process or producing an incorrect final result. As shown in , 20 (83.33%) out of the total of 24 participants in our study completed the tasks successfully under the WL condition and 22 (91.67%) – under the NL condition.
Table 2. Measures of performance per task for our study conditions (WL and NL), including success rate, average completion time (t in minutes) and its standard deviation (SD).
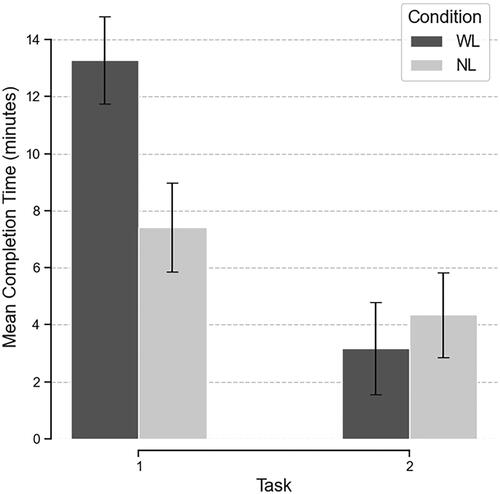
The task completion time in this context provides an estimation of how long it took the participants to complete the tasks successfully. In our results we report a geometric mean completion time and its geometric standard deviation for every task and condition, since the geometric mean is a better estimate of the central tendency of task times for a small sample size (n < 25), as discussed in Sauro and Lewis (Citation2010). The comparison of the task completion times between WL and NL is depicted in . We estimate that, on average, participants completed the first task approximately 1.8 times faster under the NL condition. Conversely, they finished the second task on average 1.4 times faster under the WL condition.
Figure 7. Mean completion time (in minutes) per task for each study condition. Error bars represent standard deviation. n = 20 (WL), 22 (NL) sample points.
To evaluate the association between the participant programming experience and the duration of their task completion process, we ran the Spearman’s correlation test on the two variables. We chose a non-parametric test due to the presence of non-normal data. As demonstrated in , we found that there was no statistically significant correlation between the number of years a person spent programming and their task completion time.
Table 3. The Spearman’s correlation test to evaluate the association between the years of programming experience of participants and their task completion time for the two study conditions per task.
Lastly, we examined each participant’s screen recording, noting down all the observed behavior, to identify what kinds of errors were the most prevalent. Following that we calculated the total number of occurrences per error type in every task/condition combination for all participants. As a result, we found that there were two main categories of errors: (i) usability errors and (ii) logical mistakes. Examples of usability errors include dragging the cursor past the last cell when auto-filling values/formulas; selecting an incorrect cell when referencing it in a formula; and accidentally modifying a formula by clicking non-target cells while still in edit mode. When it comes to logical errors, they most frequently meant making mistakes in the structure of the if-formula (such as, using an incorrect number of arguments or an incorrect order of the true/false return values) or writing an incorrect Boolean condition of a logic gate. As shown in , implementing the tasks using lambdas (WL) resulted in fewer errors of all types except for incorrect cell references, where the number was near identical to the NL version. It is worth noting that type 1 and type 2 errors (refer to ) could be attributed to user interface limitations of the spreadsheet application used as a base of our research tool, rather than spreadsheet programming in general.
Table 4. The types of errors made by participants during task completion and their number.
5.2. User experience
The six scales of the UEQ helped us to measure the “quality of the experience” dependent variable per study condition. Upon transforming participant responses to the [-3 (most negative); +3 (most positive)] scale, as advised in the official UEQ Handbook, we calculated the measures of central tendency (mean and median) and the dispersion (standard deviation and interquartile range) of the user data. The resulting values are listed in . Using the standard interpretation of the scale means (Paramitha et al., Citation2018), values between −0.8 and +0.8 represent a neutral evaluation and values outside of this range depict a negative and a positive evaluations, respectively. Hence, our results show that the WL condition was positively evaluated across all six scales, while the NL version received a mixed feedback spanning across the whole range of values.
Table 5. Measures of central tendency (mean; median) and dispersion (standard deviation – SD; the interquartile range – IQR) of the six UEQ scales for WL and NL conditions.
As seen in , WL tended to score positively higher than NL in Attractiveness, Efficiency, Stimulation and Novelty. Moreover, we ran the Wilcoxon signed-rank test on the data and confirmed that these findings were statistically significant (see ).
Figure 8. Comparison of the UEQ scale medians between WL and NL conditions. Centre lines indicate the medians; boxes indicate the 25th (Q1) and 75th (Q3) percentiles; whiskers extend 1.5 times the interquartile range from Q1 and Q3. n = 24 sample points per condition.
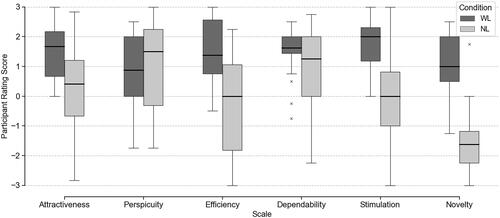
Table 6. The Wilcoxon signed-rank test to compare WL and NL conditions based on the six UEQ scales.
Further comparison of our scale means with the benchmark dataset provided in the UEQ Data Analysis Tool (v.12) showed that the WL version performed noticeably well across all scales, except for Perspicuity, where its score was below the average (see ). In contrast, the NL version fared badly across all scales, except for Perspicuity and Dependability, where its scores were below the average of the benchmark dataset.
Table 7. Comparison of the scale means in our study to the UEQ benchmark dataset.
5.3. User preferences
presents the distribution of participants for each statement in our post-activity questionnaire per study condition (WL/NL). For statements 1 and 2, the number of participants who chose WL closely matched the number of those who selected NL. However, it is worth noting that 72.73% of participants, who chose NL as the easier method of programming in a spreadsheet, were learners. Furthermore, 75% of all learners felt more confident programming without the use of lambdas. Perhaps unsurprisingly, 91.67% of learners selected WL as the more complex option in statement 4.
Table 8. Participant distribution for every statement in our custom-designed post-activity questionnaire.
Nevertheless, programming with lambdas produced better results and was the preferred method overall, as evidenced by the number of participants who chose this option in statements 3 and 5. Additionally, 87.5% of all participants stated that they would consider using it for their personal programming projects. Lastly, 23 out of the total of 24 participants expressed that using lambdas made their programming experience rewarding.
5.4. Qualitative results
We followed an iterative inductive approach to thematic analysis, described in Braun and Clarke (Citation2006), to evaluate participant answers to the interview questions and their comments made in support of their choices in the post-activity questionnaire. During the initial coding phase we identified a total of 290 codes (labels to describe the content of a passage of text) in the transcripts. Next, we carried out multiple rounds of reviewing the codes and grouping them into possible themes. As a result of the final refinement phase, we developed two main themes and nine corresponding sub-themes, which are illustrated in . We found that when describing their experiences and comparing the two implementation methods (with and without the use of lambdas), participants approached it either from a subjective emotional point of view or a pragmatic outlook on the importance of efficiency in programming. In the following sections we define each theme and present verbatim quotes from the participants (P01-P12: learners [L]; P13-P24: experienced programmers [E]) in support of the sub-themes.
Figure 9. A concept map of the themes (ellipses) and sub-themes (rectangles) developed through thematic analysis of the participant comments.
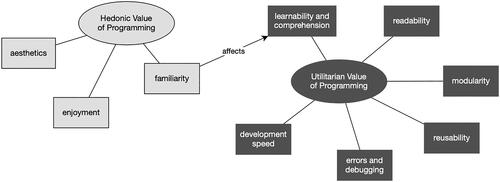
Figure A1. A 26-item UEQ in English.
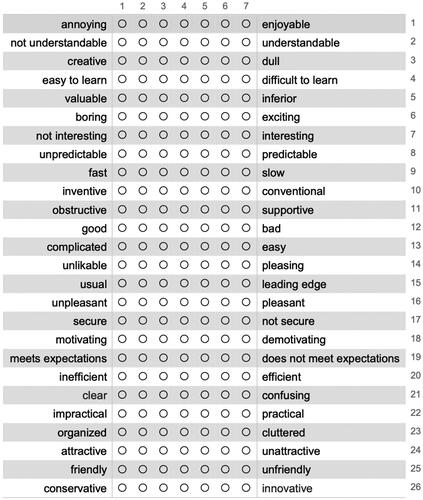
Figure A2. The assumed scale structure of the User Experience Questionnaire (Schrepp, Citation2015).
5.4.1. Theme: Hedonic value of programming
Overall, participants found the experience of programming with lambdas to be rewarding. Interestingly, learners tended to attribute that to a sense of accomplishment, resulting from learning something new and successfully applying that knowledge; while experienced programmers identified the efficiency of programming with lambdas to be the most enjoyable aspect.
For instance, when asked to explain their choice of lambda in statement 7 (“My experience was rewarding”) of the post-activity questionnaire, participants gave the following answers:
“because I just learned it, so… it felt great when I made it” (P07|L).
“because I felt I had gained knowledge on the lambda. It was not something I experienced before” (P12|L).
“of course lambda because it is … clear, neat, and clever way to solve the problem” (P18|E).
On the other hand, when expressing their feelings about using the conventional NL method, participants often described it as uninspiring and tedious:
“If I had to program in spreadsheets for my personal programming, I think I’d definitely use lambdas. I think it’d be like hell using the first method [no-lambda] to do anything productive” (P09|L).
“I think the first one [no-lambda] … it’s the simplest way to do it, but on the other hand, it is more boring and exhausting” (P22|E).
When it comes to the visual presentation of the two methods, participants found that lambdas were helpful for organizing the grid space and resulted in a clear layout:
“I could very easily visually see what’s happening … the user can just see which is inputs, which is … the logic, and then you get the output, which is very useful” (P08|L).
“It [lambda] will help me … remove clutter … I really like to be … cleanly when I work” (P10|L).
“I like the way you put colors in lambdas, and then you have other colors in the cells that are being used … it looks great” (P19|E).
Through our analysis we found that familiarity with the conventional NL method gave rise to a sense of comfort and security in participants while programming:
“I felt like I’m in a familiar territory when I do the if-statement [no-lambda] like… it’s a normal day of coding” (P02|L).
“I’d say that the first method [no-lambda] is more pragmatic like… if you have to get the job done – I think it’s a better way, maybe” (P09|L).
“I felt more confident using no-lambda … I know I do an exhausting way, but I know that it was correct” (P22|E).
5.4.2. Theme: Utilitarian value of programming
5.4.2.1. Learnability and comprehension
The consensus among most participants was that lambdas were a complex concept to grasp. Many learners stated that the structure of the lambda definition formula was confusing and learning how to write it correctly was not straightforward. On the other hand, experienced participants tended to look beyond the initial learning curve and evaluate lambdas as an improvement over the NL approach due to their aid in program comprehension, particularly when it comes to reviewing another person’s code. Additionally, we found that familiarity with a method affected its perceived complexity. Thus, learners often found the NL method easier to understand because they had previous knowledge of using if-statements in other programming languages; whereas experienced programmers tended to appreciate the functional abstractions more due to it being a staple approach in the industry of software development.
“It [lambda] is easy once you get the hang of it but in the beginning it is a bit confusing” (P01|L).
“It’s [the lambda method] harder to learn if you haven’t made this but easier to maintain” (P19|E).
“The first one [lambda] is superior, but it’s more complex and difficult to master. But once you get the grasp, it makes the work easy” (P23|E).
5.4.2.2. Readability
One of the most mentioned characteristics when comparing the two methods was readability. However, it is interesting to note that this aspect of programming was primarily discussed by experienced programmers. Based on their comments, readability of code is important when you need to modify or debug a program, especially when you are not the author of said program. Most experienced programmers in our study and some learners agreed that programming with lambdas produced a clear and organized solution. When it comes to the NL method, participants often mentioned having difficulty navigating logical elements within nested if-formulas. In fact, only 3 out of the 24 participants in our study utilized a nested approach when solving the tasks in NL, while the majority resorted to breaking their solutions down into multiple steps, each requiring a separate column.
“I think in readability of the code … lambda is less complex … it’s easier to have a global view” (P03|L).
“I think it’s easy to go back and read the statement again, because this one [lambda] is just more concise and short. So, it’s easy to gain back focus again after you lose some time over a shortcut” (P14|E).
“While declaring functions, my spreadsheet is very clean, readable. I know where something is, if I want to … check something or … correct some mistake in the function” (P18|E).
5.4.2.3. Modularity
We found that modular design of a program was considered more valuable the more programming experience the participant had. A number of experienced programmers commended the lambda approach for the flexibility that it offers when combining basic elements to compose a complex program. Given that very few learners discussed this aspect, it appears that breaking a problem down into individual pieces of functionality requires practice.
“Without lambdas you are gonna end up with tons of columns you gotta hide, or some big, unwieldy formula that nobody is going to be able to discern and make a change to if needed … I thought it was easier to do the lambdas cause I could break it down into smaller chunks” (P17|E).
“I preferred to program in lambda, and this is because I really liked the fact that it felt very much like programming, like calling functions and everything, and I like the modularity that it offered” (P20|E).
“I think that it [lambda] is a good method to split the problem in little parts and link it again when you need the final solution” (P21|E).
Furthermore, many learners stated that their choice of the implementation method would depend on the complexity of the problem at hand. One common reasoning was that lambdas required more effort to implement, thus they would be more appropriate and worthwhile to use when the task was more complex.
“I think the most important comparison we could say is that one [NL] is a naive approach of how to solve this issue and the other one [WL] is more, I would say, sophisticated in a way … Sometimes it’s overpowered to use lambda functions … But I would say, when you start to have more complicated patterns … lambda functions can give you a more clear view of the overall project” (P03|L).
“I would personally do it without lambdas … maybe in a more difficult and complex environment, I would maybe try to use the lambda” (P05|L).
“Once you start implementing additional logic where it gets complex, then [NL] starts to be a bigger issue than solving the issue – like the task itself. So that’s when the lambdas shine” (P08|L).
5.4.2.4. Reusability
Both learner and experienced programmers acknowledged the benefit of high reusability of lambdas in a spreadsheet. The two main ideas brought forth by the participants were: (1) reusing functions reduces the probability of errors in the code; (2) reusing functions reduces the overall development time. A few participants also noted the advantage of automatic propagation of changes due to functions being reused in the WL method as opposed to the necessity of manual modifications of formulas in the NL version.
“When I used the lambda expressions for the first time, I felt like it’s kind of like a waste of time. But actually, I think over time, if you need to use a lot of them, it’s probably gonna be better because you’re reusing the statements you already wrote and just changing the parameters” (P11|L).
“If you used lambda, and you used the same function in a few places, you can change that one function, and it’s just changed everywhere” (P17|E).
“If there’s something that already works, you can just keep using it [lambda] rather than trying to re-implement it and having the risk of making a mistake … I know that once one thing works, it’s going to work the same way again” (P20|E).
“Once you create a lambda function, you can reuse it again and again. That saves a lot of time” (P24|E).
5.4.2.5. Errors and debugging
As discussed in the literature, spreadsheet errors are notoriously difficult to spot and fix. Perhaps the most troubling are errors resulting from referencing incorrect cells, since they may not generate any error messages and go unnoticed. This is something the participants in our study observed while completing the tasks. While neither of the methods directly addressed this issue, the use of lambdas enabled a unit testing approach. Thus, participants confirmed that their lambdas were correct before combining them to solve the final Boolean equation. They stated that it gave them confidence in finding an incorrect reference, since it significantly narrowed down the possible location of a bug.
“It’s less probable to make a mistake because you don’t have to change cells, you just type one function [lambda] and use it in other cells, just like in programming languages” (P04|L).
“The if-expressions were too clustered in one line … so that was the difficult part to find the syntax errors … The lambda method could help in that situation” (P06|L).
“I think debugging is going to be way easier on lambda, because if you have one function that misbehaves, you know exactly where it was defined … [with NL] it’s very tempting to copy your formula out of the spreadsheet and put it in a text editor, to try and… well, type it up properly so that you can see the nesting … I think that defeats the aim if you have to use a tool to use a tool” (P20|E).
5.4.2.6. Development speed
Perhaps the most discussed criteria for choosing one method over the other was the speed of development. This aspect was important to both learners and experienced programmers. Here the consensus was that even though lambdas took longer to set up, they ultimately saved time in subsequent applications. As some participants stated, while it may have been quicker to implement the NL solution for a simple task, it did not scale well with the complexity of a task and resulted in a lot of wasted time spent copying and pasting parts of a solution in subsequent tasks.
“I know if I feel comfortable with lambda next time when I use it, I would prefer lambda because it is more… fast” (P12|L).
“It was a pretty interesting challenge here … very creative. And this functionality [lambda] is actually very time-saving” (P14|E).
“I think with some more time I would properly create my lambda functions and arrange them in a meaningful way, so that I could use and reuse them quite fast” (P16|E).
“With the nested IFs [NL] definitely I would spend more time when I, for example, have to do like 10 of these tasks” (P17|E).
6. Discussion
The main goal of this study was to evaluate the effect of adding functional abstractions in the form of sheet-defined lambdas to a spreadsheet. Having applied a within-subjects design to compare the experience of writing standard formulas to composing custom functions, we found that the latter not only improves the efficiency of programming in a spreadsheet, but also evokes positive feelings in participants. For instance, a sense of fulfilment as a result of using a novel method and curiosity about possible use cases of lambda. Furthermore, we were able to gain insight into the needs of learner and experienced programmers.
Our findings indicate that the initial learning curve of lambdas affected the completion times of the first programming task, as well as the resulting perception of the lambda method difficulty in comparison to the conventional formula approach. This statement is supported by the longer periods of time that participants spent completing the first task and the lower mean score given to the lambda method by the participants on the Perspicuity scale of the User Experience Questionnaire. Furthermore, based on the responses to the post-activity questionnaire, we found that primarily learner programmers evaluated the lambda method as more complex overall and more difficult to implement. However, as indicated by the interview responses and the higher mean score on the Efficiency scale of the UEQ, with additional training, using lambdas could become the preferred method for complex projects. Many participants noted that reusability of lambdas reduces the development time and the probability of making an error. These qualitative observations are further supported by the shorter completion time of the second programming task and the substantially lower number of errors due to logical mistakes when using lambdas compared to the conventional formula approach.
In the following subsections we discuss the quantitative and the qualitative results in more detail, as well as reflect on the limitations and future work.
6.1. Usability of lambdas in a spreadsheet
As reported in Section 5, the number of participants who successfully completed every task without the use of lambda was slightly higher than those who succeeded in using the lambda method. Additionally, the participants completed the first task faster under the no-lambda condition. However, we speculate that these results are due to the novelty of the lambda method compared to the standard use of if-statements in NL. It is possible that the initial learning curve and the lack of extensive practice with lambdas affected how well the participants performed in the tasks and how long it took them. We suggest that the increase in proficiency after using lambdas for a longer period of time might result in a higher success rate and a reduced task completion time.
Our second hypothesis (H2) stated that the programming expertise affects task completion time. While we did notice a very weak negative association between those variables, the result of the correlation analysis showed that it was not statistically significant; hence, we reject H2. It is possible that a larger sample size with a well-balanced range of experience levels will demonstrate the statistical significance of this observation.
When it comes to the types of errors made and their number, we found that neither of the methods has improved the problem of referencing incorrect cells. Perhaps implementing the functionality of naming lambdas could reduce the number of these instances in relation to calling user-defined functions. On the other hand, our results showed that participants made fewer logical errors when implementing the first task using lambdas and no mistakes were made in the second task. It is likely that participants made fewer mistakes in the first task because the use of lambda enabled them to break their solution down into manageable components and test those individually. Also, reusability of lambdas meant that they did not need to write any logical formulas again.
6.2. Lambdas enrich spreadsheet programming
The evaluation of the qualitative data generated by the questionnaires and the interview revealed that the majority of participants in our study preferred to program using sheet-defined lambdas. Participants found the lambda method to be user-friendly and enjoyable. They often mentioned that learning to use lambda was novel and provided a rewarding experience. We believe that the hedonic value of this experience could play an important role in stimulating the interest of learners in learning to program using a spreadsheet. However, another study focusing on the aspect of learning and teaching to program using a spreadsheet needs to be conducted to confirm or disprove this theory.
The main difference between learner and experienced programmers surfaced in their evaluation of the utilitarian value of using lambdas, which answers Q2 (see Section 4). Despite seeing the value in reusability and speed of development with lambdas, learners tended to favor the conventional method (NL) because of its ease and familiarity. On the contrary, experienced programmers acknowledged the improvements in readability and debugging of a spreadsheet program that used sheet-defined lambdas due to its modular design. Furthermore, experienced programmers relied on their coding experience to achieve faster development speed when using lambdas due to their reusability.
Having assessed the qualitative results of our study, we can accept the first hypothesis (H1) that states that the experience of programming in a spreadsheet varies depending on the implementation method used. Furthermore, we conclude that lambdas positively affect the performance and experience of programming in a spreadsheet, which answers Q1 (see Section 4).
6.3. Limitations and future work
As a consequence of the COVID-19 pandemic, our study was carried out in an online format with participants recruited through Prolific. Despite the high total number of participants available through the platform, it was difficult to find a sample that perfectly fit the notion of novice and expert programmers. Thus, we ended up with some participants whose expertise could be described as intermediate in both categories. Hence, the results of this study may differ if reproduced with true novices, who possess a limited knowledge of programming. A future studyFootnote6 with a more rigorous pre-screening process to evaluate participant programming expertise could address this limitation.
Another limitation is that our experiment was carried out in a condensed time period. Many participants indicated that a longer training session with lambdas would have improved their performance in the task completion phase. Despite their confirmation of readiness to undertake the tasks, it is possible that some participants needed more time to understand and learn to use lambdas. We think this limitation can be overcome by running a future longitudinal study, whereby participants are given the opportunity to practice implementing spreadsheet programs using sheet-defined lambdas without strict time constraints.
In terms of technical limitations, a prominent constraint of the current version of sheet-defined functional abstractions that confines their scope is the inability to use them across multiple workbooks. It is possible to overcome this limitation in future iterations of Lattice by implementing a system akin to packages in conventional programming ecosystems, whereby the user may share their custom lambdas as a reusable module that may be imported across workbooks.
7. Conclusion
In this paper, we presented the results of a within-subjects study exploring the experience of programming in a spreadsheet using sheet-defined lambda abstractions. We analyzed and compared two implementation methods (with and without the use of lambdas) through various usability and user experience measurements. Overall, we found that sheet-defined lambda abstractions improve the usability of a spreadsheet for programming multi-dimensional concepts. Despite having a steeper learning curve than the conventional approach, programs implemented with the use of lambdas had an organized visual layout that improved their readability and debugging. Additionally, reusability of lambdas made implementing successive tasks much quicker and more straightforward. Participants in our study reported experiencing a sense of accomplishment and excitement after completing the tasks using lambdas. Lastly, we found that the main difference between learner and experienced programmers was in their evaluation of the perceived difficulty and learnability of lambdas. Hence, in our future studies we would like to concentrate on examining how functional abstractions affect program comprehension in programmers of various levels of expertise.
Ethical approval
This study was approved by the Electronic Engineering and Computer Science Devolved School Research Ethics Committee at Queen Mary University of London (reference number: QMERC20.565.DSEECS22.130).
Disclosure statement
The authors hereby certify that, to the best of their knowledge, there are no conflicts of interest to disclose.
Additional information
Funding
Notes on contributors
Anel Kudebayeva
Anel Kudebayeva is a PhD candidate at the Department of Computer Science, Queen Mary University of London. Her research interests lie in the area of human-centered computing. Her current work focuses on the intersection of HCI and computer programming, in particular improving the spreadsheet paradigm for programming education.
Christopher Harte
Christopher Harte is an engineering leader with interests in a number of different research areas including HCI, music theory and perception, music information retrieval and signal processing. He is currently a visiting lecturer at Queen Mary University of London.
Nick Bryan-Kinns
Nick Bryan-Kinns is Professor of Creative Computing at the University of the Arts London. He is Fellow of the Royal Society of Arts and the British Computer Society, and Senior Member of the Association of Computing Machinery. He researches explainable AI, AI music, interaction design, interactive art, and cross-cultural design.
Tony Stockman
Tony Stockman is a lecturer and researcher at Queen Mary University of London. With over 100 peer-reviewed HCI publications, he is a former president and now emeritus Board member of the International Community for Auditory displays (ICAD). He has served on organizing committees of numerous international HCI conferences.
Notes
6 At the time of the publication of this paper follow-up studies have not yet been conducted.
References
- Abraham, R., Burnett, M., & Erwig, M. (2009). Spreadsheet programming. In Wiley Encyclopedia of computer science and engineering (pp. 2804–2810). John Wiley & Sons. https://doi.org/10.1002/9780470050118.ecse415
- Bock, A. A., Bøgholm, T., Sestoft, P., Thomsen, B., & Thomsen, L. L. (2020). On the semantics for spreadsheets with sheet defined functions. Journal of Computer Languages, 57, 100960. https://doi.org/10.1016/j.cola.2020.100960
- Braun, V., & Clarke, V. (2006). Using thematic analysis in psychology. Qualitative Research in Psychology, 3(2), 77–101. https://doi.org/10.1191/1478088706qp063oa
- Brown, P. S., & Gould, J. D. (1987). An experimental study of people creating spreadsheets. ACM Transactions on Information Systems, 5(3), 258–272. https://doi.org/10.1145/27641.28058
- Burnett, M., Atwood, J. O. H. N., Walpole Djang, R., Reichwein, J., Gottfried, H., & Yang, S. (2001). Forms/3: A first-order visual language to explore the boundaries of the spreadsheet paradigm. Journal of Functional Programming, 11(2), 155–206. https://doi.org/10.1017/S0956796800003828
- De Hoon, W. A. C. A. J., Rutten, L. M. W. J., & van Eekelen, M. C. J. D. (1995). Implementing a functional spreadsheet in Clean. Journal of Functional Programming, 5(3), 383–414. https://doi.org/10.1017/S0956796800001404
- Díaz-Oreiro, I., López, G., Quesada, L., & Guerrero, L. A. (2019). Standardized questionnaires for user experience evaluation: A systematic literature review [Paper presentation]. Proceedings 31.1 (2019). https://doi.org/10.3390/proceedings2019031014
- Dolnicar, S., Grün, B., & Leisch, F. (2011). Quick, simple and reliable: Forced binary survey questions. International Journal of Market Research, 53(2), 231–252. https://doi.org/10.2501/IJMR-53-2-231-252
- Dolnicar, S., & Leisch, F. (2012). One legacy of Mazanec: Binary questions are a simple, stable and valid measure of evaluative beliefs. International Journal of Culture, Tourism and Hospitality Research, 6(4), 316–325. https://doi.org/10.1108/17506181211265059
- Gulwani, S., & Marron, M. (2014). NLyze: Interactive programming by natural language for spreadsheet data analysis and manipulation for Computing Machinery, 2014 [Paper presentation]. Proceedings of the 2014 ACM SIGMOD International Conference on Management of Data (pp. 803–814), New York. https://doi.org/10.1145/2588555.2612177
- Hassenzahl, M., Burmester, M., & Koller, F. (2003). AttrakDiff: Ein Fragebogen zur Messung wahrgenommener hedonischer und pragmatischer Qualität. In Mensch & Computer 2003: Interaktion in Bewegung (pp. 187–196). Vieweg+Teubner Verlag.
- Hermans, F., Pinzger, M., & van Deursen, A. (2015). Detecting and refactoring code smells in spreadsheet formulas. Empirical Software Engineering, 20(2), 549–575. https://doi.org/10.1007/s10664-013-9296-2
- Hermans, F., Jansen, B., Roy, S., Aivaloglou, E., Swidan, A., & Hoepelman, D. (2016). Spreadsheets are code: An overview of software engineering approaches applied to spreadsheets [Paper presentation]. 2016 IEEE 23rd International Conference on Software Analysis, Evolution, and Reengineering (SANER) (Vol. 5. pp. 56–65). https://doi.org/10.1109/SANER.2016.86
- Hermans, F., Pinzger, M., & van Deursen, A. (2012). Detecting and visualizing inter-worksheet smells in spreadsheets [Paper presentation]. 34th International Conference on Software Engineering (ICSE) (pp. 441–451). https://doi.org/10.1109/ICSE.2012.6227171
- Howe, H., & Simkin, M. G. (2006). Factors affecting the ability to detect spreadsheet errors. Decision Sciences Journal of Innovative Education, 4(1), 101–122. https://doi.org/10.1111/j.1540-4609.2006.00104.x
- Jansen, B., & Hermans, F. (2019). XLBlocks: A block-based formula. Editor for spreadsheet formulas [Paper presentation]. 2019 IEEE Symposium on Visual Languages and Human-Centric Computing (VL/HCC) (pp. 55–63). https://doi.org/10.1109/VLHCC.2019.8818748
- Janvrin, D., & Morrison, J. (1996). Factors influencing risks and out comes in end-user development [Paper presentation]. Proceedings of HICSS-29: 29th Hawaii International Conference on System Sciences (Vol. 2. pp. 346–355). https://doi.org/10.1109/HICSS.1996.495418
- Jiménez‐Hernández, E. M., Oktaba, H., Díaz‐Barriga, F., & Piattini, M. (2020). Using web-based gamified software to learn Boolean algebra simplification in a blended learning setting. Computer Applications in Engineering Education, 28(6), 1591–1611. https://doi.org/10.1002/cae.22335
- Jones, S. P., Blackwell, A., & Burnett, M. (2003). A user-centred approach to functions in Excel. ACM SIGPLAN Notices, 38(9), 165–176. https://doi.org/10.1145/944746.944721
- Mittermeir, R., & Clermont, M. (2002). Finding high-level structures in spreadsheet programs [Paper presentation]. Ninth Working Conference on Reverse Engineering (pp. 221–232). https://doi.org/10.1109/WCRE.2002.1173080
- Myers, B. A., Ko, A. J., LaToza, T. D., & Yoon, Y. (2016). Programmers are users too: Human-centered methods for improving programming tools. Computer, 49(7), 44–52. https://doi.org/10.1109/MC.2016.200
- Panko, R. R. (1998). What we know about spreadsheet errors. Journal of Organizational and End User Computing, 10(2), 15–21. https://doi.org/10.4018/joeuc.1998040102
- Paramitha, A. A. I. I., Dantes, G. R., & Indrawan, G. (2018). The evaluation of web based academic progress information system using heuristic evaluation and user experience questionnaire (UEQ) [Paper presentation]. 2018 Third International Conference on Informatics and Computing (ICIC) (pp. 1–6). IEEE. https://doi.org/10.1109/IAC.2018.8780430
- Peter Sestoft. (2014). Sheet-defined functions. In Spreadsheet implementation technology: Basics and extensions (pp. 127–150). MIT Press.
- Powell, S. G., Baker, K. R., & Lawson, B. (2009). Errors in operational spread sheets: A review of the state of the art [Paper presentation]. 2009 42nd Hawaii International Conference on System Sciences (pp. 1–8). https://doi.org/10.1109/HICSS.2009.197
- Ristov, S., Jovanov, M., Gusev, M., & Mihova, M. (2016). Curriculum reorganization and courses’ collaboration in computer science [Paper presentation]. 2016 IEEE Global Engineering Education Conference (EDUCON) (pp. 349–354). https://doi.org/10.1109/EDUCON.2016.7474577
- Rogers, Y., Sharp, H., & Preece, J. (2023). Interaction sesign: Beyond human-computer interaction. Wiley.
- Sarkar, A., Borghouts, J. W., Iyer, A., Khullar, S., Canton, C., Hermans, F., & Williams, J. (2020). Spreadsheet use and programming experience: An exploratory survey [Paper presentation]. Chi EA’20 (pp. 1–9), Honolulu, HI, USA. https://doi.org/10.1145/3334480.3382807
- Sarkar, A., Gordon, A. D., Jones, S. P., & Toronto, N. (2018). Calculation View: Multiple-representation editing in spreadsheets [Paper presentation].2018 IEEE Symposium on Visual Languages and Human-Centric Computing (VL/HCC) (pp. 85–93). https://doi.org/10.1109/VLHCC.2018.8506584
- Sarkar, A., Ragavan, S. S., Williams, J., & Gordon, A. D. (2022). End-user encounters with lambda abstraction in spreadsheets: Apollo’s bow or Achilles’ heel? [Paper presentation]. 2022 IEEE Symposium on Visual Languages and Human-Centric Computing (VL/HCC) (pp. 1–11). https://doi.org/10.1109/VL/HCC53370.2022.9833131
- Sauro, J., & Lewis, J. (2010). Average task times in usability tests: What to report? [Paper presentation]. Conference on Human Factors in Computing Systems (pp. 2347–2350). https://doi.org/10.1145/1753326.1753679
- Schrepp, M. (2015). “User experience questionnaire handbook”. https://doi.org/10.13140/RG.2.1.2815.0245
- Schrepp, M., Thomaschewski, J., & Hinderks, A. (2017). Construction of a benchmark for the user experience questionnaire (UEQ). International Journal of Interactive Multimedia and Artificial Intelligence, 4(4), 40–44. https://doi.org/10.9781/ijimai.2017.445
- Teo, T. S. H., & Tan, M. (1997). Quantitative and qualitative errors in spreadsheet development [Paper presentation]. Proceedings of the Thirtieth Hawaii International Conference on System Sciences (Vol. 3, pp. 149–155). IEEE. https://doi.org/10.1109/HICSS.1997.661583
- Thorne, S., Ball, D., & Lawson, Z. (2013). Reducing error in spreadsheets: Example driven modeling versus traditional programming. International Journal of Human–Computer Interaction, 29(1), 40–53. https://doi.org/10.1080/10447318.2012.677744
- Walter, T., Marques, L. C., Redmiles, D., de Oliveira, E. H., & Conte, T. (2023). Investigating the influence of different factors on the UX evaluation of a mobile application. International Journal of Human–Computer Interaction, 39(20), 3948–3968. https://doi.org/10.1080/10447318.2022.2108658
- Wilson, A., Burnett, M., Beckwith, L., Granatir, O., Casburn, L., Cook, C., & Rothermel, G. (2003). Harnessing curiosity to increase correctness in end-user programming [Paper presentation]. In Proceedings of the SIGCHI Conference on Human Factors in Computing Systems. Association for Computing Machinery (pp. 305–312). https://doi.org/10.1145/642611.642665
Appendix A.
User experience questionnaire
This version was obtained from the official website: https://www.ueq-online.org/.