
Abstract
Search engine results pages (SERPs) commonly organize online search results in a list-based format. Various viewing formats have been suggested to improve search effectiveness, efficiency, and user satisfaction. However, except for the Knowledge Graph view, which is based on semantic search and appears as information boxes on the SERP, those views are rarely implemented in popular Web search engines. This study investigates the effect of three viewing formats (list, Google Knowledge Graph, and clustered list) on user performance and satisfaction when performing five common types of search tasks mapped in previous studies (navigate, find-simple, find-complex, locate/acquire, and explore/learn). A Chrome extension we developed is used to enable clustering on Google search results. While overall effectiveness was similar across viewing formats, efficiency and satisfaction varied significantly depending on the search task. The operative implication is that search engine viewing formats should adapt to the specific search task.
1. Introduction
Online search is one of the most common activities performed when using the Internet (Purcell, Citation2011). Search engine results pages (SERPs) typically contain a list of items, each consisting of a title, URL, short summary (also termed a snippet, extract, or abstract), and additional metadata (Hearst, Citation2009). Various viewing formats have been developed to enhance searchers’ ability to perceive, interpret, and comprehend the information available during the search process (Hoeber, Citation2018); for example, the clustered list viewing format groups items according to similarity measures, commonly utilizing the folder-tree metaphor. However, such viewing formats are seldom implemented in popular Web search engines. One exception is the Knowledge Graph (KG) view, which is based on semantic search and is an integral component of the SERPs of popular search engines (e.g., Google Knowledge Graph and Microsoft Satori).
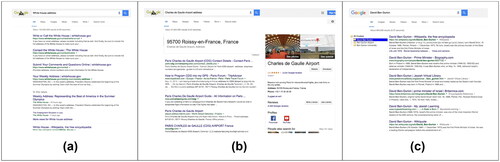
The Google Knowledge Graph (GKG), a knowledge base used by Google to improve its search engine’s search results, uses semantic information collected from a wide variety of sources. It is based on entities rather than keywords and queries. The GKG can be described as structured, hierarchical information aimed at resolving users’ queries without the need to navigate through the traditional site list (Singhal, Citation2012). The data depicted visually from the KG appears as information boxes, typically consisting of knowledge panels (positioned on the right side of the ranked list of search results) or knowledge cards (located above the results). While knowledge panels provide a lot of information, knowledge cards present a single piece of information, like a graph or a single definition. We use the term "GKG view" to denote the presentation of the SERP incorporating these information boxes alongside or above the traditional list of search results (see ).
Figure 1. The three SERP viewing formats examined: (a) list view, (b) GKG view, (c) clustered list view.
Knowledge graphs are critical in many enterprises in diverse industrial settings (Google, Microsoft, Facebook, eBay, IBM), providing the structured data and factual knowledge that drive intelligence in products (Noy et al., Citation2019). While KG technology has drawn a great deal of research attention in recent years, studies have mainly focused on KG construction techniques and embedding approaches and applications (e.g., Akinnubi & Ajiboye, Citation2023; Li et al., Citation2019; Li et al., Citation2023; Liu et al., Citation2016; Luo et al., Citation2022; Wang et al., Citation2017); in contrast, little attention has been given to the end-user performance and experience when performing search tasks as assessed through user studies. In this research we investigate the effect of the GKG view on user effectiveness, efficiency, and satisfaction, when performing various search tasks, compared to the effect of the traditional list and clustered list views.
A user study was conducted to compare the three SERP viewing formats (). To avoid bias stemming from the use of different search engines, which can return different search results for the same query, this study is based solely on the Google search engine, the most popular and widely used search engine (Mangles, Citation2018). To enable comparison among the viewing formats, we developed a real-time clustered list viewing format based on Google search results.
Previous research demonstrated that SERP types and task complexity affect user interactions with search results (e.g., Roy et al., Citation2022). Therefore, it is imperative to investigate how different viewing formats impact users’ experiences across various search task types. Russell et al. (Citation2009) identified seven basic types of tasks – navigate, find-simple, find-complex, locate/acquire, explore/learn, meta, and play. In our study, the first five task types were used, aiming to identify the most appropriate viewing format for each task type by investigating the effects of the three viewing formats on user performance and satisfaction measures when performing these tasks.
2. Literature review
Significant advancements in search technologies and back-end efforts have improved search engine information retrieval techniques, and today, Web search engines respond to user queries and search vast quantities of data almost instantaneously. However, improved visualization tools have the potential to help end users better explore and make use of search results (Andrews et al., Citation2001). A number of studies have suggested modifications to the traditional list-based search results view (e.g., Cellary et al., Citation2004; Hoeber & Yang, Citation2009; Hoeber & Yang, Citation2006). While numerous innovative search result formats such as verticals (Liu et al., Citation2015; Wang et al., Citation2013), cards (Shokouhi & Guo, Citation2015; Wang et al., Citation2016), knowledge graphs (Lagun et al., Citation2014), and direct answers (Deng et al., Citation2023; Keikha et al., Citation2014) have been proposed and implemented, the majority of commercial search engines continue to adhere to the conventional structure comprised of titles, snippets, and URLs.
Hoeber and Yang (Citation2009) categorized Web search and information retrieval visualization systems based on their representation format (textual, visual, or visual representation based on a document abstraction). Mann (Citation1999) used Shneiderman’s framework (Shneiderman, Citation1996) to describe the process of searching relevant results in Web search engines according to three areas of interest: (1) set level, providing an overview of the sets of websites presented (helpful for identifying trends, clusters, or hot spots); (2) website level (Shneiderman’s “zoom and filter” step), where users filter the results, obtaining a specific list of websites; (3) document level (Shneiderman’s "details on demand" step). The user decides whether a specific URL merits following. Shneiderman’s framework can be demonstrated using common viewing formats as follows. Using clustered list view, website sets are presented as groups. The user selects a group, and a corresponding document list is displayed. The clustered list view can be considered a set level representation, where each cluster, visualized by a list of documents, is a website level representation. The KG view is associated with the document level as it displays additional details about the searched entity, and it is integrated into the SERP list view, representing the website level. Often, simply viewing the SERP’s GKG fulfills the user’s need for information.
2.1. List view
The vertical list view is the most common technique for representing online search results (Hearst, Citation2009). Although the list view makes it easy to evaluate a single document for relevance, it is less useful for manipulating or exploring search results when inspecting a collection of relevant documents (Hoeber & Yang, Citation2009). Studies have investigated the effects of list view configurations on end-user performance, suggesting best practices and guidelines for configuring different list elements (Baldonado & Winograd, Citation1998; Clarke et al., Citation2007; Cutrell & Guan, Citation2007; Tombros & Sanderson, Citation1998), most of which are implemented in the Google search engine.
2.2. Clustered list view
Although researchers have explored document clustering as a method for organizing long lists of search results, the clustered list view has not been deployed on the major search engines. In document clustering, similarity is computed using associations and commonalities among features (e.g., words, and phrases); a good clustering algorithm groups documents that are similar to one another but different from other clusters’ documents. Zamir and Etzioni (Citation1998, Citation1999) defined the clustering engine requirements as follows: the clusters are coherent and efficiently “browsable,” and the results are quickly displayed. Clustering’s greatest advantages are its automation, easy application to any text collection, and ability to reveal interesting trends in groups of documents. Various solutions have been proposed to address its disadvantages (Koshman et al., Citation2006; Zeng et al., Citation2009), which are unpredictability in the form and quality of results and difficulty in labeling groups and the cluster’s subhierarchies (especially in real time).
As the clustered list view is primarily intended for browsing results, the scheme for visualizing and manipulating the hierarchy is very important. The predominant approach is based on hierarchical folders. The folder-tree display was successfully adopted by Vivısimo (Koshman et al., Citation2006) and other Web clustering engines, including SnakeT (Ferragina & Gulli, Citation2008). As the hierarchical folder metaphor of hierarchical folders is used for storing/retrieving files, bookmarks, and menu items, users are familiar with it; therefore, no training is required. Furthermore, the textual folder hierarchy layout is efficient to compute and easily manipulated. However, given the folder-tree representation’s drawbacks (not very compact or aesthetic), alternative tree viewing formats (e.g., Grokker) have been proposed (Carpineto et al., Citation2009b).
Past studies investigating clustering and categorizing results demonstrated its search benefits, i.e., finding results more quickly and accurately (Carpineto et al., Citation2009a; Carpineto et al., Citation2004; Dumais et al., Citation2001). Comparisons of existing clustering systems to a standard SERP (Ruthven & Kelly, Citation2011; Cutting et al., Citation1992) found that clustering enables easier and quicker identification of groups of more relevant documents. Toda et al. (Citation2007) regarded the clustering task as constructing an index of search results. Their evaluations showed that the proposed methods are more useful than the current methods. Zamir and Etzioni (Citation1999) concluded that it is not unequivocal that the clustered presentation (their “Grouper” interface) is better than a ranked list or vice versa, and that it depends on the search task and user’s need; in cases where the user intends to examine a large set of documents on a topic, it is better to visualize the results as clusters, since this tended to be more efficient in terms of search time and click distance.
2.3. Knowledge graph view
The GKG enables Google to approach user search differently, moving from searching for pages that match query terms or tokens to searching for entities or concepts that the terms or tokens describe. In general, entities are people, places, and things (nouns). The idea is that the search is not only for a keyword or combinations of a few keywords but rather for things - people, cities, movies, events, etc. This understanding paves the way for a paradigm shift in search, which focuses on the collective intelligence that exists on the Web and helps machines understand the world as people do (Herman, Citation2009). The structured knowledge consists of vertices (representing entities) and edges (representing connections among entities). Instead of treating words as “tokens,” the GKG aims to comprehend the words’ meaning by understanding their connections to other entities (Singhal, Citation2012). The GKG reflects a transition from strings of characters to concepts representing people, places, and other entities.
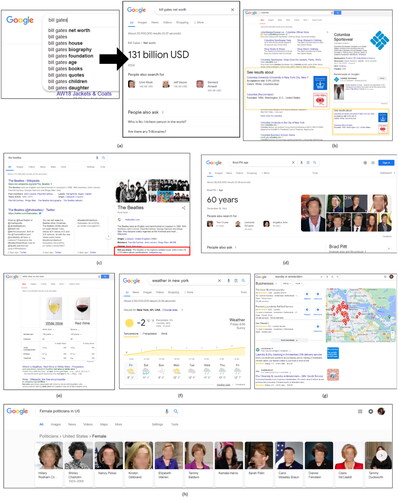
In response to users’ queries, GKGs provide hierarchical information, visualized (GKG view) as information boxes presented within the SERP, typically appearing alongside the ranked list of search results ( (knowledge panel)) or above the results ( (knowledge card)), reducing the need to navigate through a list of sites. The GKG has the potential to improve user experience and reduce the load on search engines and websites, which get dramatically lower traffic than before (Dame, Citation2015). The GKG enhances Google search results in three main ways: summarization (e.g., ), language ambiguity (e.g., ), and discovery (e.g., ) (Mazurek & Waldner, Citation2018; Singhal, Citation2012). In addition to the classic GKG info box (), there are other common GKG views (presented in ), including the specific info box, comparison tool, weather box, location-based list, and GKG carousel view.
Figure 2. Examples of common GKG views: (a) summarization - specific GKG info box for the query, "bill gates net worth," (b) language ambiguity for “columbia,” (c) discovery GKG for “the beatles,” (d) specific GKG info box for “brad pitt age,” (e) comparison tool results for “white wine vs. red wine,” (f) GKG weather box for “weather in New York,” (g) GKG location-based list for “laundry in amsterdam,” (h) GKG carousel for “female politicians in US.”.
2.4. Mapping online search tasks
Various categorization schemes have been suggested for understanding and studying Web search tasks (Guha et al., Citation2003; Kim, Citation2006; Kellar et al., Citation2007; Şendurur & Yildirim, Citation2015), deriving query intents from Web search engine queries (Agarwal & Sahu, Citation2021; Lewandowski et al., Citation2012; Verberne et al., Citation2013) and designing an appropriate interface (Chua, Citation2012). For example, Guha et al. (Citation2003) defined two search types: navigational and research. In navigational search, users provide a phrase or word combination that they expect to find in a document and use the results to navigate to a specific document; in this case, there is no actual concept that can be denoted from the user’s query. In a research search, the user provides a phrase that denotes an object he/she is trying to gather information about, most likely from various documents; the GKG was designed to support research search. Broder (Citation2002) suggested a taxonomy of the goals behind Web search, classifying queries into three classes according to their intent: navigational (the immediate intent is to reach a particular site), informational (the intent is to acquire some information assumed to be present on one or more Web pages), and transactional queries (the intent is to perform some Web-mediated activity, such as making a purchase). Lorigo et al. (Citation2006) found that users’ performance and pupil dilation are influenced by whether the search task is informational or navigational and not by gender. Marchionini (Citation2006) proposed a set of search activities associated with an exploratory search process and separated the activities related to exploration from lookup searches. In this study, we chose to focus on the following five basic task types out of the seven identified by Russell et al. (Citation2009):
Navigate (equivalent to “navigational search”) – queries that lead to the site where the main task is performed. These queries are often the direct names of destination sites or terms that are heavily suggestive of the target site (e.g., “Microsoft main Web page”).
Find-Simple (equivalent to “research search”) – searching for a piece of information that does not require multiple sources, e.g., finding specific information about an entity (“what is the address of a specific restaurant?”), a search task that will likely result in a GKG info box. Zamir and Etzioni (Citation1998) introduced another example of finding entities from the same domain (e.g., "five jazz musicians"), for which the GKG carousel will likely appear.
Find-Complex – finding an answer to a complex question. This task may require integrating data from several sources (e.g., a search for a way to knit socks using a search for sock patterns and knitting instructions). Another example introduced by Zamir and Etzioni (Citation1998) is a comparison between comparable entities (e.g., "three differences between NYC and Paris"), for which the GKG comparison tool might appear.
Locate/Acquire – aimed at downloading something (document, image, etc.), locating a service, purchasing an item, etc. ("find a computer to buy"), a query that will likely result in a GKG location-based list.
Explore/Learn – seeking an overview of an unfamiliar topic to learn about it and discover new information. This usually requires examining a large set of documents (e.g., "information about tourist attractions in Rome").
In the current work, the play and meta task types of Russell et al. were not explored, as those tasks are less common and difficult to simulate in lab conditions. We examined the effects of three views (list, GKG, and clustered list) on users’ performance and satisfaction when performing the abovementioned five task types.
3. Research hypotheses
As previous research showed that the search task type may affect users’ performance and preferences, an examination of the effects of the viewing formats for each search task type is needed. Consequently, hypotheses were formulated separately for each task type:
H1 – Navigate tasks: The GKG view is the most effective, efficient, and preferred. The GKG typically appears on the side of the SERP, providing a direct link to the required URL. In the list view, the actual website required might appear after sponsored links, commercial content, etc.; Therefore, the GKG view may be more efficient. The clustered list view is inappropriate for such tasks due to its complexity.
H2 – Find-Simple tasks: The GKG view is the most effective, efficient, and preferred in finding the information required. The GKG will save the user time and effort by providing a straightforward answer without the need to click on the result. Although the list view might also be good for find-simple tasks, it may be less efficient. As the relevant result will likely be ranked high among other search results, the clustered list view might not be useful for this task.
H3 – Find-Complex tasks: The list view is the most effective, efficient, and preferred. The GKG may not encompass all the required information in cases of complex questions, as the query is not related to one entity (e.g., complex “how to” and complex comparison queries). A clustered list view will probably be less efficient in such tasks, as users might need to navigate between several clusters to reach the answer.
H4 - Locate/Acquire tasks: This hypothesis is divided into two sub-hypotheses:
H4.1 Locate tasks: The GKG view is the most effective, efficient, and preferred. In queries like “provide names of three laundry services in Amsterdam” The GKG view will provide all of the required data in one information box, unlike the list view where the user will probably need to navigate between several URLs. The clustered list view is not suitable, as it forces the user to navigate between several clusters to find the answer, reducing user efficiency.
H4.2 Acquire tasks: The list view is the most effective, efficient, and preferred. In tasks like “provide a URL for downloading Skype” or “purchase a Sharp refrigerator” the GKG view might not include a link to a site where the product could be purchased. While the clustered list view may also be appropriate, it may be less efficient.
H5 - Explore/Learn tasks: The clustered list view is the most effective, efficient, and preferred. In such tasks, the user will likely need to navigate between several topics or clusters to obtain the desired information. In the clustered list view the results are organized by topic, helping the user gain control of the vast amount of information and become familiar with the theme explored. As those are complex tasks, the GKG view might not encompass all the required information; the list view might be equally effective but less efficient.
4. Method
4.1. Participants
Fifty-eight university students (46 men and 12 women) whose ages ranged from 19 to 29 years-old (average age − 24.2) participated in this study. All participants had a technological orientation and used search engines daily. The participants received extra credit points for participating in the experiment and signed an informed consent form before participating in the study.
4.2. Apparatus and materials
To compare the three views and avoid bias, all tasks were performed on the same search engine. The Google search engine only includes the list and GKG views, so to avoid using a different search engine to present the clustered list, a real-time clustered list viewing format based on Google search results was developed. Therefore, aside from the presentation, the results retrieved were identical for each viewing format. In addition, to test each viewing format independently, all GKG elements were disabled when the list and clustered list views were tested. The visual forms used for the GKG view (information boxes) were exactly as presented by Google for each query. Since Google’s search results and visual forms were used, the ads that were inherently presented on a Google SERP for a specific query were also included in the three views used in our study.
4.3. The Google extension (add-on)
To enable the use of clustering on Google search engine results and present the search results in real time according to the relevant view, a Google extension (add-on) was developed and published on the Google Chrome extensions store. Before the SERP reached the user, it was redesigned based on the viewing format (list, GKG, or clustered list) using DOM (Document Object Model). To ensure that the new SERP design (i.e., the clustering addition) was identical to Google’s familiar SERP design, CSS3 (cascading style sheets used to format Web page layout) was used. The users could switch easily between views using the extension button, which appeared on the Chrome browser toolbar (see ). The code ran continuously in the background and updated the page even when it was not fully loaded, given Google’s use of AJAX technology.
Figure 3. Google extension icon which enabled switching between the views.
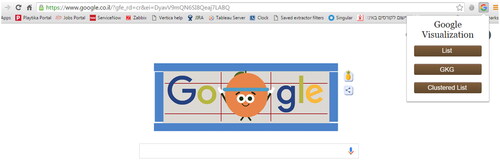
The add-on was developed using JavaScript, as it is a Google extension language. We used the clusters generated by Google for each query, by analyzing the website’s JavaScript and HTML elements, such as < div > tags. Note that Google search results clustering algorithm is proprietary. However, recent research by Google highlights their advancements in this area using embedding and cross-attention models (Ahmadian & Kazemi, Citation2023). Participants were entirely unaware of the process of incorporating clustering into the SERP and saw only the final clustered list view. shows the clustered list view presented to participants. After clicking on a specific cluster, the relevant list of results is presented. The list for the first cluster is presented as a default.
Participants were required to answer 30 questions by inserting search queries into the Google search engine. The questions were presented using SurveyGizmo, a tool for creating Web surveys that enabled us to record participants’ answers directly into one CSV file. This tool also allowed us to shuffle the questions. In addition, Camtasia software was installed on all lab computers to record videos of the experiment. Participants worked in an incognito mode, so no biases would derive from search history and saved cookies.
4.4. Procedure
The study took place in a computer lab in sessions of approximately one hour per participant. Before starting, the participant signed an informed consent form and completed a demographic questionnaire. Then, they received a brief explanation regarding the study’s goals and a demonstration showing them how to use the add-on and navigate between views, how to perform tasks using each view (including browsing between and within clusters when using the clustered list view), and how to provide an answer in the box designated for answers. Participants were instructed to answer the questions as accurately and quickly as possible and were told that they would be evaluated on both their effectiveness and efficiency in answering the questions.
Each participant received three sets of questions (one per viewing format). Each set consisted of 10 questions – two for each of the five task types (a total of 30 questions). The participants’ task was to answer the questions in each set, using the Google search engine, while the SERP was adjusted to the relevant view for the specific set. Participants were instructed to use only this view to answer the set’s questions. Furthermore, they were instructed to use the information boxes when the GKG view was presented. They were specifically told that this would be verified through the recorded videos of the experiment. It was also explained that if it was found that they had not used the relevant view for the specific set, their results could not be included in the research results. At the beginning of each set, a page introducing the relevant viewing format was presented which included a reminder to change the extension button to the relevant view using the Chrome extension button (). Then, the questions for the specific view were presented; each question appeared on a single screen which also included the query and an answer box. Participants were instructed to perform the task by copying the answer from the SERP to the answer box. The videos were analyzed to verify that the participants used the relevant view when performing the tasks. SurveyGizmo recorded the time elapsed from the moment the screen with the new question appeared until the moment the participant finished answering the question and clicked the “next” button.
In order to avoid bias deriving from the way the queries were phrased (potentially leading to different SERPs) and enable the creation of the proper clusters in advance, the participants were asked to copy the predefined queries “as is” and paste them into the search engine search box. contains an example of an assignment of the questions and queries for each task type when using the different views.
Table 1. An example of the assignment of the questions and queries for each task type when using the different views.
Afterwards, participants completed a user satisfaction questionnaire, rating (using a Likert scale from one to 10) their level of satisfaction for each viewing format when performing each search task type. The locate and acquire tasks were considered as two different tasks; therefore, the user satisfaction questionnaire included 18 items to rate.
Participants were then debriefed and answered several questions regarding the questionnaire’s comprehensibility, representativeness of the tasks to the participant’s everyday search tasks, and the participant’s prior familiarity with search engines, GKG, and clustered list views. Users were also asked for their feedback and suggestions for improving the search process.
4.5. Design
A within-subjects counterbalanced design was used in this experiment. Each participant was asked to perform each of the five task types (navigate, find-simple, find-complex, locate/acquire, explore/learn) using each of the three viewing formats (list, GKG, clustered list). For each task type, participants had to answer two questions representing the task type. Therefore, all together each participant answered 30 questions. The views’ order was counterbalanced across participants. In addition, in each view, the order of the five task types and the order of two queries in each task type were randomized. The cluster number in which the correct answer could be found was uniformly distributed across the 10 questions answered by each participant when the clustered list view was presented. In addition, the order of the clusters in which the correct answer to the different questions could be found was randomized across participants.
5. Results
5.1. Data preprocessing
Before performing the statistical analysis, the following preprocessing took place:
Removing multiple records – using SurveyGizmo, a new record in the data file was created when a participant pressed the “back” button to go to the previous question. In these cases, the multiple records needed to be consolidated into a single record per participant by adding the times and combining the textual answers.
Completion of missing values – backup videos were used.
Handling anomalies – adjustments were made for extreme values (e.g., cases in which participants asked a question during the experiment while the clock was running, which resulted in a significantly longer performance time than other records (over three standard deviations from the mean). Those events were documented by the experimenter and validated by watching the videos; the idle time was deducted from the total time and the resulting value was used.
In addition, participants’ answers were reviewed manually and assigned a binary score of one (correct answer) or zero (incorrect answer).
5.2. Effectiveness analysis
The effectiveness measure was the proportion of correct answers provided by the participants to each question in each task type when using each view. The participants’ answers were evaluated by two experimenters after formulating clear guidelines regarding what constitutes a correct answer. There was absolute agreement between the experimenters in the scores for the participants’ answers.
The effectiveness analysis was conducted using Cochran’s Q test for nonparametric multiple proportions, which is an extension to the McNemar test for related samples that enables testing for differences between three or more matched sets of frequencies or proportions (Medcalc, Citation2018). The fact that the samples in our study were related, and the data were binary (succeeded or failed to answer the question) warranted the use of Cochran’s Q test for comparing the dependent proportions of correct answers provided by the participants to each of the two questions for each task type using each view. The dependent variable was the proportion of correct answers for each question, and the questions were the independent variable. The null hypothesis is that there are no significant differences among the proportions of correct answers provided by the participants to each question for each task type when using each view (i.e., the views presented are equally effective for each of the tasks and across tasks). The alternative hypothesis is that there is a significant difference among the proportions of correct answers provided while answering the questions for each task type when using each view.
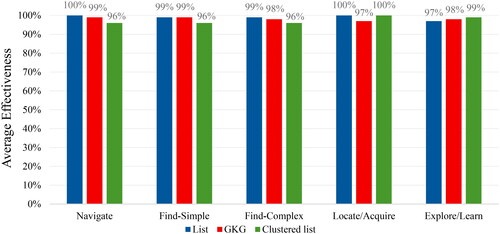
The results of the analysis indicated that there were no significant differences among the proportions of correct answers (Q = 41.134, df = 29, p = 0.067) for each of the 30 questions. presents the average effectiveness (over the two questions) for each of the five task types when using each of the three views. The figure demonstrates that the differences between the average effectiveness for each task type when using each view are negligible and range between 96% to 100%. The overall average effectiveness was 98.3%. As no significant differences were found, we could not reject the null hypotheses that the views are equally effective for each of the tasks and across tasks.
Figure 4. Average effectiveness for each task using each view.
5.3. Efficiency analysis
The efficiency measure was the time elapsed (in seconds) from the moment the question was presented to the participant until the moment the participant provided an answer and clicked the “next” button to move on to the next question (also defined as the performance time). Performing the task efficiently would require providing a correct answer and providing this answer in a reasonable time. Faster completion while maintaining accuracy reflects efficient performance. Therefore, only tasks that were answered correctly were included in the efficiency analysis.
A four-way repeated measures ANOVA was performed to investigate the effect of the viewing format, task type, question in each task (1, 2), and participant’s gender. The dependent variable was the performance time for each question. The viewing format, task type, and question were within-participant independent variables, while the participant’s gender was a between-participants independent variable.
This analysis showed that the main effect of the question was significant (F(1,56)=14.020, p < 0.0005); therefore, there was a significant difference between the two questions. Further investigation using Duncan’s post-hoc test indicated that the significant differences (p < 0.0001) between the two questions were only found in the locate/acquire task (i.e., between the locate and acquire questions). Therefore, this task was split into two separate and independent tasks: locate and acquire. To confirm that there were not significant differences among the other questions, a four-way repeated measures ANOVA was conducted for the other four tasks. The results indicated that the main effect of the question was not significant (F(1,56)=0.006, p = 0.939). In addition, the two-way interactions of View X Question (F(2,112)=1.174, p = 0.313), Task X Question (F(3,168)=0.135, p = 0.939), and Gender X Question (F(1,56)=0.126, p = 0.724) were not significant. The three-way interactions of the View X Question X Gender (F(2,112)=2.768, p = 0.067), the Task X Question X Gender (F(3,168)=0.691, p = 0.559), and the View X Task X Question (F(6,336)=1.159, p = 0.328) were also not significant; nor was the four-way interaction of the View X Task X Question X Gender (F(6,336)=1.193, p = 0.309). In conclusion, the effect of the question was not significant, either as the main effect or as a component in any of the interactions. The absence of statistically significant variances in performance times between the two questions within each search task using each view guarantees that any efficiency effects observed when employing the average performance time for each task as the dependent variable are not confounded by differences between the two questions within each task.
Therefore, the efficiency measure used for further analysis was the average task completion performance time for the two questions for each of the four tasks (navigate, find-simple, find-complex, and explore/learn) and the performance time for the locate and acquire tasks. A three-way ANOVA with repeated measures was conducted. The dependent variable was the average performance time for each task. The viewing format (list, GKG, clustered list) and task type (navigate, find-simple, find-complex, locate, acquire, and explore/learn) were the within-participant independent variables, while the participant’s gender was a between-participants independent variable.
The results showed that the main effects of the viewing format (F(2,112)=20.458, p < 0.0001) and task type (F(5,280)= 237.435, p < 0.0001) were significant. The two-way interaction of View X Task (F(10, 560)=24.980, p < 0.0001) was also significant. The insignificant effects were the main effect of gender (F(1, 56)=1.437, p = 0.236), the two-way interactions of View X Gender (F(2, 112)=1.646, p = 0.197), and Task X Gender (F(5, 280)=0.235, p = 0.947), and the three-way interaction of View X Task X Gender (F(10, 560)=0.679, p = 0.744). The average performance times (and standard deviations) for each task when using each view are presented in and illustrated in . The task with the longest performance times (i.e., lowest efficiency) when using each view was the find-complex task (this result was expected, as this task necessitated more in-depth reading and examination of the results), while the navigate task had the shortest performance times (i.e., highest efficiency). In the navigate task, participants were requested to provide the URL of a specific website, an easy task performed daily by Web users, resulting in high performance.
Figure 5. Average performance times for each task when using each view (vertical bars denote 0.95 confidence intervals).
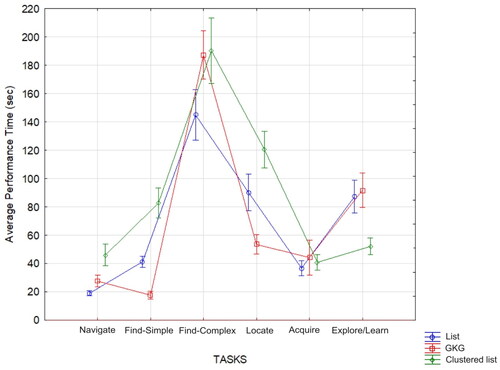
Table 2. Average (SD) performance times (sec) for each task when using each view. The % represents the difference between the view in a specific row and the most efficient view (background highlighted) for each task type.
To support or reject the research hypotheses regarding efficiency, a Duncan post-hoc test was conducted to compare the performance times for the three views when performing each task type (a lower performance time indicates better performance). For the navigate task, the hypothesis was partially supported; the list view resulted in the greatest efficiency, although not significantly different from the GKG view (p = 0.062), and the clustered list view was significantly less efficient compared to the list (p > 0.0001) and GKG (p = 0.020) views. For the find-simple task, the hypothesis was supported; the GKG view was significantly better than the list (p < 0.0005) and clustered list (p < 0.0001), and the list was significantly more efficient than the clustered list (p < 0.0001). For the find-complex task, the hypothesis was supported as well; the list was significantly better than the GKG (p < 0.0001) and clustered list (p < 0.0001), and the GKG was not significantly more efficient than the clustered list (p = 0.981). For the locate task, the hypothesis was supported; the GKG was found to be superior to the list (p < 0.0001) and clustered list (p < 0.0001), and the list was significantly more efficient than the clustered list (p < 0.0001). For the acquire task, the hypothesis was partially supported as the list had the lowest performance times, however not significantly different from the GKG (p = 0.142) and clustered list (p = 0.474) views; the GKG was not significantly more efficient than the clustered list (p = 0.396). Finally, for the explore/learn task, as hypothesized, the clustered list was the most efficient view compared to the list (p < 0.0001) and GKG (p < 0. 0001); the list was not significantly more efficient than the GKG (p = 0.953).
5.4. User satisfaction analysis
Participants’ level of satisfaction for each view when performing the search tasks was measured on a Likert scale from one to 10, where one indicates very low satisfaction and 10 indicates very high satisfaction. A three-way ANOVA with repeated measures was conducted to examine the effects of the viewing format, task type, and participant’s gender on user satisfaction. The dependent variable was the user’s level of satisfaction. The viewing format and task type were the within-participant independent variables, while the participant’s gender was a between-participants independent variable.
The results showed that the main effects of the viewing format (F(2,112)=3.99, p = 0.021) and task type (F(5,280)=10.6, p < 0.0001) were significant. The two-way interaction of View X Task (F(10, 560)=55.38, p < 0.0001) was also significant. The insignificant effects were the main effect of gender (F(1, 56)= 1.09, p = 0.301), the two-way interactions of View X Gender (F(2, 112)=0.85, p = 0.43), and Task X Gender (F(5, 280)=0.5, p = 0.779), and the three-way interaction of View X Task X Gender (F(10, 560)=0.76, p = 0.672). presents satisfaction levels as a function of the task and viewing format.
Figure 6. The level of satisfaction as a function of the task type and viewing format (vertical bars denote 0.95 confidence intervals).
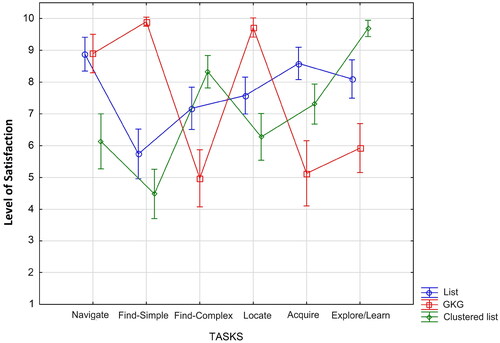
To test the research hypotheses regarding user satisfaction, a Duncan post-hoc test was conducted to compare the satisfaction level among the three views when performing each task type. For the navigate task, the hypothesis was partially supported; the GKG and list views resulted in the highest user satisfaction and were not significantly different from each other (p = 0.91), however, the clustered list was significantly less preferred than both the list (p < 0.0001), and GKG (p < 0.0001). For the find-simple task, the hypothesis was supported; the GKG was rated significantly higher than the list (p < 0.0001) and clustered list (p < 0.0001), and the list was significantly more preferred than the clustered list (p < 0.001). For the find-complex task, the hypothesis was rejected; the clustered list led to the highest user satisfaction, significantly better than the list (p < 0.0001) and GKG (p < 0.0001), and the list was significantly more preferred than the GKG (p < 0.0001). For the locate task, the hypothesis was supported; the GKG was superior to the list (p < 0.0001) and clustered list (p < 0.0001), and the list was significantly more preferred than the clustered list (p < 0.01). For the acquire task, the hypothesis was supported, as the list was found to be the best viewing format in terms of user satisfaction compared to the GKG (p < 0.0001) and clustered list (p < 0.01); the clustered list was significantly more preferred than the GKG (p < 0.0001). Finally, for the explore/learn task, the clustered list was found to be the best viewing format compared to the list (p < 0.0001) and GKG (p < 0.0001); the list was significantly more preferred than the GKG (p < 0.0001).
The results of the debriefing showed that tasks performed in the experiment were clear (avg ± SD = 9.4 ± 0.99) and similar to participants’ everyday search tasks (avg ± SD = 7.4 ± 2.51). The vast majority of the participants were familiar with the GKG view before the experiment, but only 3% were familiar with search engines using the clustered list view. The following are representative responses for different tasks. For the navigate task: “When we were required to provide a website’s address (URL), it could be easily found using the list view, since in this case the required URL could almost always be found in the first search result at the top of the list.” Comments regarding the find-simple task were: “The GKG was very easy for finding addresses, temperature, and simple questions”; “I could find the answers to the find-simple task questions immediately from the information box at the top of the SERP.” With respect to the explore/learn task: “the clusters were very useful for the specific task of learning and exploration”; “When the search query had multiple potential interpretations, the clustered list view groups the results by meaning (clusters). This allows you to choose the relevant cluster and explore the specific aspect you’re interested in”; “When searching for subfields within a broader topic, each cluster in the clustered list view typically represents a different subfield. This makes it easy to identify and delve into the specific field you need.” Concerning the acquire task participants noted that: “I could quickly scan the list and find several options for buying the product.”
6. Discussion
In light of the growing need to rapidly extract information from SERPs and the increasing complexities of users’ queries, different SERP viewing formats have been developed over the years. The clustered list view addresses the increasing complexity of users’ queries by organizing the vast amount of information in a logical and structured way. The GKG view responds to users’ need to obtain the desired data rapidly by presenting the relevant information directly on the SERPs, eliminating the need to click on results and browse through Web pages to find the desired information. This study investigated the effect of the GKG viewing format on user performance and satisfaction compared to the traditional list and clustered list views. Since prior research showed that user performance is affected by task type (e.g., Zamir & Etzioni, Citation1999), we examined the effects of the viewing formats when performing five common task types defined in past research (Russell et al., Citation2009). The Google search engine was used, and a Google Chrome extension was developed to enable clustering of Google search results and unbiased comparison of the viewing formats using the same search engine results and interface.
The results indicated that the viewing format resulting in the greatest efficiency and user satisfaction varied depending on the search task type. In contrast, user effectiveness was very high for all tasks using all views, and therefore, there were not significant differences among the viewing formats for this measure. The results of this research are consistent with the conclusion of Zamir and Etzioni (Citation1999) that users might prefer a clustering interface for complex tasks in which several documents are required; the more documents followed by the user, the more their clustering interface tended to be more efficient in search time and click distance. This point was reinforced during the participants’ debriefing in our study, as participants indicated that complex tasks that required multiple sources were easier to address with the clustered list viewing format. These results are also consistent with previous studies (Dumais et al., Citation2001; Egan et al., Citation1989) showing that categorizing results in online search interfaces can help users find relevant results more quickly and accurately. Our results also support the work of Cutrell and Guan (Citation2007), which showed that adding more information to the search result summary significantly improved the performance of complex information tasks but was unnecessary for navigational tasks as it might distract the searcher. Our results also support the findings of Hoeber (Citation2014) who found that current search engine interfaces work well for highly targeted search tasks such as fact verification (e.g., simple and navigate tasks), while their ability to support complex search activities such as disambiguation and exploration is limited. It was further concluded that the “one size fits all” approach of providing a simple query box and search results list provides limited support for the complexity of search tasks beyond simple fact verification.
6.1. Effectiveness
The results of the effectiveness analysis showed that all three views led to very high effectiveness (overall average of 98%) when performing all tasks, with no significant differences among the viewing formats. Therefore, our study did not find sufficient evidence to reject the null hypotheses regarding the equal effectiveness of the viewing formats for each of the five tasks. This high effectiveness likely stems from the high quality and relevance of the Google search engine’s results. When the participants obtained an answer, they were correct in the vast majority of cases. In the select cases where effectiveness was compromised, it was typically due to a few users failing to find the answer at all.
6.2. Efficiency
The results of the efficiency analysis indicated that there was no one superior viewing format that led to the greatest efficiency for all search tasks. Each search task has its own characteristics, and therefore, a different view may be more suitable for a specific task than other tasks.
Our results showed that the views leading to the best results in the navigate task were the list and GKG views. A possible explanation might be that the navigate task is a fairly simple task where the relevant answer usually appears as the first result on the list. In contrast to our hypothesis, the GKG view was not found to be significantly more efficient than the list view. In the list view, participants quickly found the relevant answer at the top of the list, beside the website logo. Even if the link to the relevant answer appeared after sponsored links and commercial content, users disregarded these advertisements and identified the appropriate result. The GKG view prominently appeared at the beginning of the page alongside the list of search results and the relevant answer (the URL of a website) could be found at the top of the knowledge panel, just below the website logo. As for the acquire task, no significant differences were found among the views in terms of efficiency. Thus, our hypothesis that using the list view would lead to the greatest efficiency when performing the acquire task was rejected. This may stem from the fact that when using the clustered list view for the acquire task, the cluster which included the URL of the relevant site where the product could be purchased was very distinctive and there was no need to browse and switch between the clusters as was required for the explore/learn task.
As hypothesized, the list view led to significantly greater efficiency than the GKG and clustered list views in the find-complex task. This can be explained by the fact that this task is too complex for the GKG (and therefore even if the GKG is presented, it provides a partial answer to the question) and too simple for the clustered list view, as the answer was obtained from a single document on the list. Also, as hypothesized, the GKG view resulted in the greatest efficiency in the find-simple and locate tasks. Those two tasks are compatible with the GKG viewing format’s characteristics, as the queries were related to entities and required the extraction of specific pieces of information. These results are aligned with the work of Guha et al. (Citation2003), which described how an understanding of the search terms’ semantics can be used to provide better results.
The clustered list view led to the greatest efficiency in the explore/learn task, thus supporting our hypothesis. This task required examining sets of websites (i.e., a single search result might be insufficient), and therefore the clustered list view is suitable for this case. This result is consistent with the research of Carpineto et al. (Citation2009a), which found that mobile clustering engines can be faster and more accurate than the corresponding mobile search engines, especially for multi-topic retrieval tasks. Alasmari and Zhou (Citation2017) aimed to improve cluster-based mobile web search by proposing cluster visualization and presentation synchronization. Their findings showed that radial visualization improves search efficiency and navigation efficiency, particularly for open-ended tasks.
6.3. User satisfaction
User satisfaction was an approximate reflection of user efficiency. For each of the five search task types, the views that resulted in low performance times (i.e., high efficiency) resulted in higher user satisfaction values. The only exception was the find-complex task in which the clustered list view resulted in the highest satisfaction (as opposed to the list view, which was found to have the greatest efficiency, as hypothesized). A possible explanation for the clustered list view preference when performing the find-complex task, regardless of the increase in performance time, might be that users prefer that the vast amount of information be organized in a logical and structured way. Naturally, browsing within and between the clusters takes more time, resulting in lower efficiency. In addition, the clustered list view resulted in the highest user satisfaction in the explore/learn task. The results indicate that the list view led to the highest user satisfaction in the acquire and navigate (together with the GKG view) tasks, while the GKG view led to the highest user satisfaction in the find-simple and locate tasks. Reviewing the information provided by participants during debriefing revealed the same trend: the GKG viewing format was preferred in simple search tasks such as finding a piece of information (e.g., an address), and the clustered list view, which was confusing for simple tasks, was preferred for complex tasks.
6.4. Gender
The effect of the participant’s gender on search efficiency and user satisfaction was not significant, either as the main effect or as a component in any of the interactions with other variables. While many factors have been found to influence Web search behaviors and performance, gender differences are inconclusive. Hargittai and Shafer (Citation2006) assessed adults on a variety of online search tasks and found that overall men and women do not differ significantly in their abilities to find various types of information online; however, consistent with Correll (Citation2001) and Zhou (Citation2014), gender effects appeared to be significant for self-perceived skill levels. Gender differences in performance were also absent according to self-reported search behaviors (Hupfer & Detlor, Citation2006). Chen (Citation2020) found that there were no significant differences between male and female participants in their reading or search strategies. In contrast, Roy et al. (Citation2003) explored gender differences in the Web search behavior of middle school students and found that when using the Web for an identical search task, boys performed significantly better than girls on both target-specific information (i.e., information they were specifically prompted to find) and target-related information (i.e., information that was related to the target topic but was not specifically prompted to find). Roy and Chi (Citation2003) further described differences in how boys and girls orchestrated individual search behaviors to result in different overall search patterns. Boys tended to oscillate between submitting searches and scanning the document excerpts returned as search results (horizontal searchers). Conversely, girls tended to actually open and browse entire linked documents (vertical searchers) without going through a preliminary filtering step of scanning. Their correlation analysis shows that this pattern of variability was responsible for the different performance outcomes. Additional studies (Large et al., Citation2002; Danaher et al., Citation2006) also demonstrated that males are less thorough processors than females and that females tend to spend more time than males examining website content. Yet, in the study of Roy et al. (Citation2003), girls’ more thorough and detailed perusal of their search results offered no advantage compared to the knowledge boys gleaned by hurriedly scanning their more pertinent search output.
6.5. Guidelines for task-type dependent viewing formats
Based on our results, we have formulated specific recommendations for implementing task-type dependent viewing formats in practice. We provide suggestions as to how search engines can tailor their SERP viewing formats based on the user’s search task. These recommendations aim to optimize the user experience and improve search efficiency by aligning the viewing formats with the specific characteristics and goals of different search tasks. The following are our guidelines for task-type dependent views:
Navigate: The list or GKG views are recommended. The list view facilitates rapid scanning and identification of relevant answers, especially when the desired information is typically found at the top of search results. Therefore, the list view resulted in the highest efficiency (with the smallest standard deviation) though its efficiency was not significantly different from that of the GKG view.
Find-Simple: The GKG view is highly recommended, as it expedites the rapid extraction and grasp of specific information, which is particularly beneficial for tasks involving entity-based queries or the retrieval of precise data. Users expressed greater satisfaction with the GKG view, which aligns with its simplicity and straightforward access to data, than the other two viewing formats.
Find-Complex: Prioritize the list view for complex search tasks where the answer may not be straightforward and requires deeper exploration. This format allows users to efficiently scan through a large amount of information to find relevant details. While the list view is highly efficient, the clustered list view results in greater user satisfaction, possibly because users appreciate the structured organization of vast information despite slightly lower efficiency.
Locate: The GKG view is highly recommended, as it facilitates rapid comprehension and extraction of specific information, especially for tasks involving entity-based queries. The visual representation of entities and their relationships (usually using a 2D map) can facilitate quick comprehension and extraction of relevant details.
Acquire: The list view emerged as the preferred option in terms of user satisfaction for the acquire task. While efficiency did not differ significantly among the viewing formats, the list viewing format was found to be most satisfactory for users. The list view may be preferred for the acquire task due to its straightforward presentation of search results. Users can quickly scan through a linear list of items, facilitating their decision-making process.
Explore/Learn: Utilize the clustered list view for tasks involving the exploration of multiple documents or sources. This format helps users navigate through different clusters of information, enabling efficient exploration and learning across various topics. The clustered list view is especially suitable for multi-topic retrieval tasks and queries involving language ambiguity. Users show greater satisfaction with the clustered list view, appreciating the organized presentation of information despite requiring more time for browsing within and between clusters.
6.6. Study limitations
The study had few limitations that warrant discussion and consideration. First, the participants in our user study had a rather homogeneous professional technological background; thus, it would be worthwhile conducting a follow-up experiment to examine whether the results of this study are consistent among different age groups and people with different search experiences and proficiency. However, we believe this lack of diversity had at most a negligible effect on the results, as the tasks were relatively simple for search engine users. As significant differences in user efficiency and satisfaction were found among our homogenous, experienced group, it is reasonable to assume that significant differences will also be found among less experienced users, but future research could confirm this. There was also potential bias stemming from the fact that the participants could use their prior knowledge to answer the queries. To overcome this bias, participants were required to provide full answers, and the videos were reviewed to ensure that participants were browsing the Web before answering.
Additionally, as the users were interacting with the clustered list view on a well-known search engine for the first time, we assume that there was a learning curve in adapting to the new viewing format which could have impacted user efficiency slightly. This was controlled by the random order of the presentation of the viewing formats and the demonstration provided before the experiment. In addition, for the clustered list view, we used the folder-tree display, which is based on the predominant hierarchical folders approach familiar to most computer users. It is reasonable to assume that once users adapt to the new clustered list view in the Google SERP, efficiency and satisfaction will improve when performing complex tasks.
7. Conclusion and future work
In summary, our findings suggest that identifying user task type before presenting search results can optimize user performance and satisfaction. By presenting results using specific viewing formats tailored to each task type, users could find the information they need more efficiently, leading to an enhanced overall search experience. In the future, this principle could be implemented by developing a real-time classification tool that identifies the task type and responds by presenting the results using the most appropriate viewing format. As the number of web search users and daily searches continues to rise, improving user efficiency and satisfaction is essential. Such a tool should be implemented carefully, aiming to minimize the cognitive load on users and preserve the consistency of the interface design when presenting different views. Moreover, as the GKG continues to evolve and new features are added, there will be a need to explore and evaluate new GKG viewing formats and compare them with existing ones, such as list and clustered list formats. Future research could also investigate other potential benefits of task-specific views, such as improved result relevance or increased user confidence in the results. By prioritizing user-centric design and responsiveness to search behavior, we can contribute to ongoing advancements in search engine technology, ultimately providing users with more effective and satisfying search experiences.
Disclosure statement
No potential conflict of interest was reported by the author(s).
Additional information
Notes on contributors
Meirav Taieb-Maimon
Meirav Taieb-Maimon is a senior faculty member in the Department of Software and Information Systems Engineering at Ben-Gurion University of the Negev, Israel. She specializes in human factors, human-computer interaction, information visualization, design and analysis of experiments, and evaluation of information systems, interfaces, and visual analytics systems.
Hadas Harush
Hadas Harush holds a BSc in Industrial Engineering & Management from Tel-Aviv University, focused on Information Systems, and an MSc in Software and Information Systems Engineering, focused on Data Mining and Business Intelligence, from Ben-Gurion University of the Negev. She is currently a group product manager at Booking.com.
References
- Agarwal, M. K., & Sahu, T. (2021). Lookup or exploratory: What is your search intent?. arXiv preprint arXiv:2110.04640
- Ahmadian, S., Kazemi, M. (2023, November 3). Best of both worlds: Achieving scalability and quality in text clustering. Google Research. Retrieved March 15, 2024, from https://blog.research.google/2023/11/best-of-both-worlds-achieving.html/
- Akinnubi, A., & Ajiboye, J. (2023). Knowledge graph: A survey. The International Journal of Robotics Research, 4(2), 366–377. https://doi.org/10.36227/techrxiv.22813967.v1
- Alasmari, A., & Zhou, L. (2017). The effects of visualization and synchronization on clustered-based mobile web search. International Journal of Human–Computer Interaction, 33(6), 431–442. https://doi.org/10.1080/10447318.2017.1278894
- Andrews, K., Gutl, C., Moser, J., Sabol, V., & Lackner, W. (2001, May). Search result visualisation with xfind [Paper presentation]. Proceedings Second International Workshop on User Interfaces in Data Intensive Systems. UIDIS 2001 (pp. 50–58). IEEE.
- Baldonado, M. Q. W., & Winograd, T. (1998, January). Hi-cites: Dynamically created citations with active highlighting [Paper presentation]. Proceedings of the SIGCHI Conference on Human Factors in Computing Systems (pp. 408–415). https://doi.org/10.1145/274644.274700
- Broder, A. (2002, September). A taxonomy of web search. In ACM SIGIR Forum (Vol. 36, pp. 3–10). ACM. https://doi.org/10.1145/792550.792552
- Carpineto, C., Romano, G., & Bordoni, F. U. (2004). Exploiting the potential of concept lattices for information retrieval with CREDO. Journal of Universal Computer Science, 10(8), 985–1013.
- Carpineto, C., Mizzaro, S., Romano, G., & Snidero, M. (2009a). Mobile information retrieval with search results clustering: Prototypes and evaluations. Journal of the American Society for Information Science and Technology, 60(5), 877–895. https://doi.org/10.1002/asi.21036
- Carpineto, C., Osiński, S., Romano, G., & Weiss, D. (2009b). A survey of web clustering engines. ACM Computing Surveys, 41(3), 1–38. https://doi.org/10.1145/1541880.1541884
- Cellary, W., Wiza, W., & Walczak, K. (2004). Visualizing web search results in 3D. Computer Magazine, 37(5), 87–89. https://doi.org/10.1109/MC.2004.1297255
- Chen, K. T. C. (2020). Searching strategies and reading strategies for English E-journal articles used by EFL graduate students. Education and Information Technologies, 25(2), 665–680. https://doi.org/10.1007/s10639-019-10007-3
- Chua, C. (2012, November). A user interface guide for web search systems [Paper presentation]. Proceedings of the 24th Australian Computer-Human Interaction Conference (pp. 76–84). https://doi.org/10.1145/2414536.2414549
- Clarke, C. L., Agichtein, E., Dumais, S., & White, R. W. (2007, July). The influence of caption features on clickthrough patterns in web search [Paper presentation]. Proceedings of the 30th Annual International ACM SIGIR Conference on Research and Development in Information Retrieval (pp. 135–142). https://doi.org/10.1145/1277741.1277767
- Correll, S. J. (2001). Gender and the career choice process: The role of biased self-assessments. American Journal of Sociology, 106(6), 1691–1730. https://doi.org/10.1086/321299
- Cutrell, E., & Guan, Z. (2007, April). What are you looking for? An eye-tracking study of information usage in web search. In Proceedings of the SIGCHI Conference on Human Factors in Computing Systems (pp. 407–416).
- Cutting, D. R., Karger, D. R., Pedersen, J. O., & Tukey, J. W. (1992, June). Scatter/Gather: A cluster-based approach to browsing large document collections [Paper presentation]. Proceedings of the 15th Annual International ACM SIGIR Conference on Research and Development in Information Retrieval (pp. 318–329). https://doi.org/10.1145/133160.133214
- Danaher, P. J., Mullarkey, G. W., & Essegaier, S. (2006). Factors affecting web site visit duration: A cross-domain analysis. Journal of Marketing Research, 43(2), 182–194. https://doi.org/10.1509/jmkr.43.2.182
- Dame, N. (2015, February 27). Search engine land - What can businesses do about the knowledge graph dominating search results? http://searchengineland.com/businesses-knowledge-graph-dominating-search-results-215520.
- Deng, Y., Zhang, W., Xu, W., Shen, Y., & Lam, W. (2023). Nonfactoid question answering as query-focused summarization with graph-enhanced multihop inference. IEEE Transactions on Neural Networks and Learning Systems, 1–15. https://doi.org/10.1109/TNNLS.2023.3258413
- Dumais, S., Cutrell, E., & Chen, H. (2001, March). Optimizing search by showing results in context [Paper presentation]. Proceedings of the SIGCHI conference on Human Factors in Computing Systems (pp. 277–284). https://doi.org/10.1145/365024.365116
- Egan, D. E., Remde, J. R., Gomez, L. M., Landauer, T. K., Eberhardt, J., & Lochbaum, C. C. (1989). Formative design evaluation of superbook. ACM Transactions on Information Systems, 7(1), 30–57. https://doi.org/10.1145/64789.64790
- Ferragina, P., & Gulli, A. (2008). A personalized search engine based on web-snippet hierarchical clustering. Software: Practice and Experience, 38(2), 189–225. https://doi.org/10.1002/spe.829
- Guha, R., McCool, R., & Miller, E. (2003, May). Semantic search [Paper presentation]. Proceedings of the 12th International Conference on World Wide Web (pp. 700–709). https://doi.org/10.1145/775152.775250
- Hargittai, E., & Shafer, S. (2006). Differences in actual and perceived online skills: The role of gender. Social Science Quarterly, 87(2), 432–448. https://doi.org/10.1111/j.1540-6237.2006.00389.x
- Hearst, M. (2009). Search user interfaces. Cambridge University Press.
- Herman, I. (2009, November 12). W3C semantic web frequently asked questions. http://www.w3.org/2001/sw/SW-FAQ#swgoals.
- Hoeber, O. (2014. March). Visual search analytics: Combining machine learning and interactive visualization to support human-centred search [Paper presentation]. MindTheGap@ iConference (pp. 37–43).
- Hoeber, O. (2018, March). Information visualization for interactive information retrieval [Paper presentation]. Proceedings of the 2018 Conference on Human Information Interaction & Retrieval (pp. 371–374). https://doi.org/10.1145/3176349.3176898
- Hoeber, O., & Yang, X. D. (2006, December). A comparative user study of web search interfaces: HotMap, Concept Highlighter, and Google [Paper presentation]. 2006 IEEE/WIC/ACM International Conference on Web Intelligence (WI 2006 Main Conference Proceedings) (WI'06) (pp. 866–874). IEEE. https://doi.org/10.1109/WI.2006.6
- Hoeber, O., & Yang, X. D. (2009). HotMap: Supporting visual exploration of Web search results. Journal of the American Society for Information Science and Technology, 60(1), 90–110. https://doi.org/10.1002/asi.20957
- Hupfer, M. E., & Detlor, B. (2006). Gender and web information seeking: A self‐concept orientation model. Journal of the American Society for Information Science and Technology, 57(8), 1105–1115. https://doi.org/10.1002/asi.20379
- Keikha, M., Park, J. H., & Croft, W. B. (2014)., July). Evaluating answer passages using summarization measures [Paper presentation]. Proceedings of the 37th International ACM SIGIR Conference on Research & Development in Information Retrieval (pp. 963–966). https://doi.org/10.1145/2600428.2609485
- Kellar, M., Watters, C., & Shepherd, M. (2007). A field study characterizing web‐based information‐seeking tasks. Journal of the American Society for Information Science and Technology, 58(7), 999–1018. https://doi.org/10.1002/asi.20590
- Kim, J. (2006). Task as a predictable indicator of information seeking behavior on the Web. Rutgers The State University of New Jersey - New Brunswick.
- Koshman, S., Spink, A., & Jansen, B. J. (2006). Web searching on the Vivisimo search engine. Journal of the American Society for Information Science and Technology, 57(14), 1875–1887. https://doi.org/10.1002/asi.20408
- Lagun, D., Hsieh, C. H., Webster, D., & Navalpakkam, V. (2014, July). Towards better measurement of attention and satisfaction in mobile search. In Proceedings of the 37th International ACM SIGIR Conference on Research & Development in Information Retrieval (pp. 113–122). https://doi.org/10.1145/2600428.2609631
- Large, A., Beheshti, J., & Rahman, T. (2002). Gender differences in collaborative web searching behavior: An elementary school study. Information Processing & Management, 38(3), 427–443. https://doi.org/10.1016/S0306-4573(01)00034-6
- Lewandowski, D., Drechsler, J., & Von Mach, S. (2012). Deriving query intents from web search engine queries. Journal of the American Society for Information Science and Technology, 63(9), 1773–1788. https://doi.org/10.1002/asi.22706
- Li, W., Wang, S., Chen, X., Tian, Y., Gu, Z., Lopez-Carr, A., Schroeder, A., Currier, K., Schildhauer, M., & Zhu, R. (2023). Geographvis: A knowledge graph and geovisualization empowered cyberinfrastructure to support disaster response and humanitarian aid. ISPRS International Journal of Geo-Information, 12(3), 112. https://doi.org/10.3390/ijgi12030112
- Li, Y., Zhao, J., Yang, L., & Zhang, Y. (2019, March). Construction, visualization and application of knowledge graph of computer science major [Paper presentation]. Proceedings of the 2019 International Conference on Big Data and Education (pp. 43–47). https://doi.org/10.1145/3322134.3322153
- Liu, Z., Liu, Y., Zhou, K., Zhang, M., & Ma, S. (2015, August). Influence of vertical result in web search examination [Paper presentation]. Proceedings of the 38th International Acm Sigir Conference on Research and Development in Information Retrieval (pp. 193–202). https://doi.org/10.1145/2766462.2767714
- Liu, Q., Li, Y., Duan, H., Liu, Y., & Qin, Z. (2016). Knowledge graph construction techniques. Journal of Computer Research and Development, 53(3), 582–600. https://doi.org/10.7544/issn1000-1239.2016.20148228
- Lorigo, L., Pan, B., Hembrooke, H., Joachims, T., Granka, L., & Gay, G. (2006). The influence of task and gender on search and evaluation behavior using Google. Information Processing & Management, 42(4), 1123–1131. https://doi.org/10.1016/j.ipm.2005.10.001
- Luo, J., Yao, S., Miao, K., Zhou, S., Feng, Y., & Xu, J. (2022, October). A knowledge graph visualization and retrieval system based on joint extraction model [Paper presentation]. 5th International Conference on Computer Information Science and Application Technology (CISAT 2022) (Vol. 12451, pp, 481–485). SPIE. https://doi.org/10.1117/12.2656590
- Mangles, C. (2018, January 30). Search engine statistics 2018. (Smart Insights). https://www.smartinsights.com/search-engine-marketing/search-engine-statistics/.
- Mann, T. M. (1999, September). Visualization of WWW-search results. In Proceedings of the Tenth International Workshop on Database and Expert Systems Applications. DEXA 99 (pp. 264–268). IEEE. https://doi.org/10.1109/DEXA.1999.795176
- Marchionini, G. (2006). Exploratory search: From finding to understanding. Communications of the ACM, 49(4), 41–46. https://doi.org/10.1145/1121949.1121979
- Mazurek, M., & Waldner, M. (2018). Visualizing expanded query results. Computer Graphics Forum, 37(3), 87–98. https://doi.org/10.1111/cgf.13403
- Medcalc (2018). Cochran’s Q test. https://www.medcalc.org/manual/cochranq.php
- Noy, N., Gao, Y., Jain, A., Narayanan, A., Patterson, A., & Taylor, J. (2019). Industry-scale knowledge graphs: Lessons and challenges: Five diverse technology companies show how it’s done. Queue, 17(2), 48–75. https://doi.org/10.1145/3329781.3332266
- Purcell, K. (2011). Search and email still top the list of most popular online activities. http://www.pewinternet.org/2011/08/09/search-and-email-still-top-the-list-of-most-popular-online-activities/
- Roy, M., & Chi, M. T. (2003). Gender differences in patterns of searching the web. Journal of Educational Computing Research, 29(3), 335–348. https://doi.org/10.2190/7BR8-VXA0-07A7-8AVN
- Roy, M., Taylor, R., & Chi, M. T. (2003). Searching for information on-line and off-line: Gender differences among middle school students. Journal of Educational Computing Research, 29(2), 229–252. https://doi.org/10.2190/KCGA-3197-2V6U-WUTH
- Roy, N., Maxwell, D., & Hauff, C. (2022, July). Users and Contemporary SERPs: A (Re-) Investigation [Paper presentation]. Proceedings of The 45th International ACM SIGIR Conference on Research and Development in Information Retrieval (pp. 2765–2775). https://doi.org/10.1145/3477495.3531719
- Russell, D. M., Tang, D., Kellar, M., & Jeffries, R. (2009, January). Task behaviors during web search: The difficulty of assigning labels. In 2009 42nd Hawaii International Conference on System Sciences (pp. 1–5). IEEE
- Ruthven, I., & Kelly, D. (Eds.). (2011). Interactive information seeking, behaviour and retrieval. Facet Publishing.
- Şendurur, E., & Yildirim, Z. (2015). Students’ web search strategies with different task types: An eye-tracking study. International Journal of Human-Computer Interaction, 31(2), 101–111. https://doi.org/10.1080/10447318.2014.959105
- Shneiderman, B. (1996). The eyes have it: A task by data type taxonomy for information visualization. In Proceedings of IEEE Symposium on Visual Languages (pp. 336–343).
- Shokouhi, M., & Guo, Q. (2015, August). From queries to cards: Re-ranking proactive card recommendations based on reactive search history. In Proceedings of the 38th International ACM SIGIR Conference on Research and Development in Information Retrieval (pp. 695–704).
- Singhal, A. (2012, May 16). Introducing the Knowledge Graph: Things, not strings. https://googleblog.blogspot.co.uk/2012/05/introducing-knowledge-graph-things-not.html
- Toda, H., Kataoka, R., & Oku, M. (2007). Search result clustering using informatively named entities. International Journal of Human-Computer Interaction, 23(1-2), 3–23. https://doi.org/10.1080/10447310701360995
- Tombros, A., & Sanderson, M. (1998, August). Advantages of query biased summaries in information retrieval [Paper presentation]. Proceedings of the 21st Annual International ACM SIGIR Conference on Research and Development in Information Retrieval (pp. 2–10). https://doi.org/10.1145/290941.290947
- Verberne, S., van der Heijden, M., Hinne, M., Sappelli, M., Koldijk, S., Hoenkamp, E., & Kraaij, W. (2013). Reliability and validity of query intent assessments. Journal of the American Society for Information Science and Technology, 64(11), 2224–2237. https://doi.org/10.1002/asi.22948
- Wang, C., Liu, Y., Zhang, M., Ma, S., Zheng, M., Qian, J., & Zhang, K. (2013, July). Incorporating vertical results into search click models [Paper presentation]. Proceedings of the 36th International ACM SIGIR Conference on Research and Development in Information Retrieval (pp. 503–512). https://doi.org/10.1145/2484028.2484036
- Wang, Q., Mao, Z., Wang, B., & Guo, L. (2017). Knowledge graph embedding: A survey of approaches and applications. IEEE Transactions on Knowledge and Data Engineering, 29(12), 2724–2743. https://doi.org/10.1109/TKDE.2017.2754499
- Wang, Y., Yin, D., Jie, L., Wang, P., Yamada, M., Chang, Y., & Mei, Q. (2016, February). Beyond ranking: Optimizing whole-page presentation. In Proceedings of the Ninth ACM International Conference on Web Search and Data Mining (pp. 103–112).
- Zamir, O., & Etzioni, O. (1998, August). Web document clustering: A feasibility demonstration. In Proceedings of the 21st Annual International ACM SIGIR Conference on Research and Development in Information Retrieval (pp. 46–54).
- Zamir, O., & Etzioni, O. (1999). Grouper: A dynamic clustering interface to Web search results. Computer Networks, 31(11-16), 1361–1374. https://doi.org/10.1016/S1389-1286(99)00054-7
- Zeng, H. J., He, Q., Liu, G., Chen, Z., Zhang, B., & Ma, W. Y. (2009). Query-based snippet clustering for search result grouping. (U.SPatent No7,617,176). U.S. Patent and Trademark Office.
- Zhou, M. (2014). Gender difference in web search perceptions and behavior: Does it vary by task performance? Computers & Education, 78, 174–184. https://doi.org/10.1016/j.compedu.2014.06.005