
Abstract
Exposure to false information is becoming a common occurrence in our daily lives. New developments in artificial intelligence are now used to produce increasingly sophisticated multimedia false content, such as deepfakes, making false information even more challenging to detect and combat. This creates expansive opportunities to mislead individuals into believing fabricated claims and negatively influence their attitudes and behavior. Therefore, a better understanding of how individuals perceive such content and the variables related to the perceived trustworthiness of deepfakes is needed. In the present study, we developed and validated the Perceived Deepfake Trustworthiness Questionnaire (PDTQ) in English, Italian, and Slovene. This was done in three phases. First, we developed the initial pool of items by reviewing previous studies, generating items via interviews and surveys, and employing artificial intelligence. Second, we shortened and adapted the questionnaire according to experts’ evaluation of content validity and translated the questionnaire into Italian and Slovene. Lastly, we evaluated the psychometric characteristics via a cross-sectional study in three languages (N = 733). The exploratory factor analyses suggested a two-factor solution, with the first factor measuring the perceived trustworthiness of the content and the second measuring the perceived trustworthiness of the presentation. This factorial structure was replicated in confirmatory factor analyses. Moreover, our analyses provided support for PDTQ’s reliability, measurement invariance across all three languages, and its construct and incremental validity. As such, the PDTQ is a reliable, measurement invariant, and valid tool for comprehensive exploration of individuals’ perception of deepfake videos.
1. Introduction
Rapid technological development, including the rise of social media and artificial intelligence (AI), has brought about several benefits, such as easier access to information, new communication options, and innovations in healthcare and education (e.g., Al-Qaysi et al., Citation2024), but it also poses many challenges, with a very notable one being the ease of generating and spreading false information (Chen et al., Citation2023; Li et al., Citation2024). Misinformation (i.e., no intent to mislead) and disinformation (i.e., intent to mislead) soared high during the recent COVID-19 pandemic (Zarocostas, Citation2020) and the Russo-Ukrainian war (Stanescu, Citation2022) but surpass these topics and are becoming a common occurrence in our lives. As exposure to false information may impact our attitudes and behavior, mis- and disinformation pose a risk to democratic processes and decision-making in areas such as public health and climate change (e.g., Lewandowsky, Citation2021; Neylan et al., Citation2023; van der Linden, Citation2022; van der Linden et al., Citation2017), making it one of the crucial issues that need to be investigated further and tackled in practice. For example, the American Psychological Association (Citation2023, Citation2024) listed fighting misinformation as one of the key challenges that need to be pursued by psychologists in both their 2023 and 2024 emerging trends reports, with a particular emphasis on misinformation in the context of politics. Similarly, the European Union’s action plan against disinformation calls for a better understanding of this threat and ways of countering it (European Commission, Citation2018).
Until recently, false information has mainly spread through written text, such as news articles and tweets (e.g., Allcott & Gentzkow, Citation2017; Bovet & Makse, Citation2019). However, new developments in AI have made it possible to create sophisticated multimedia false contents that use video imagery and audio to simulate reality, bringing about new ethical challenges (Sison et al., Citation2023) and adding a new layer of complexity to combating mis- and disinformation. A prominent example are the so-called deepfakes, which refer to a wide variety of computer-generated media in which a person in an existing image or video is replaced with someone else (Somoray & Miller, Citation2023). While the emergence of applications like Zao and FakeApp are making it increasingly easy to create deepfakes, and the technology behind them, such as general adversarial networks, is evolving fast, existing studies already show that individuals are not very skilled at recognizing deepfakes and similar content (Köbis et al., Citation2021; Park et al., Citation2023). At a minimum, this may cause uncertainty among those exposed (Vaccari & Chadwick, Citation2020). However, it may also completely mislead some individuals into believing fabricated claims, which, in turn, may negatively impact their attitudes and behavior, contribute to group polarization, and facilitate the spread of conspiracy theories (Ahmed, Citation2021; Hameleers et al., Citation2023; Sison et al., Citation2023).
Although people tend to perform poorly when detecting deepfakes and tend to find them trustworthy, it is unlikely that this occurs in the case of all deepfakes and equally applies to all individuals. In contrast, trust in deepfakes is likely influenced by a plethora of factors, including how well deepfakes simulate reality and individuals’ subjective perception of them, as well as intrapersonal characteristics that may increase or decrease individuals’ susceptibility. Nevertheless, although judgments regarding the authenticity of multimedia content are, in all likelihood, a product of various aspects, such as perceptions of the presented information, source, person in the video, and technical quality, there are currently no comprehensive questionnaires that capture these diverse perceptual aspects. Instead, the existing literature often relies on single items asking respondents whether a video has been manipulated. Additionally, surprisingly little is known about the individual characteristics that influence the perception of deepfakes, particularly beyond a few select attributes and general associations with the ability to detect deepfakes. In line with this, we aimed to develop and test the psychometric properties of the Perceived Deepfake Trustworthiness Questionnaire (PDTQ). As opposed to previous efforts, we intended to create a comprehensive instrument capable of measuring individuals’ perception of deepfake videos in a detailed, nuanced way, considering both content-related and presentation-related aspects of deepfakes. This was done by employing a rigorous development process heavily reliant on including the perspectives of various stakeholders. Moreover, as a part of investigating the questionnaire’s construct validity, we set out to identify the correlates of the perceived deepfake trustworthiness. Therefore, this study makes a major contribution to research on deepfakes by facilitating a better understanding of how individuals perceive such content (e.g., which specific features of deepfakes are considered by individuals when deciding whether they can be trusted) and identifying the variables related to their perception.
1.1. Conceptualization of the questionnaire
We set out to construct our questionnaire within the theoretical frameworks of trust and trustworthiness. In general, trust can be defined as “a psychological state comprising the intention to accept vulnerability based upon the positive expectations of the intentions or behavior of another” (Rousseau et al., Citation1998, p. 395) and is thus a characteristic of the one who trusts (i.e., truster). In contrast, trustworthiness is a characteristic of the one who is trusted (i.e., trustee; Kiyonari et al., Citation2006). While both terms were first used in interpersonal contexts, they were later expanded to institutions, such as government and science (Bornstein & Tomkins, Citation2015; Plohl & Musil, Citation2021), and, more recently, to technology, including AI (Chi et al., Citation2021; Lankton et al., Citation2015; Suen & Hung, Citation2023; Valori et al., Citation2023). In this context, trust can generally be understood as the belief that the given technology has desirable attributes (i.e., is trustworthy; Lankton et al., Citation2015). For videos that, for example, contain claims made by certain individuals, the crucial desirable attribute is that the person in the video did indeed make these claims. In line with this, we defined the perceived trustworthiness of deepfakes as the extent to which individuals perceive deepfakes as authentic (i.e., not fabricated).
In our view, the general trustworthiness of deepfake videos can be understood as a broad evaluation composed of more specific considerations of the message, source, video quality, and similar features that may increase or decrease perceived trustworthiness. For example, previous research has highlighted the importance of perceived source credibility, source vividness (also known as perceived salience; Lee & Shin, Citation2022), information believability, and overall persuasiveness (Hwang et al., Citation2021) when making conclusions regarding manipulated videos. However, to date, there are no valid and reliable scales of perceived trustworthiness of deepfakes that take these different aspects into account, hindering the development of a more nuanced understanding of what drives such evaluations. Additionally, relatively little is known about the variables associated with how individuals perceive the trustworthiness of deepfakes.
1.2. Objectives
In the present study, we aimed to develop and psychometrically evaluate a new questionnaire capable of measuring the extent to which individuals perceive deepfakes as trustworthy. Specifically, our objectives were to identify the diverse features that individuals consider when deciding whether to trust deepfakes (Objective 1), develop a comprehensive questionnaire containing these features (Objective 2), and test its’ psychometric properties, including its’ associations with other variables (Objective 3). While deepfakes can refer to different kinds of media, our questionnaire focuses on video content, specifically content depicting humans who present some information. To ensure the broad applicability of our questionnaire, we aimed to develop it in three languages, namely English, Italian, and Slovene. Additionally, recognizing the importance of fostering collaboration and advancing research in this field, we strived to make the questionnaire open-access, allowing it to be freely available to researchers and other stakeholders worldwide.
2. The questionnaire development process
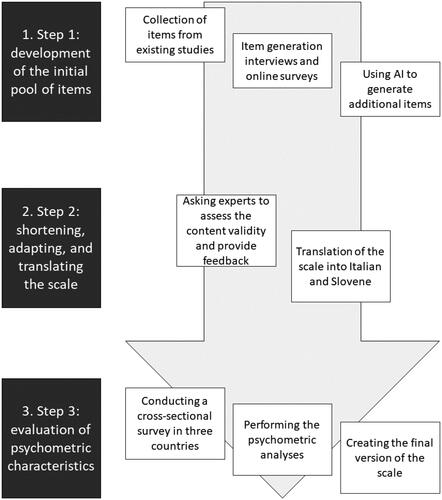
The questionnaire development procedure consisted of three main phases, namely 1) development of the initial pool of items, 2) shortening, adapting, and translating the scale, and 3) evaluation of psychometric characteristics.
In the first phase, we conducted a literature review to identify relevant aspects that constitute the perceived trustworthiness and to collect questionnaires and items from existing studies that measure them. Second, we generated an additional item pool via interviews with students and online surveys with other stakeholders, in which they were asked to think aloud while attempting to decide whether videos they were exposed to, some of which were manipulated, were trustworthy. Third, additional items were generated using Psychometric Item Generation (PIG; Götz et al., Citation2023), a natural language processing algorithm based on the GPT-2 that produces human-like customized text output. All sources of information were then combined to generate a larger pool of potential items. In the second phase, we asked the experts to assess the content validity of the collected and generated items, with the aim of shortening the scale, identifying the most relevant items, and adapting the items to make them as clear as possible. The resulting version of the questionnaire was then translated into Italian and Slovene. In the third phase, these versions of the scale were used in large cross-sectional surveys conducted in each of the three languages, followed by psychometric analyses related to factorial structure, measurement invariance, internal reliability, and validity (construct, incremental). Based on our findings, we then finalized the questionnaire. All steps are also outlined in .
Figure 1. Questionnaire development procedure.
3. Development of the initial Pool of items and the proposed factorial structure
We used various sources to develop the initial pool of items. First, we reviewed the existing literature to collect items from existing scales and generate items based on aspects identified as relevant in previous studies. Second, we conducted face-to-face interviews and an online survey in which participants were asked to think out loud while deciding whether they would trust the videos they were exposed to. Third, we used the Psychometric Item Generator (Götz et al., Citation2023) to complement our pool of items further. Each of these phases, as well as the synthesis of different sources, is described below.
3.1. Collection of items from existing studies
In the first phase, we ran multiple searches in SCOPUS, Web of Science, and Google Scholar to identify articles that explored individuals’ perceptions and, in particular, trust in deepfakes and other manipulated videos. While most articles employed simple questions with a dichotomous response format (e.g., “Would you trust this video?”), we managed to identify six research papers (Hameleers et al., Citation2022, Citation2023; Hwang et al., Citation2021; Lee & Shin, Citation2022; Ng, Citation2023; Shin & Lee, Citation2022) that used scales with multiple items (i.e., two to five) to measure different aspects of deepfakes (see Table S1 in Supplementary materials for a detailed overview of scales). Previous scales mainly focused on content (e.g., credibility of presented information, persuasiveness of presented information) and, to a lesser extent, the person in the video (e.g., vividness). Other aspects, such as technical features, were mostly neglected. In fact, the only existing scale that incorporated multiple aspects is the one by Hameleers and colleagues (Citation2023; Message Believability Scale) that asked participants about the content of the political speech, the political actor, and the way the message was presented (with one item per aspect). This basic structure (content, person in the video, and other aspects) was also used as a starting point for our scale.
Our literature review additionally yielded three articles (Hameleers et al., Citation2023; Tahir et al., Citation2021; Thaw et al., Citation2021) that did not use relevant scales but provided other valuable information. Specifically, Hameleers and colleagues (Citation2023) analyzed open-ended questions about trust, distrust, credibility, and believability (as they pertain to the message, source, and presentation in the context of politics) and identified five crucial topics: 1) a content-wise discrepancy between the political reality and the statements voiced in the message, 2) perceived manipulation and doctoring of the audio-visual stimuli, 3) broader levels of political distrust and opinion-based disagreement, 4) lack of factual evidence, sourcing, and argumentation, and 5) self-perceived media literacy. Topics 1, 2, and 4 are important in the context of our questionnaire, whereas topics 3 and 5 refer to individual characteristics. Tahir and colleagues (Citation2021) used eye-tracking and surveys to identify features that help identify deepfakes. They provided a list of such features, including, for example, blurriness on the eye region, subtle color differences, and clear boundaries of the face. Lastly, Thaw and colleagues (Citation2021) conducted interviews and extracted the features associated with accurate deepfake identification. Similarly as Tahir and colleagues (Citation2021), they provided a list of such features, for example lack of emotions, abnormal mouth movements, and unnatural voice. These aspects, identified in previous studies, were used to generate items, with resulting items mostly referring to person-related aspects but, to a lesser extent, also to content-related aspects and other features.
Although the literature on the perceived trustworthiness of deepfakes is just emerging (with all relevant studies being published in recent years), and the existing scales are generally short and cover only one aspect of videos, previous literature does offer some insight into the process that takes place within the individual when deciding whether to trust manipulated videos. Altogether, our literature review led to 41 unique items adapted from previous scales or generated based on previous studies, with 19 referring to the content, 18 to the person in the video, and 4 to other aspects (primarily technical ones).
3.2. Item generation interviews and an online survey
In the second phase, we conducted face-to-face interviews with students in Italy and Slovenia and an international online survey aimed at three groups of crucial stakeholders, specifically citizens, journalists, and experts. The interviews and the online survey had a similar procedure. In particular, individuals were first given basic information about the study and asked to sign the informed consent form. They were then exposed to four short English-language videos (three manipulated and one authentic video) depicting well-known individuals, shown one by one. Participants were told in advance that they will be asked whether they trust each of the presented videos and encouraged to share all the thoughts that popped into their heads while watching, regardless of their relevance. At first, individuals were not asked any specific questions, but in the later parts of the interview and the online survey, they were shown the videos once again and were asked what they thought about the content, the person in the video, and other aspects. In the online survey, they provided their answers in English via text boxes, whereas face-to-face interviews were recorded, transcribed, and translated from participants’ native language (Italian, Slovene) to English. At the end of the study, participants were asked to fill out a short questionnaire containing demographic questions. They were also debriefed that some of the presented videos were manipulated. Both interviews and the online survey took approximately 25 minutes to complete. During the analyses, participants’ thoughts were organized into meaningful units (specific statements). All statements were then coded using deductive thematic analyses, in which each of the meaningful units was categorized into one of the three themes that emerged in the first phase (content, person in the video, other).
Sixteen students from Italy (50.0%) and Slovenia (50.0%), all proficient in English, participated in face-to-face interviews. Most (75.0%) were women, and the average age was 23.69 years (SD = 3.93). Half of them (50.0%) had previously completed a higher secondary education, 25.0% had previously completed a bachelor’s degree, and the remaining 25.0% had previously completed a master’s degree (and were PhD students at the time of the study). The majority of participants (56.3%) were psychology students, while the rest studied sociology, management, finance, economics, philosophy, and foreign languages. The interviews generated 82 statements pertaining to the content (e.g., “I would not say it is the truth. It seems like he is trying to impress someone with this story, so he is probably making this up.”), 121 statements pertaining to the person in the video (e.g., “His gestures were off; it seems very unnatural to explain something in such a theatrical way.”), and 303 statements pertaining to other aspects (e.g., “This video was posted by a random person.”).
Ten participants (50.0% male, 50.0% female), all proficient in English, filled out the online survey. They were highly educated (80.0% with at least a master’s degree), and their average age was 35.6 years (SD = 9.31). Half of the sample (50.0%) consisted of experts in fields such as social science and computer science, while the remaining participants were either journalists (30.0%) or regular citizens (20.0%). Altogether, the online survey led to 40 statements pertaining to the content (e.g., “The content is unconvincing and contrived.”), 70 statements pertaining to the person in the video (e.g., “The lips were not completely in sync with the text.”), and 87 statements pertaining to other aspects (e.g., “The video had poor quality, low resolution.”).
In the last step, we developed the items from the unique and relevant statements collected via interviews and the online survey. The two think-aloud approaches led to 305 items, with 43 referring to the content, 87 referring to the person in the video, and 175 referring to other aspects.
3.3. Using a generative language model to generate additional items
In the third phase, we used the Psychometric Item Generator, a novel open-source generative language model that runs on Google Colaboratory and has previously been found to be an effective machine learning solution to developing items for psychometric scales (Götz et al., Citation2023). Specifically, we followed the procedure outlined by its’ developers; we used the pre-trained 774 M GPT-2 language model, fed the algorithm ten previously-developed items per each category (content, person, other), set the length parameter to 50 (i.e., number of tokens to be generated), the temperature parameter and top_p (i.e., the creativity of the output) to 0.9 and 0.95 respectively, nsamples (i.e., total number of text outputs) to 100, and batch_size (i.e., number of text outputs generated at a time) to 20. As a result, the language model produced 2000 items per category. Researchers screened these items, and the items deemed highly relevant and clear were added to the item pool. This procedure led to an additional 73 items, with 29 referring to the content, 16 referring to the person in the video, and 28 referring to other aspects.
3.4. Synthesis
Altogether, the item generation procedure led to 419 items, with 90 items pertaining to the content, 121 items pertaining to the person in the video, and 208 items pertaining to other aspects.
While we started the item generation procedure with three categories of items - namely content, person in the video, and other aspects - established based on literature review (e.g., Hameleers et al., Citation2023), the think-aloud techniques and the psychometric item generator resulted in a large number of rather diverse items categorized into the “other” category. As such, we additionally used inductive thematic analysis within this broad topic. Specifically, each item was further coded into a more specific topic, such as “suspicious source,” “low quality of the video,” and “number of views, followers, subscribers.” These specific topics were then combined further into three broader categories – the source of the video, technical aspects, and broader contextual characteristics. Once we divided the items pertaining to other aspects into these three categories, we ended up with 68 items referring to the source of the video (e.g., “I am not familiar with the source that published the video”), 82 items referring to technical aspects (e.g., “The video looked like several clips were stitched together”), and 58 items referring to the broader context (e.g., “The motivation behind the video seems suspicious”).
As the number of items was far too high for the next content validity step and different ways of developing items led to items that severely overlapped, we reduced the number of items by only keeping those that were unique and general enough (i.e., some items were so specific that they would only be appropriate for responding to videos with certain content). The resulting first version of the questionnaire consisted of 123 items (content: 29 items, person in the video: 36 items, source of the video: 19 items, technical aspects: 29 items, contextual characteristics: 10 items).
4. Shortening, adapting, and translating the questionnaire
The goal of the second step was to shorten the instrument, adapt it according to experts’ feedback regarding the validity and clarity of the constructed items, and translate the items, initially developed in English, to Italian and Slovene.
4.1. Asking experts to assess the content validity and provide feedback
The first version of the questionnaire, developed in Step 1, was administered online to 13 experts (46.2% male, 38.5% female, 15.4% other or preferred not to disclose their gender; age: M = 36.4 years, SD = 14.05), working in various fields, such as psychology, philosophy, media studies, and computer science.
Participants were first informed about the study’s aims, their rights as participants, and the questionnaire being developed. After consenting to participate in the study, participants were asked to read each item, assess its relevance and clarity, and provide additional comments (such as suggestions regarding the alternative wording). The items were presented in five blocks that corresponded with the five categories identified in the previous stage − 1) the content of the video, 2) the person in the video, 3) the source of the video, 4) other video characteristics, and 5) contextual characteristics, with each block being accompanied by a short description (e.g., “The first group of items refers to video’s content (i.e., the message conveyed in the video)”). In the case of relevance, participants were asked to assign each item one of the following values: 1 (“The item is essential”), 2 (“The item is useful but not necessarily essential”), or 3 (“The item is not needed”). Similarly, in the case of clarity, they were asked to assign each item one of the following values: 1 (“The item is clear”), 2 (“The item should be partially modified to achieve the desired clarity”), 3 (“The item should be substantially modified to achieve the desired clarity”), or 4 (“The item is completely unclear”). On average, the participants needed 30-35 minutes to complete the study.
During the analyses, we calculated the content validity ratio (CVR; Lawshe, Citation1975), which can range from −1.00 to 1.00, with higher values indicating higher relevance of the items. For example, when the number of experts stating that the item is “essential” is more than half, the CVR is somewhere between .00 and 1.00. Furthermore, we calculated the content validity index (CVI; McGartland Rubio et al., Citation2003), with higher values indicating higher clarity of the items. For instance, when the number of experts indicating that the item is clear or only needs a partial modification is more than half, the CVI is somewhere between .50 and 1.00. For CVR, a cutoff of 8 (in the case of 11 experts) or 9 participants (in the case of 12 or 13 experts) indicating “essential” was used as the threshold (Wilson et al., Citation2012). For CVI, a conventional cutoff of .80 was used as the threshold. Additionally, we summarized participants’ comments and used them to modify the items.
The results showed that 31 items (8 related to the content of the video, 9 related to the person in the video, 7 related to the source of the video, and 7 related to technical aspects) passed both the CVR and CVI acceptance threshold. Since none of the items from the “contextual characteristics” group passed the CVR threshold, this group of items was excluded entirely. Moreover, 5 of the 31 items were slightly reworded according to participants’ comments (see Supplementary materials; Table S2). Detailed results pertaining to the content validity of the retained items are presented in below.
Table 1. Content validity of the retained items.
In this step, we also prepared the instructions (see Table S10 in Supplementary materials) and decided on the response scale. The latter consists of seven options that reflect the level of agreement with the items and includes a neutral option that can be chosen if the participant cannot answer a particular item.
4.2. Translation of the questionnaire into Italian and Slovene
We prepared the Slovene and Italian versions of the questionnaire using the translation-back translation procedure. Specifically, a researcher who is bilingual in English and the target language at a C1 or C2 level of language competence translated the questionnaire (including the instructions) to the target language, another researcher (with equivalent language competence) translated the questionnaire back to English, and both researchers together resolved the inconsistencies and finalized the translation.
5. Evaluation of psychometric characteristics
Our aim in the third step was to test the psychometric properties of the Perceived Deepfake Trustworthiness Questionnaire (PDTQ) across three languages, namely English, Italian, and Slovene. We were interested in the factorial structure of the questionnaire (RQ1), the measurement equivalence of the three language versions (RQ2), and the internal reliability of the questionnaire or dimensions that may emerge (RQ3).
Moreover, to establish construct validity, we set to explore the associations between our questionnaire and the known correlates of trusting deepfakes or - because the literature specifically investigating the antecedents of the perceived deepfake trustworthiness is limited - susceptibility to misinformation more generally. Previous literature suggests that age (H1; Chen et al., Citation2023), education (H2; Chen et al., Citation2023), conservatism (H3; Roozenbeek et al., Citation2020; Sütterlin et al., Citation2023), and using social media as a source of information (H4; Roozenbeek et al., Citation2020) all play an important role in determining the processing of deepfakes and other forms of misinformation. In particular, older, less educated, more politically conservative individuals who frequently use social media to receive news are more prone to trust misinformation. Moreover, there is some evidence that bullshit receptivity (H5; Iacobucci et al., Citation2021; Pennycook & Rand, Citation2020), reflectiveness (H6; Hameleers et al., Citation2024; Pennycook & Rand, Citation2020), trust in media (H7; Roozenbeek et al., Citation2020), media literacy (H8; Hwang et al., Citation2021; Xu et al., Citation2024), and knowledge about deepfakes (H9; Hwang et al., Citation2021; Shin & Lee, Citation2022) are also associated with perceived trustworthiness of manipulated content. Specifically, bullshit receptivity and trust in media may increase susceptibility to misinformation, whereas reflectiveness, media literacy, and knowledge of deepfakes may decrease it. We also hypothesized that the results obtained with our questionnaire will be related to the results gathered with the Message Believability Scale previously developed by Hameleers and colleagues (Citation2023) in the context of deepfakes (H10).
Since the objective qualities of the video, such as plausibility of the content (e.g., Hameleers et al., Citation2024) and technical sophistication (e.g., Jin et al., Citation2023) influence subjective perceptions, we also assumed that the perceived trustworthiness, as captured by our questionnaire, will be higher when rating the authentic video compared to rating the manipulated video (H11). Lastly, as previous studies showed that specific perceptions of misinformation can influence final decisions on whether deepfakes are manipulated (Tahir et al., Citation2021; Thaw et al., Citation2021) as well as behavioral intentions related to spreading such content (Shin & Lee, Citation2022), we hypothesized that our questionnaire will be positively related to the final decisions regarding the authenticity of videos (H12) and viral behavioral intentions (H13) over and above other known antecedents of these factors and similar scales.
5.1. Participants
We recruited three independent samples for this phase of the study. The English and Italian samples were gathered using the Prime Panels platform, a compilation of online panels (Chandler et al., Citation2019), whereas the Slovene sample represents a convenience sample of participants recruited via social media websites, such as Facebook and Instagram. The only two inclusion criteria were that participants needed to be at least 16 years old and have a good enough knowledge of English to comprehend English-language videos.
The final sample for this phase consisted of 733 participants, of whom 443 (60.4%) were female, 285 (38.9%) male, while the remaining 5 participants described themselves as “other” or preferred not to answer (0.7%). Their age ranged from 16 to 87 years (M = 42.23, SD = 16.32). Most participants finished secondary education (n = 479; 65.3%), obtained a Bachelor’s degree or equivalent (n = 155; 21.1%), or obtained a Master’s degree or equivalent (n = 79; 10.8%). In contrast, fewer participants obtained a Doctoral degree or equivalent (n = 11; 1.5%), or (only partly) completed primary education (n = 9; 1.2%). 313 participants (42.7%) filled out the English version of the survey, 202 (27.6%) the Italian version, and 218 (29.7%) the Slovene version of the survey. Demographic data of the three subsamples are displayed in below. While the three subsamples did not differ in gender (χ2(6) = 8.62, p = .196) nor education (H(2) = 1.26, p = .534), they did differ in age, as shown by Welch’s ANOVA (F(2, 468.30) = 206.64, p < .001). In particular, the Games-Howell post-hoc tests revealed that the Slovene subsample was significantly younger than the Italian (p < .001) and English (p < .001) subsamples, whereas the Italian and English subsamples did not differ significantly (p = .825).
Table 2. Demographic characteristics of subsamples.
5.2. Measures
5.2.1. Perceived deepfake trustworthiness
We asked participants to fill out the 31-item Perceived Deepfake Trustworthiness Questionnaire (1 – “Strongly disagree,” 7 – “Strongly agree”), which has already been described in previous sections.
5.2.2. Demographic questions
We collected data regarding participants’ age (in years) and their highest level of education (1 – “Primary education or less,” 2 – “Secondary education,” 3 – “Bachelor’s degree or equivalent,” 4 – “Master’s degree or equivalent,” 5 – “Doctoral degree or equivalent”). Moreover, participants’ political orientation was captured with two items asking them about their political outlook with regard to social and economic issues (e.g., “How would you describe your political outlook with regard to social issues?”; 1 – “Very liberal,” 7 – “Very conservative”; Talhelm et al., Citation2015). Lastly, we asked participants about their social media use, in particular about the frequency of using social media as a source of news (1 – “Never,” 4 – “Often”; Pew Research Center, Citation2023).
5.2.3. Bullshit receptivity
Bullshit receptivity was measured with the Bullshit Receptivity Scale (Pennycook et al., Citation2015), which consists of statements containing randomly organized buzzwords with syntactic structure but no actual meaning. As in some previous studies, we chose five items from the original 10-item scale (e.g., “Hidden meaning transforms unparalleled abstract beauty”). Participants were asked to respond to these items by indicating the extent to which they found the statements to be profound (i.e., of deep meaning and great significance; 1 – “Not all profound,” 5 – “Very profound).
5.2.4. Reflectiveness
Reflectiveness was measured with the multiple-choice questions version of the Cognitive Reflection Test (Sirota & Juanchich, Citation2018). Specifically, we used the version of the test that consists of three items (e.g., “If it takes 5 machines 5 minutes to make 5 widgets, how long would it take 100 machines to make 100 widgets?”) and provides participants with two response options, one being an intuitive, but factually wrong, answer (e.g., “100 minutes”), and the other being a more reflective, correct answer (e.g., “5 minutes”). Participants’ answers were scored in such a way that correct answers were assigned a point. Hence, higher scores indicate higher reflectiveness.
5.2.5. Trust in media
Trust in media was measured with three items, adapted from Pew Research Center (Citation2022). In particular, participants were asked to what extent they trust “media in general,” “social media sites,” and “local, national, and international news organizations” (1 – “Not at all,” 5 – “Extremely”).
5.2.6. Media literacy
Media literacy was measured with six items taken from the otherwise longer Media Literacy Skills Scale (Eristi & Erdem, Citation2017). An example item is “I question the media contents that I examine with respect to the purposes they were constructed and shared for” (1 – “Completely unsuitable for me,” 5 “Completely suitable for me”).
5.2.7. Deepfake knowledge
Participants’ subjective knowledge about deepfakes was measured with the scale developed by Ng (Citation2023). It consists of four items (e.g., “I know a lot about deepfakes”), which are answered using a 7-point agreement scale (1 – “Strongly disagree,” 7 – “Strongly agree”).
5.2.8. Message believability
Message believability was measured with three items asking participants how believable they found various elements of the political speech (e.g., “The content of the speech”; Hameleers et al., Citation2023). The scale employs a 7-point response scale ranging from 1 – “Not all believable” to 7 – “Extremely believable.”
5.2.9. Perceived video fakeness
Near the end of the study, we asked the participants whether they believe that the two videos they watched were fake. We used a single item, adapted from Ng (Citation2023), for example: “The video with Boris Johnson is fake” (1 – “Strongly disagree,” 7 – “Strongly agree”).
5.2.10. Viral behavioral intentions
Viral behavioral intentions, which describe participants’ willingness to share the content online, were measured with a scale that consists of five items answered using a 7-point scale (1 – “Not at all,” 7 – “Very much”; Alhabash et al., Citation2015; Shin & Lee, Citation2022). In our study, the word “news” was replaced with “video” to better reflect the materials participants were exposed to in our study (e.g., “I would share the video to others”).
5.2.11. Attention checks and control questions
Lastly, the survey contained three attention checks (e.g., “This is an extra line. Do not answer this question”; Maniaci & Rogge, Citation2014) and a few control questions. In particular, we measured individuals’ familiarity with the two political actors shown in the videos (e.g., “How familiar are you with Boris Johnson?”; 1 – “Not familiar at all,” 5 – “Very familiar”). Moreover, we asked them if they already saw the stimuli used in the study prior to their participation (e.g., “Have you seen the video with Boris Johnson before participating in our study?”; 1 – “No,” 2 – “Uncertain,” 3 – “Yes”).
5.3. Procedure
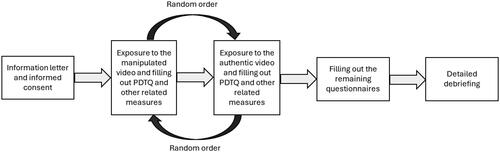
The English and Italian samples were recruited via Prime Panels (Chandler et al., Citation2019), whereas the Slovene sample was recruited via social media websites. In both cases, the study was promoted as a study investigating how people perceive political videos and what factors contribute to their perception of such content; the fact that one of the videos was a deepfake was not disclosed a priori. Subjects were first asked to read the information letter, which described the general goal of the study, its procedure, the voluntary nature of participation, key information regarding privacy and data sharing, and contact information in case of any questions. Those who consented to participate in the study were exposed to the first video and asked to respond to related questionnaires (i.e., Perceived Deepfake Trustworthiness Questionnaire, Message Believability Scale, and Viral Behavioral Intentions Scale). They were then exposed to the second video and asked to respond to the same questionnaires once again. While the order of the videos was randomized entirely, one was a manipulated video (deepfake) of Boris Johnson endorsing his opponent, Jeremy Corbyn, and the other was an authentic video of Donald Trump committing to eliminate the HIV epidemic in the United States. Each video lasted for approximately 30 seconds.
Participants were then asked to fill out the remaining questionnaires measuring general individual differences (e.g., The Bullshit Receptivity Scale, The Cognitive Reflection Test, and the Media Literacy Skills Scale), whereas questions related explicitly to deepfakes (i.e., the Perceived video fakeness scale and the Deepfake knowledge scale) were asked near the end of the survey to avoid any potential threats to internal validity. At the end of the study, participants were asked to answer the demographic questions, followed by a detailed debriefing explaining that the video of Boris Johnson was not authentic. The study procedure, visualized in , took approximately 15-20 minutes to complete.
Figure 2. Study procedure.
5.4. Statistical analyses
We first merged the three databases into a single dataset and excluded participants who dropped out during the study, failed more than one attention check, or had more than 5% of missing values. The remaining missing values, which were missing at random, were imputed using expectation maximization. The main analyses consisted of exploratory factor analyses, confirmatory factor analyses, internal reliability analyses, and construct validity analyses.
As our goal was to find a latent structure to observed variables and to develop a new instrument that may be used by other researchers in the future, we used the maximum likelihood method of exploratory factor analyses (Field, Citation2013). Standard factor retention criteria (i.e., the Kaiser-Guttman rule and visual inspection of the scree plot) were complemented with parallel analysis, which compares the observed eigenvalues to those calculated from random data (O’Connor, Citation2000). The potential solutions were evaluated from both the theoretical and empirical perspective. To improve the interpretability of factors, we applied an oblique Promax rotation (with default parameter settings) that allows correlation between the factors (Field, Citation2013). We then evaluated the item loadings (loadings .50 or higher were considered adequate), cross-loadings (ratio of loadings below 75% was considered adequate), and communalities (communalities .20 or higher were considered adequate; Samuels, Citation2017).
Since we did not observe any larger deviations from the normal distribution, we used Maximum Likelihood as the estimator for confirmatory factor analyses. The fit of different models was evaluated and compared by calculating the CFI (≥ .90 acceptable), RMSEA (≤ .10 acceptable), SRMR (≤ .10 acceptable), AIC, BIC, and SABIC (lower values indicate a better fit; Hooper et al., Citation2008). Furthermore, we assessed two levels of measurement invariance of the English, Italian, and Slovene versions, specifically configural invariance (i.e., whether items load onto the same factors across languages; tested by specifying the model separately for each group and comparing the fit indices) and metric invariance (i.e., whether item factorial loadings are equal across languages; tested by comparing the metric invariance model to the configural model). When evaluating the adequacy of the metric model, changes (△) of ≥ .01 in the CFI, ≥ .015 in the RMSEA, and ≥ .03 in the SRMR were considered indicators of a significant decrease in the model fit (Chen, Citation2007).
Internal reliability was calculated using coefficient alpha. Reliability indices between .70 and .79 were considered appropriate, between .80 and .89 good, and above or equal to .90 excellent (Hunsley & Mash, Citation2008). Lastly, construct validity analyses consisted of correlation analyses (Pearson’s r), hierarchical regression analyses conducted in four steps, and two paired-sample t-tests accompanied by effect sizes (Cohen’s d).
All analyses presented in the article were performed on the whole sample described in section 5.1. However, we also cross-validated the results regarding the factorial structure by splitting the sample into two approximately equal parts (sample 1a: exploratory factor analyses, sample 1b: confirmatory factor analyses). This procedure led to very similar results, described in more detail in Supplementary materials (section 9.2). All data analyses were performed using IBM SPSS version 29.0 and Mplus version 8.0.
5.5. Results
Most participants were relatively familiar with the two political actors that appeared in the videos (Boris Johnson: M = 3.10, SD = 1.26, Donald Trump: M = 3.41, SD = 1.12). Moreover, 55 participants (7.5%) claimed that they saw the manipulated video with Boris Johnson prior to participating in the study, and 79 participants (10.8%) claimed that they saw the authentic video with Donald Trump prior to their participation in the study.
In the following sections, we describe the results of exploratory factor analyses, confirmatory factor analyses (including invariance testing), analyses of internal reliability, and findings related to construct and incremental validity.
5.5.1. Exploratory factor analysis
Before conducting exploratory factor analysis, we analyzed bivariate correlations among items, conducted the Kaiser-Meyer-Olkin (KMO) measure of sampling adequacy, and performed Bartlett’s test of sphericity. We found that items were generally significantly correlated, with an average inter-item correlation of .31. The KMO index was .94, which is above the minimum acceptable value of .60 (Tabachnick et al., Citation2013), and Bartlett’s test of sphericity was significant (χ2(465) = 11187.56, p < .001), thus rejecting the null hypothesis that the correlations in the correlation matrix were zero. We also calculated descriptive statistics (mean, standard deviation, minimum, maximum, skewness, kurtosis) of each item, which can be seen in Supplementary materials (Table S3).
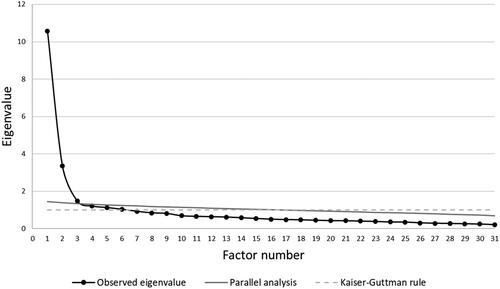
Since the results showed that the data were suitable for factor analysis, we continued with exploratory factor analyses using the Maximum Likelihood method (at first without rotation). Six factors exhibited an initial eigenvalue larger than one (the Kaiser-Guttman rule), whereas the visual interpretation of the scree plot suggested the extraction of two factors. The Kaiser-Guttman rule and visual inspection were complemented with parallel analysis, which showed that the eigenvalues of the first three factors were greater than the 95th percentile of the eigenvalues from the random datasets (). All three possible solutions were investigated in more detail. We found that the two-factor solution was superior to others; in this solution, as opposed to alternatives, both factors were theoretically meaningful, explained a significant share of variance (above 5%; see Table S4 in Supplementary materials), and had more than three items loading onto them.
Figure 3. Scree plot.
Once we determined the estimated number of factors, we re-ran the exploratory factor analysis using the Promax (oblique) rotation to improve the interpretability of the factors. As can be seen in , the first factor now explained 32.26% of item variance, while the second factor accounted for 9.13% of item variance.
Table 3. Eigenvalues and total variance explained by the extracted factors before and after rotation.
Loadings of all items on each factor and communalities are shown in . A factor loading of .50 was used as the cutoff value. As seen in the Table, 11 items sufficiently and clearly (without significant cross-loadings) loaded onto the first factor, which combines the items initially developed within the “content” and “source” categories. Similarly, 11 items sufficiently and clearly loaded onto the second factor, which combines the items initially developed within the “person in the video” and “technical aspects” categories. All 22 items also exhibited satisfactory communalities (> .20). The remaining nine items were excluded from further analyses. To easily differentiate between the two factors that emerged, we named the first one “perceived trustworthiness of content” (evaluations of the presented information and their source) and the second one “perceived trustworthiness of presentation” (evaluations of how the information is presented, including the behavior of the person in the video and technical sophistication).
Table 4. Exploratory factor analysis: loadings and communalities.
5.5.2. Confirmatory factor analysis
We performed confirmatory factor analysis using maximum likelihood as the estimator (). The 2-factor solution, derived from exploratory factor analysis, was compared to the 1-factor solution. As demonstrated by higher CFI and lower RMSEA, SRMR, AIC, BIC, and SABIC values, the 2-factor solution exhibited a better fit that can be described as satisfactory. The better-fitting solution was then analyzed further. Specifically, we reviewed the modification indices and found a few very high values pertaining to residual covariances between items 2 and 6 (M.I. = 170.48), items 7 and 9 (M.I. = 159.56), items, 11 and 21 (M.I. = 83.53), and items 20 and 25 (M.I. = 68.58). All these pairs of items represent items that belong to the same factor and have similar content (i.e., items 2 and 6 are related to the credibility of presented information, items 7 and 9 to the authenticity of the voice, items 11 and 21 to the consistency of information presented in the video and previous knowledge, and items 20 and 25 to the clarity of the face). As such, we made post-hoc modifications to the 2-factor model; we allowed residuals of these pairs of items to covary and respecified the model. The resulting model fit the data better than the initial 2-factor solution. Standardized loadings, which belong to the modified 2-factor solution, are shown in below. As shown in the Figure, all loadings were above .50 and significantly contributed to the proposed factor.
Figure 4. Standardized loadings for the modified 2-factor solution.
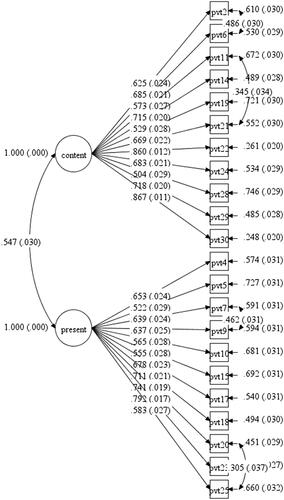
Table 5. Fit indices pertaining to the three investigated models.
We then performed confirmatory factor analyses separately for each language version and found a good fit of the English version (χ2 = 484.48***, CFI = .92, RMSEA = .07 [.06; .07], SRMR = .07) and a satisfactory fit of the Italian (χ2 = 525.42***, CFI = .87, RMSEA = .09 [.08; .10], SRMR = .08) and the Slovene version (χ2 = 413.39***, CFI = .87, RMSEA = .07 [.06; .08], SRMR = .08). As such, configural invariance was established. Standardized loadings belonging to the English, Italian, and Slovene versions of the questionnaire can be found in Supplementary materials (Table S5). While the strength of loadings varied, all items significantly contributed to the proposed factor. Further analyses related to invariance testing () also supported metric invariance across the three languages, as indicated by a low difference of CFI (≤ .010) and RMSEA (≤ .015) between the configural and metric model.
Table 6. Measurement invariance of the English, Italian, and Slovene version.
5.5.3. Internal reliability and validity
The first dimension of the questionnaire, trustworthiness of the content, exhibited great overall internal reliability (α = .91), and good to great internal reliability of different language versions (English: α = .92, Italian: α = .90, Slovene: α = .83). Similarly, the second dimension of the questionnaire, trustworthiness of the presentation, exhibited great overall internal reliability (α = .89), whereas internal reliability of different language versions ranged from good to great (English: α = .89, Italian: α = .90, Slovene: α = .84).
shows descriptive statistics of both dimensions, other relevant variables, and bivariate associations among them. As shown in the table, the correlation between the two dimensions of the questionnaire was positive and intermediate in strength. On top of that, trustworthiness of content was strongly positively associated with message believability and viral behavioral intentions, and strongly negatively associated with perceived video fakeness. It also correlated significantly with age, political conservatism, social media use, bullshit receptivity, trust in media, and deepfake knowledge (positively), as well as reflectiveness and media literacy (negatively). It is worth noting that associations between trustworthiness of content and trustworthiness of presentation, message believability, viral behavioral intentions, perceived video fakeness, bullshit receptivity, and reflectiveness were most robust, as they were significant in all three subsamples (see Table S6 in Supplementary materials). On the other hand, trustworthiness of presentation was positively associated only with message believability (strongly), behavioral intentions, and age (weakly), and negatively associated only with perceived video fakeness (strongly) and deepfake knowledge (weakly). Additional analyses showed that associations with message believability and perceived video fakeness were particularly robust, whereas correlations with viral behavioral intentions, deepfake knowledge, and age reached the significance threshold in two of the three countries.
Table 7. Descriptive statistics and bivariate associations.
Construct validity was additionally tested by comparing the perceived trustworthiness of content and presentation reported after watching the manipulated video to the trustworthiness reported after watching the authentic video. The results of these analyses are displayed in . As shown in the table, both dimensions were assessed as significantly more trustworthy when responding to the authentic video compared to the manipulated video. The effect sizes were large.
Table 8. Comparison of perceived trustworthiness between the manipulated and the authentic video.
Table 9. Incremental validity of the perceived deepfake trustworthiness questionnaire.
The incremental validity of the Perceived Deepfake Trustworthiness Questionnaire in predicting perceived video fakeness (i.e., the decision regarding the inauthenticity of the video) and viral behavioral intentions (i.e., the intention to like, share, and recommend the video) was investigated by performing hierarchical regression analyses in four steps; in the first step, we added basic demographic variables (i.e., age, education, political conservatism, social media use), in the second step, we added the variables capturing individual differences (i.e., bullshit receptivity, reflectiveness, trust in media, media literacy, deepfake knowledge), in the third step, we added the Message Believability Scale, which reflects participants’ perception of the manipulated video, and in the last step, we added the two dimensions of the central questionnaire.
The results, displayed in , showed that the Perceived Deepfake Trustworthiness Questionnaire explained a significant portion of variance (an additional 16%) in perceived video fakeness over and above other included variables. In the final model, which altogether explained 48% of the variance, age (β = −.09, p = .003) and message believability (β = −.08, p = .046) weakly but significantly predicted this outcome, whereas trustworthiness of content (β = −.46, p < .001) and trustworthiness of presentation (β = −.24, p < .001) exhibited significant negative regression coefficients that can be described as intermediate. Similarly, the newly developed scale explained a significant part of variance (an additional 5%) in viral behavioral intentions over and above other included variables. In the final model, which was able to explain 36% of variance, age (β = .11, p = .002), bullshit receptivity (β = .11, p = .002), reflectiveness (β = −.08, p = .013), trust in media (β = .14, p < .001), deepfake knowledge (β = .13, p < .001), message believability (β = .15, p < .001), and trustworthiness of content (β = .30, p < .001), which was the strongest predictor, significantly predicted the outcome. Other variables, including the trustworthiness of the presentation, did not significantly predict viral behavioral intentions.
6. Discussion
The purpose of the present paper was to present the conceptualization, development, and psychometric evaluation of the Perceived Deepfake Trustworthiness Questionnaire – a measure for assessing individuals’ perception of deepfake videos. Our work was conducted in three main phases: first, we developed the initial pool of items via reviewing existing studies, generating items based on interviews and online surveys, and using AI to generate additional items; second, we shortened and adapted the scale based on experts’ assessment of items’ content validity and general feedback and translated the English version into Italian and Slovene; third, we evaluated the questionnaire’s psychometric characteristics, i.e., conducted a cross-sectional survey in three countries, performed psychometric analyses and created the final version of the questionnaire.
In the analyses related to evaluating the psychometric characteristics of the questionnaire (RQ1), a two-factor solution emerged as superior to others (i.e., three- and six-factor solutions) investigated in exploratory factor analyses. Redundant and low-quality items were omitted, leading us to the final version of the questionnaire, which consists of 22 items loaded onto two factors, namely the perceived trustworthiness of the content and the perceived trustworthiness of the presentation. This internal structure was replicated in confirmatory factor analyses conducted on the whole sample and in the three subsamples (which correspond with the three language versions of the questionnaire), with the fit indices indicating a satisfactory to good fit. The results thus provide tangible support for the multi-dimensional nature of the questionnaire with two main factors that each include items referring to various content- and presentation-related aspects of deepfakes, enriching the array of tools (e.g., Hameleers et al., Citation2022; Hwang et al., Citation2021; Lee & Shin, Citation2022) available to measure individuals’ perception of deepfakes. Yet, the resulting scale is relatively short and, hence, not too time-consuming for participants. Similar fit indices were also observed when we split the sample into two approximately equal halves. Moreover, we found support for configural and metric invariance across the three language versions, suggesting that the factor structure and factor loadings are similar across different versions of the questionnaire (RQ2). As such, the questionnaire can be used in all three languages, allowing for cross-cultural comparisons. Both dimensions of the questionnaire exhibited good to excellent internal reliability in all three languages (RQ3).
In order to explore the construct validity of the questionnaire, we assessed its relations to various constructs suggested by previous literature. In line with our hypothesis (H10), the trustworthiness of content and the trustworthiness of presentation exhibited positive and robust associations with message believability – a previously developed measure capturing individuals’ perception of deepfakes (Hameleers et al., Citation2024). Similarly, scores on both dimensions were significantly higher when responding to the authentic compared to the manipulated video (H11). We also observed expected positive associations between age and both dimensions of trustworthiness, providing support for the notion that older individuals are more likely to trust deepfake videos (H1; Chen et al., Citation2023), potentially due to cognitive decline or cohort effects, such as lower digital literacy and awareness of deepfakes (Gaillard et al., Citation2021). On the other hand, education level was not significantly associated with the perceived trustworthiness of deepfakes. This result is a deviation from some of the previous findings (e.g., Chen et al., Citation2023) but is not unprecedented; for example, Roozenbeek and colleagues (Citation2020) found education to be a very weak predictor of susceptibility to misinformation about COVID-19 (pooled β = .04). Similarly, in the recent study by Doss and colleagues (Citation2023), education did not consistently moderate the ability to detect whether the video individuals were exposed to was authentic. Altogether, these findings suggest that skills needed to spot manipulated content and presentation are not necessarily acquired in the education system.
A detailed look at the associations between other hypothesized constructs and trustworthiness revealed an interesting pattern; as expected, political conservatism (H3), social media use for information (H4), bullshit receptivity (H5), and trust in media (H7) were all positively related to trustworthiness of the content, with bullshit receptivity emerging as an especially robust correlate across the included countries (Iacobucci et al., Citation2021; Pennycook & Rand, Citation2020; Roozenbeek et al., Citation2020; Sütterlin et al., Citation2023). These results show that illusory truth, inattention, and motivated cognition, all known to play a role in the general context of misinformation (van der Linden, Citation2022), are also relevant when judging deepfake videos. However, these variables were not significantly associated with the trustworthiness of the presentation. Similarly, reflectiveness (H6) and media literacy (H8) were both negatively related to the trustworthiness of the content, with reflectiveness exhibiting a particularly robust association (Hameleers et al., Citation2024; Hwang et al., Citation2021; Pennycook & Rand, Citation2020), but again not to the trustworthiness of the presentation. A potential reason for this discrepancy could be that previous studies that provided the basis for our hypotheses (e.g., Hameleers et al., Citation2023; Pennycook & Rand, Citation2020; Roozenbeek et al., Citation2020) mostly explored misinformation in general, the content conveyed by deepfakes, or general judgments of deepfakes’ authenticity instead of the presentation-related characteristics that are specific to deepfakes (e.g., whether the lips are in-sync with the audio). In fact, our literature review (see 3.1) also revealed that aspects of deepfakes that go beyond the presented information were more or less neglected in previous studies, although, as highlighted by our interviews and the online survey (see 3.2), they have a vital role in the perception of deepfakes. Altogether, our results suggest that the known risk and protective factors indeed influence how individuals perceive the presented information and its source but may not influence individuals’ ability to detect whether the presentation of the video has been manipulated. Further research on the factors associated with individuals’ ability to detect these nuances, which are specific to deepfakes, is needed.
We also observed an interesting association between trustworthiness and deepfake knowledge. While we hypothesized that individuals’ knowledge of deepfakes may decrease the perceived trustworthiness of deepfakes (H9; Hwang et al., Citation2021; Shin & Lee, Citation2022), we found a negative association with the trustworthiness of the presentation and a positive one with the trustworthiness of the content. Since the scale employed to assess deepfake knowledge (Ng, Citation2023) is specifically oriented towards this type of false information (e.g., “I know a lot about deepfakes”), it is possible that the respondents who perceived themselves as more knowledgeable regarding deepfakes are more familiar with the common technical features of deepfakes (e.g., blurriness, lower quality, out-of-sync lip movements), but do not necessarily possess more general critical skills needed to assess their content. For instance, a recent study (Goh, Citation2024) found that visual and auditory cues that might be present in a wide array of deepfakes may be easier to learn than features related to the content, which rely more on individuals’ general personal knowledge. Although the associations between deepfake knowledge and perceived trustworthiness differed between countries, they are worth exploring in future studies.
The results pertaining to the incremental validity of the PDTQ were mostly in line with our hypotheses H12-H13 (Shin & Lee, Citation2022; Tahir et al., Citation2021; Thaw et al., Citation2021). Specifically, the trustworthiness of the content negatively predicted video fakeness and positively predicted viral behavioral intentions over and above other known predictors, thus supporting our hypotheses. On the other hand, the trustworthiness of the presentation negatively predicted only perceived video fakeness but not viral behavioral intentions. These results suggest that individuals’ overall judgments regarding the authenticity of the video are driven by both dimensions, whereas the intention to spread the videos may be particularly driven by the trustworthiness of the content. Nonetheless, in the case of both outcomes, the questionnaire explained a significant additional share of variance, highlighting the added value of a more comprehensive measurement of deepfake perception.
6.1. Limitations and future directions
The present study and questionnaire have certain limitations and offer several directions for future research. While we used multiple deepfakes in earlier phases of our research (e.g., in interviews), we were somewhat limited by the availability of deepfakes and only used those that depicted known public figures. While we argue that public figures are more likely than unknown individuals to be the target of deepfakes, especially those with a severe impact, future studies may test whether our scale is also appropriate for deepfakes containing lesser-known individuals. Similarly, for practical reasons, the PDTQ’s psychometric characteristics were explored only on a single (political) deepfake video. While the scale was constructed with generalizability in mind, evident in the neutral response option that participants can choose if they cannot answer a particular item, future studies need to explore the generalizability of the PDTQ to other political and non-political deepfakes. As the scale is still relatively long for studies exposing subjects to multiple deepfake videos and so far limited to three languages, future studies may also establish a short version of the scale and validate the measure in other languages. Lastly, more research focusing on the relations between the perceived deepfake trustworthiness, particularly the presentation dimension, and other constructs.
6.2. Implications
Despite some limitations, our study substantially extends the existing body of research and, especially, the tools available by providing a comprehensive questionnaire dedicated to evaluating individuals’ perception of deepfakes. As our definition of the trustworthiness of deepfake videos is broad and includes several components of such messages, and the open-access nature of the instrument makes it possible for other researchers to use the questionnaire freely, the PDTQ has the potential to facilitate new knowledge on how individuals perceive deepfake content that, due to the developments in AI, is becoming more complex, more accessible to produce and more difficult to be accurately detected (e.g., Köbis et al., Citation2021). It is also available in three languages. The tool could, for example, be used in future studies exploring the moderating role of the two dimensions of perceived trustworthiness in the relationship between deepfake exposure and outcomes, such as attitudinal and behavioral change. It may also be used to determine individual characteristics related to the perceived trustworthiness of deepfakes, with the goal of identifying the most at-risk groups of individuals (in terms of their susceptibility to deepfakes). Moreover, PDTQ may prove valuable in studies investigating the effectiveness of interventions and educational programs aimed at improving the detection of deepfakes, as it can specifically pinpoint which aspect of deepfake recognition, either content- or presentation-related, has (or has not) been successfully tackled.
Additionally, we believe that the practical implications of PDTQ go beyond the academic community. Despite recent developments in algorithmic detection of deepfakes and the emergence of regulations such as the European Union’s AI act, it is also imperative to empower media consumers. PDTQ represents an important step towards this goal, as it may be used as the basis for raising awareness regarding deepfakes. For example, it may be used in educational workshops to engage the audience and discuss what deepfakes are, how they are created, and their potential impact, thus fostering skepticism towards videos on social media and other platforms. Even more importantly, PDTQ illuminates the strategies used by people to identify deepfakes, which may help develop educational materials and guidelines empowering individuals to successfully detect deepfakes and avoid potential manipulation.
7. Conclusions
In this study, we presented a novel conceptualization of the perceived trustworthiness of deepfake videos and developed a comprehensive questionnaire for its assessment. The PDTQ proved to be a reliable and measurement invariant tool, available in English, Italian, and Slovene, that can capture various aspects of individuals’ perception of deepfakes. As such, the PDTQ may aid future research oriented towards deepening our knowledge regarding this fast-evolving and socially important topic, as well as practical attempts to improve individuals’ deepfake recognition skills.
Author contributions
Nejc Plohl: Conceptualization, Methodology, Formal analysis, Investigation, Data curation, Writing – Original draft, Writing – Review & editing, Visualization. Izidor Mlakar: Conceptualization, Methodology, Writing – Review & editing, Supervision, Project administration, Funding acquisition. Letizia Aquilino: Conceptualization, Methodology, Investigation, Writing – Review & editing. Piercosma Bisconti: Conceptualization, Methodology, Writing – Review & editing, Supervision, Project administration, Funding acquisition. Urška Smrke: Conceptualization, Methodology, Investigation, Writing – Original draft, Writing – Review & editing.
Supplemental Material
Download MS Word (189.7 KB)Acknowledgements
The authors would like to thank Sara Barbič, Tea Glavič, Patricija Hauptman, Staša Hrženjak, Nika Keres, Nika Klemenčič, Tjaša Kotnik, Nina Movrin, Anika Pajer, Katarina Perger, Patricia Petek, and Noemi Santo for their help with data collection in step 3 (evaluation of psychometric characteristics) in Slovenia.
Disclosure statement
The authors declare that they have no known competing financial interests or personal relationships that could have appeared to influence the work reported in this paper.
Data availability statement
Data will be made available on request.
Additional information
Funding
Notes on contributors
Nejc Plohl
Nejc Plohl is an assistant professor at University of Maribor’s Department of Psychology. He obtained his PhD in psychology in 2023. His research focuses mainly on trust in science and technology, and discovering the diverse opportunities and risks of new technology, including its’ role in spreading misinformation.
Izidor Mlakar
Izidor Mlakar is a research associate at the University of Maribor’s Faculty of Electrical Engineering and Computer Science and the principal investigator of the HUMADEX research group. His research focuses on human-centric development, AI, embodied conversational agents, and user experience. He leads activities in multiple Horizon and national research projects.
Letizia Aquilino
Letizia Aquilino is a PhD candidate at Universita Cattolica del Sacro Cuore. Her research focuses on trust in human-robot interaction and AI systems. She is involved in the European project SOLARIS, analyzing risks and opportunities of generative AI. She earned her Master’s degree in Developmental Psychology in 2022.
Piercosma Bisconti
Piercosma Bisconti is the project leader of the European standard “AI Trustworthiness Framework,” which will support compliance with the EU AI Act. He is a researcher at the National Interuniversity Consortium for Computer Science and a co-founder of DEXAI – Artificial Ethics. He obtained a PhD from the Scuola Superiore Sant’Anna, and has published numerous works related to artificial intelligence and robotics.
Urška Smrke
Urška Smrke is a research associate at University of Maribor’s Faculty of Electrical Engineering and Computer Science, involved in various Horizon and national projects. With a background in psychology and a PhD in social sciences methodology, hear research focuses on social sciences methodology and applied psychology.
References
- Ahmed, S. (2021). Fooled by the fakes: Cognitive differences in perceived claim accuracy and sharing intention of non-political deepfakes. Personality and Individual Differences, 182, 111074. https://doi.org/10.1016/j.paid.2021.111074
- Alhabash, S., McAlister, A. R., Lou, C., & Hagerstrom, A. (2015). From clicks to behaviors: The mediating effect of intentions to like, share, and comment on the relationship between message evaluations and offline behavioral intentions. Journal of Interactive Advertising, 15(2), 82–96. https://doi.org/10.1080/15252019.2015.1071677
- Allcott, H., & Gentzkow, M. (2017). Social media and fake news in the 2016 election. Journal of Economic Perspectives, 31(2), 211–236. https://doi.org/10.1257/jep.31.2.211
- Al-Qaysi, N., Al-Emran, M., Al-Sharafi, M. A., Iranmanesh, M., Ahmad, A., & Mahmoud, M. A. (2024). Determinants of ChatGPT use and its impact on learning performance: An integrated model of BRT and TPB. International Journal of Human–Computer Interaction, 1–13. https://doi.org/10.1080/10447318.2024.2361210
- American Psychological Association (2023). 11 emerging trends for 2023. https://www.apa.org/monitor/2023/01/trends-report
- American Psychological Association (2024). 12 emerging trends for 2024. https://www.apa.org/monitor/2024/01/trends-report
- Bornstein, B. H., & Tomkins, A. J. (2015). Institutional trust: An introduction. In B. H. Bornstein in A. J. Tomkins (Ed.), Motivating cooperation and compliance with authority: The role of institutional trust (pp. 1–12). Springer.
- Bovet, A., & Makse, H. A. (2019). Influence of fake news in Twitter during the 2016 US presidential election. Nature Communications, 10(1), 7. https://doi.org/10.1038/s41467-018-07761-2
- Chandler, J., Rosenzweig, C., Moss, A. J., Robinson, J., & Litman, L. (2019). Online panels in social science research: Expanding sampling methods beyond Mechanical Turk. Behavior Research Methods, 51(5), 2022–2038. https://doi.org/10.3758/s13428-019-01273-7
- Chen, F. F. (2007). Sensitivity of goodness of fit indexes to lack of measurement invariance. Structural Equation Modeling: A Multidisciplinary Journal, 14(3), 464–504. https://doi.org/10.1080/10705510701301834
- Chen, S., Xiao, L., & Kumar, A. (2023). Spread of misinformation on social media: What contributes to it and how to combat it. Computers in Human Behavior, 141, 107643. https://doi.org/10.1016/j.chb.2022.107643
- Chi, O. H., Jia, S., Li, Y., & Gursoy, D. (2021). Developing a formative scale to measure consumers’ trust toward interaction with artificially intelligent (AI) social robots in service delivery. Computers in Human Behavior, 118, 106700. https://doi.org/10.1016/j.chb.2021.106700
- Doss, C., Mondschein, J., Shu, D., Wolfson, T., Kopecky, D., Fitton-Kane, V. A., Bush, L., & Tucker, C. (2023). Deepfakes and scientific knowledge dissemination. Scientific Reports, 13(1), 13429. https://doi.org/10.1038/s41598-023-39944-3
- Eristi, B., & Erdem, C. (2017). Development of a media literacy skills scale. Contemporary Educational Technology, 8(3), 249–267. https://doi.org/10.30935/cedtech/6199
- European Commission (2018). Action plan on disinformation: Commission contribution to the European Council. https://commission.europa.eu/publications/action-plan-disinformation-commission-contribution-european-council-13-14-december-2018_en
- Field, A. (2013). Discovering statistics using SPSS. SAGE.
- Gaillard, S., Oláh, Z. A., Venmans, S., & Burke, M. (2021). Countering the cognitive, linguistic, and psychological underpinnings behind susceptibility to fake news: A review of current literature with special focus on the role of age and digital literacy. Frontiers in Communication, 6, 661801. https://doi.org/10.3389/fcomm.2021.661801
- Goh, D. H.-L. (2024). “He looks very real”: Media, knowledge, and search-based strategies for deepfake identification. Journal of the Association for Information Science and Technology, 75(6), 643–654. https://doi.org/10.1002/asi.24867
- Götz, F. M., Maertens, R., Loomba, S., & van der Linden, S. (2023). Let the algorithm speak: How to use neural networks for automatic item generation in psychological scale development. Psychological Methods. Advance online publication. https://doi.org/10.1037/met0000540
- Hameleers, M., van der Meer, T. G., & Dobber, T. (2022). You won’t believe what they just said! The effects of political deepfakes embedded as vox populi on social media. Social Media and Society, 8(3), 20563051221116346. https://doi.org/10.1177/2056305122111634
- Hameleers, M., van der Meer, T. G., & Dobber, T. (2023). They would never say anything like this! Reasons to doubt political deepfakes. European Journal of Communication, 39(1), 56–70. https://doi.org/10.1177/0267323123118470
- Hameleers, M., van der Meer, T. G., & Dobber, T. (2024). Distorting the truth versus blatant lies: The effects of different degrees of deception in domestic and foreign political deepfakes. Computers in Human Behavior, 152, 108096. https://doi.org/10.1016/j.chb.2023.108096
- Hooper, D., Coughlan, J., & Mullen, M. R. (2008). Structural equation modeling: Guidelines for determining model fit. Electronic Journal of Business Research Methods, 6(1), 53–60.
- Hunsley, J., & Mash, E. J. (2008). A guide to assessments that work. Oxford University Press. https://doi.org/10.1093/med:psych/9780195310641.001.0001
- Hwang, Y., Ryu, J. Y., & Jeong, S. H. (2021). Effects of disinformation using deepfake: The protective effect of media literacy education. Cyberpsychology, Behavior and Social Networking, 24(3), 188–193. https://doi.org/10.1089/cyber.2020.0174
- Iacobucci, S., De Cicco, R., Michetti, F., Palumbo, R., & Pagliaro, S. (2021). Deepfakes unmasked: The effects of information priming and bullshit receptivity on deepfake recognition and sharing intention. Cyberpsychology, Behavior and Social Networking, 24(3), 194–202. https://doi.org/10.1089/cyber.2020.0149
- Jin, X., Zhang, Z., Gao, B., Gao, S., Zhou, W., Yu, N., & Wang, G. (2023). Assessing the perceived credibility of deepfakes: The impact of system-generated cues and video characteristics. New Media & Society. Advance online publication. https://doi.org/10.1177/14614448231199664
- Kiyonari, T., Yamagishi, T., Cook, K. S., & Cheshire, C. (2006). Does trust beget trustworthiness? Trust and trustworthiness in two games and two cultures: A research note. Social Psychology Quarterly, 69(3), 270–283. https://doi.org/10.1177/019027250606900304
- Köbis, N. C., Doležalová, B., & Soraperra, I. (2021). Fooled twice: People cannot detect deepfakes but think they can. iScience, 24(11), 103364. https://doi.org/10.1016/j.isci.2021.103364
- Lankton, N. K., McKnight, D. H., & Tripp, J, Marshall University (2015). Technology, humanness, and trust: Rethinking trust in technology. Journal of the Association for Information Systems, 16(10), 880–918. https://doi.org/10.17705/1jais.00411
- Lawshe, C. H. (1975). A quantitative approach to content validity. Personnel Psychology, 28(4), 563–575. https://doi.org/10.1111/j.1744-6570.1975.tb01393.x
- Lee, J., & Shin, S. Y. (2022). Something that they never said: Multimodal disinformation and source vividness in understanding the power of AI-enabled deepfake news. Media Psychology, 25(4), 531–546. https://doi.org/10.1080/15213269.2021.2007489
- Lewandowsky, S. (2021). Climate change disinformation and how to combat it. Annual Review of Public Health, 42(1), 1–21. https://doi.org/10.1146/annurev-publhealth-090419-102409
- Li, Z., Zhang, W., Zhang, H., Gao, R., & Fang, X. (2024). Global digital compact: A mechanism for the governance of online discriminatory and misleading content generation. International Journal of Human–Computer Interaction, 1–16. https://doi.org/10.1080/10447318.2024.2314350
- Maniaci, M. R., & Rogge, R. D. (2014). Caring about carelessness: Participant inattention and its effects on research. Journal of Research in Personality, 48, 61–83. https://doi.org/10.1016/j.jrp.2013.09.008
- Rubio, D. M., Berg-Weger, M., Tebb, S. S., Lee, E. S., & Rauch, S. (2003). Objectifying content validity: Conducting a content validity study in social work research. Social Work Research, 27(2), 94–104. https://doi.org/10.1093/swr/27.2.94
- Neylan, J., Biddlestone, M., Roozenbeek, J., & van der Linden, S. (2023). How to “inoculate” against multimodal misinformation: A conceptual replication of Roozenbeek and van der Linden (2020). Scientific Reports, 13(1), 18273. https://doi.org/10.1038/s41598-023-43885-2
- Ng, Y. L. (2023). An error management approach to perceived fakeness of deepfakes: The moderating role of perceived deepfake targeted politicians’ personality characteristics. Current Psychology, 42(29), 25658–25669. https://doi.org/10.1007/s12144-022-03621-x
- O’Connor, B. P. (2000). SPSS and SAS programs for determining the number of components using parallel analysis and Velicer’s MAP test. Behavior Research Methods, Instruments, and Computers, 32(3), 396–402. https://doi.org/10.3758/BF03200807
- Park, J., Kang, H., & Kim, H. Y. (2023). Human, do you think this painting is the work of a real artist? International Journal of Human–Computer Interaction, 1–18. https://doi.org/10.1080/10447318.2023.2232978
- Pennycook, G., Cheyne, J. A., Barr, N., Koehler, D. J., & Fugelsang, J. A. (2015). On the reception and detection of pseudo-profound bullshit. Judgment and Decision Making, 10(6), 549–563. https://doi.org/10.1017/S1930297500006999
- Pennycook, G., & Rand, D. G. (2020). Who falls for fake news? The roles of bullshit receptivity, overclaiming, familiarity, and analytic thinking. Journal of Personality, 88(2), 185–200. https://doi.org/10.1111/jopy.12476
- Pew Research Center (2022). US adults under 30 now trust information from social media almost as much as from national news outlets. https://www.pewresearch.org/short-reads/2022/10/27/u-s-adults-under-30-now-trust-information-from-social-media-almost-as-much-as-from-national-news-outlets/
- Pew Research Center (2023). Social media and news fact sheet. https://www.pewresearch.org/journalism/fact-sheet/social-media-and-news-fact-sheet/
- Plohl, N., & Musil, B. (2021). Modeling compliance with COVID-19 prevention guidelines: The critical role of trust in science. Psychology, Health & Medicine, 26(1), 1–12. https://doi.org/10.1080/13548506.2020.1772988
- Roozenbeek, J., Schneider, C. R., Dryhurst, S., Kerr, J., Freeman, A. L., Recchia, G., van der Bles, A. M., & Van Der Linden, S. (2020). Susceptibility to misinformation about COVID-19 around the world. Royal Society Open Science, 7(10), 201199. https://doi.org/10.1098/rsos.201199
- Rousseau, D. M., Sitkin, S. B., Burt, R. S., Camerer, C., Rousseau, D. M., & Burt, R. S. (1998). Not so different after all: A cross- discipline view of trust. Academy of Management Review, 23(3), 393–404. https://doi.org/10.5465/amr.1998.926617
- Samuels, P. (2017). Advice on exploratory factor analysis. Centre for Academic Success, Birmingham City University.
- Shin, S. Y., & Lee, J. (2022). The effect of deepfake video on news credibility and corrective influence of cost-based knowledge about deepfakes. Digital Journalism, 10(3), 412–432. https://doi.org/10.1080/21670811.2022.2026797
- Sirota, M., & Juanchich, M. (2018). Effect of response format on cognitive reflection: Validating a two-and four-option multiple choice question version of the Cognitive Reflection Test. Behavior Research Methods, 50(6), 2511–2522. https://doi.org/10.3758/s13428-018-1029-4
- Sison, A. J. G., Daza, M. T., Gozalo-Brizuela, R., & Garrido-Merchán, E. C. (2023). ChatGPT: More than a “weapon of mass deception” ethical challenges and responses from the human-centered artificial intelligence (HCAI) perspective. International Journal of Human–Computer Interaction, 1–20. https://doi.org/10.1080/10447318.2023.2225931
- Somoray, K., & Miller, D. J. (2023). Providing detection strategies to improve human detection of deepfakes: An experimental study. Computers in Human Behavior, 149, 107917. https://doi.org/10.1016/j.chb.2023.107917
- Stanescu, G. (2022). Ukraine conflict: The challenge of informational war. Social Sciences and Education Research Review, 9(1), 146–148. https://doi.org/10.5281/zenodo.6795674
- Suen, H. Y., & Hung, K. E. (2023). Building trust in automatic video interviews using various AI interfaces: Tangibility, immediacy, and transparency. Computers in Human Behavior, 143, 107713. https://doi.org/10.1016/j.chb.2023.107713
- Sütterlin, S., Ask, T. F., Mägerle, S., Glöckler, S., Wolf, L., Schray, J., Chandi, A., Bursac, T., Khodabakhsh, A., Knox, B. J., Canham, M., & Lugo, R. G. (2023). Individual deep fake recognition skills are affected by viewer’s political orientation, agreement with content and device used. In International Conference on Human-Computer Interaction (pp. 269–284). Springer Nature Switzerland.
- Tabachnick, B. G., Fidell, L. S., & Ullman, J. B. (2013). Using multivariate statistics. Pearson.
- Tahir, R., Batool, B., Jamshed, H., Jameel, M., Anwar, M., Ahmed, F., Zaffar, M. A., & Zaffar, M. F. (2021). Seeing is believing: Exploring perceptual differences in deepfake videos [Paper presentation]. Proceedings of the 2021 CHI Conference on Human Factors in Computing Systems (pp. 1–16). Association for Computing Machinery. https://doi.org/10.1145/3411764.3445699
- Talhelm, T., Haidt, J., Oishi, S., Zhang, X., Miao, F. F., & Chen, S. (2015). Liberals think more analytically (more “WEIRD”) than conservatives. Personality & Social Psychology Bulletin, 41(2), 250–267. https://doi.org/10.1177/0146167214563672
- Thaw, N. N., July, T., Wai, A. N., Goh, D. H. L., & Chua, A. Y. (2021). How are deepfake videos detected? An initial user study [Paper presentation]. Proceedings of the 23rd HCI International Conference, HCII 2021, Part 1 (pp. 631–636). Springer International Publishing. http://dx.doi.org/10.1007/978-3-030-78635-9_80
- Vaccari, C., & Chadwick, A. (2020). Deepfakes and disinformation: Exploring the impact of synthetic political video on deception, uncertainty, and trust in news. Social Media + Society, 6(1), 205630512090340. https://doi.org/10.1177/2056305120903408
- Valori, I., Jung, M. M., & Fairhurst, M. T. (2023). Social touch to build trust: A systematic review of technology-mediated and unmediated interactions. Computers in Human Behavior, 153, 108121. https://doi.org/10.1016/j.chb.2023.108121
- van der Linden, S. (2022). Misinformation: Susceptibility, spread, and interventions to immunize the public. Nature Medicine, 28(3), 460–467. https://doi.org/10.1038/s41591-022-01713-6
- van der Linden, S., Leiserowitz, A., Rosenthal, S., & Maibach, E. (2017). Inoculating the public against misinformation about climate change. Global Challenges (Hoboken, NJ), 1(2), 1600008. https://doi.org/10.1002/gch2.201600008
- Wilson, F. R., Pan, W., & Schumsky, D. A. (2012). Recalculation of the critical values for Lawshe’s content validity ratio. Measurement and Evaluation in Counseling and Development, 45(3), 197–210. https://doi.org/10.1177/0748175612440286
- Xu, X., Huang, Y., & Apuke, O. D. (2024). A quasi experiment on the effectiveness of social media literacy skills training for combating fake news proliferation. International Journal of Human–Computer Interaction, 1–11. https://doi.org/10.1080/10447318.2024.2311973
- Zarocostas, J. (2020). How to fight an infodemic. The Lancet, 395(10225), 676. https://doi.org/10.1016/S0140-6736(20)30461-X