
ABSTRACT
A survey was conducted to obtain up-to-date information and create a knowledge base on pond fish farming, local feed ingredients, and their nutritive properties in Rwanda. Sixty-seven pond-farms were randomly sampled from a population of 112 countrywide. Semi-intensive was the dominant (81%) farming-system and three fish species were cultured: Nile tilapia (Oreochromis niloticus), common carp (Cyprinus carpio), and North African catfish (Clarias gariepinus). Tilapia was the most commonly farmed species, and >50% of pond-farms were located in Northern and Southern provinces. There were 1–3 hatcheries per province, all producing tilapia. In total, 31 feed ingredients were identified, with rice, wheat, and maize bran being most commonly used. Feed analysis revealed high protein content (>350 g kg−1 CP) in local fishmeal, chicken viscera, and spent brewer’s yeast. Local ingredients and potential novel-feeds need further investigation prior to their confident use in fish diets to improve aquaculture at a low-cost in Rwanda.
Introduction
Globally, aquaculture is the fastest-growing animal food production sector which now provides over 50% of fish for human consumption and expected to continue to increase in the long term. Aquaculture has high potential to help meet the increasing global demand for aquatic foods created by worldwide population growth (FAO Citation2021; Stevens et al. Citation2018). In Africa, fish farming production is about 2.7% of the world fish farming production (Halwart Citation2020), led by Egypt, the largest producer (with 8.4% growth rate in the period 2009–2018) (FAO Citation2020). Additionally, SSA aquaculture has been led by countries like Nigeria, Uganda and Ghana, and has grown significantly over the last decade, from 106,000 tonnes in 2000 to 709,000 tonnes in 2018, with a farm-gate value of about USD 1.68 billion (FAO Citation2021). Most of the fish production in Africa comes from fresh water systems (99%) where tilapia and African catfish are the major cultured fish species (Adeleke et al. Citation2021).
Rwanda has the lowest per-capita consumption of protein in East Africa, far below the FAO recommendation for the world’s average of 32 g/capita/day at population level (FAO Citation2018b). Aquaculture is one way to increase the supply of high-value animal protein to the Rwandan population.
In Rwanda, aquaculture started in the 1940s as small-scale extensive pond farming. Since 1948, the nascent fish farming sector was fostered by the Belgian colonial administration (Dadzie Citation1992; FAO/UNDP Citation1981). In the 1960s-1970s, the main species raised in small-scale extensive pond systems in Rwanda were redbreast tilapia (Coptodon rendalli), longfin tilapia (Oreochromis macrochir), Nile tilapia (Oreochromis niloticus), smoothhead catfish (Clarias liocephalus), and common carp (Cyprinus carpio) (FAO/UNDP Citation1981). Common carp (Cyprinus carpio Linnaeus, 1758) was introduced to Rwanda from Israel in 1960 for aquaculture, while other carp strains were introduced from Uganda, and thus there are established carp populations in Rwandan rivers and lakes (De Vos, Snoeks, and Van Den Audenaerde Citation2001; Welcomme Citation1988). Data on aquaculture in Rwanda are scarce and outdated. Previous investigations date back to the 1980s-1990s, focus on socio-economic aspects, and consider only some parts of the country (Engle, Brewster, and Hitayezu Citation1993; Hishamunda, Curtis, and Upton Citation1998; Molnar, Rubagumya, and Adjavon Citation1991).
To date, Rwandan fish farmers practice extensive and semi-intensive farming by fertilizing their ponds with animal manure and dry grasses collected around the ponds, to support primary productivity in fishponds and enhance autotrophic and heterotrophic fish food production (El-Sayed Citation2006). In semi-intensive tilapia farming system supplemental feeding is required for tilapia farmed at densities >3 fish per m−2, as fish stocking density is an important factor that can potentially affect the amount of natural food available per fish in fertilized ponds (Bhujel Citation2013). Suitable timing for supplemental feeding is to grow the fish up to 100–150 g with fertilizers alone, followed by provision of supplemental feeds to 50% satiation (Diana, Lin, and Yi Citation1996). In intensive systems, fish feed is the single largest operating expense (50–70%) (Rumsey Citation1993), and has been identified as a significant limiting factor (FAO Citation2006). Protein is the most restricted nutrient in fish feed and, compared with adult fish, fry, and fingerlings have a higher protein requirement (30–40%) for optimal performance (Abdel-Tawwab et al. Citation2010; Siddiqui, Howlader, and Adam Citation1998). Fry and fingerlings are mostly fed with floating extruded pellets to obtain higher growth. An appropriate feeding management strategy should consider pellet size, feeding rate, and size grading before stocking, to improve commercial returns for farmers (Creswell Citation2005; Saoud et al. Citation2008). Use of fish oil in aquafeeds has raised sustainability concerns, prices have increased 3- to 4-fold in the past two decades alone and there is no foreseeable return to lower levels, and the supply from wild marine forage fish is being exceeded by growing demand, constituting an obstacle to aquaculture expansion (FAO Citation2016, Citation2018; Pauly and Zeller Citation2016). Potential fish oil substitutes include plant oils, stearidonic acid, and algae oils (Lenihan-Geels, Karen, and Ferguson Citation2013). Novel feeds such as spent brewer’s yeast (Saccharomyces cerevisiae), earthworm species such as Eisenia foetida, and various fly larvae have high nutritive value, high digestibility, and good essential amino acid (EAA) content (Bondari and Sheppard Citation1981; NRC, Citation2011; Sogbesan and Ugwumba Citation2007; St-Hilaire et al. Citation2007). These materials could thus be used as a sustainable protein source in fish feed. Previous studies in Rwanda identified several local feed ingredients with potential in African catfish and tilapia aquaculture, including soybean meal, cotton seed cake, sunflower oil cake, and groundnut oil cake (Munguti et al. Citation2012; Nyina-wamwiza, Wathelet, and Kestemont Citation2007).
Information on currently farmed species, pond-farm practices and management, locally available fish feeds, the nutritional value of feed ingredients, and other key inputs such as fingerling availability for aquaculture in different provinces of Rwanda is scarce or lacking. In the present study, a survey on aquaculture status was conducted to fill information gaps and identify currently available local feed ingredients. Laboratory analyses were performed to determine the nutritive value of these feed ingredients. The aim was to contribute baseline data on supplying future high-quality fish feed to support increased fish farming in Rwanda.
Material and methods
Study sites
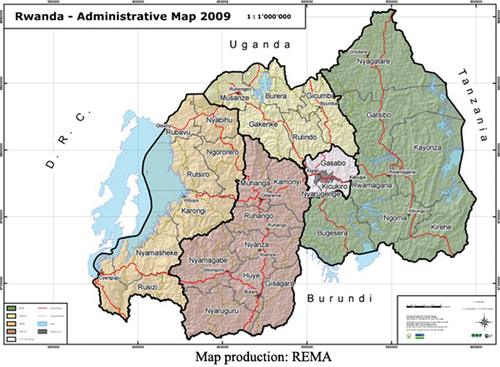
The study was conducted in all five provinces of Rwanda (Northern, Southern, Eastern, Western, Kigali City), subdivided into 30 districts (). Temperatures in Rwanda vary little throughout the year but there are some variations between regions, with the highest mean annual values found in Bugarama Valley in Western province (23–24°C) and in Eastern province (20–21°C). Northern province and parts of Western province, considered the country’s highlands, are the coldest agro-ecological zone (17–19°C) (Bonfils Citation2012).
Figure 1. Map of Rwanda showing its five provinces (Northern, Southern, Eastern, Western, Kigali City), all of which were included in this survey of pond fish farming activities.
Prior to the survey, a list of fish farms were obtained from the Ministry of Agriculture and Animal Resources (MINAGRI), Rwanda Agriculture Board (RAB), and complemented by existing recent information at the University of Rwanda (UR). From this initial list, active farms were selected and verified in collaboration with district directors of agriculture under the Ministry of Local Government (MINALOC), resulting in a final list of 212 fish farms. Inactive farms were either under rehabilitation, not yet stocked or abandoned due to other issues such as ponds filled with sands brought in by upstream erosion.
Field survey design
The survey was carried out from November 2017 to February 2018. A total of 67 farms were selected randomly from a study population of 212 pond fish farms, applying 95% confidence interval and 10% margin of error. The number of pond-farms differed across the five provinces. For the sample to be representative, randomization was performed at province level considering existing pond-farms in each province.
The survey respondents were the fish farm owners or representatives. They were asked to complete a structured survey questionnaire (see Supplementary Material), which was designed and pre-tested in a pilot study before use for gathering field data in the main survey. The survey contained 102 questions, both closed (36) and open-ended (66), grouped under the following headings: general information on the respondent and farm manager, farm practices and management, and feed and fertilization of the ponds. Data were collected through interviews, from farm records, and through on-site observations and sampling of feed ingredients. The interview team, consisted of three people, collected all data per farm. Farm visits and interviews were scheduled and agreed in advance with the respondents.
Feed ingredient sampling and proximate composition
Representative samples of 1–2 kg of feed ingredients commonly used by farmers and local fish feed makers were collected. Each feed ingredient sampled was placed separately in an appropriate container, labeled, transported to the laboratory, and stored at 4°C until analysis.
Proximate analyses of feed ingredients were performed at the food science laboratory of the College of Agriculture, Animal Sciences and Veterinary Medicine, University of Rwanda (Busogo campus), Northern Province, Rwanda. Moisture content was determined by oven-drying at 100–105°C to constant weight. Ash content was determined by incineration at 550°C for 4 h. Total nitrogen (N) content was determined by the Kjeldahl method (AOAC, Citation2000), and crude protein (CP) was calculated as N content × 6.25. Ether extract (EE) was measured using the Soxhlet method and crude fiber (CF) content was analyzed using standard methods (AOAC (Association of Official Analytical Chemists) Citation2000). Nitrogen-free extract (NFE) in dry matter (DM) was estimated by difference as: NFE (%) = 100-(CP(%)+EE(%)+CF(%)+Ash(%).
Data analysis
Data obtained from the survey and feed ingredient evaluation were recorded and analyzed using Microsoft Excel®. Results are presented as means and percentages using descriptive statistics.
Results
General description of survey respondents and farm ownership structure
Fish farm representatives were predominantly male (79%) and 75% of respondents were aged between 31 and 55 years (). Most fish farms were owned by cooperatives (63%), and the number of members per cooperative varied from 7 to 158. Approximately one-quarter (27%) of the farms were privately owned, while public institutions like secondary schools, universities, prisons, and religious institutions owned the remaining 10%. More than 70% of respondents had 4–9 years of fish farming experience. All respondents were engaged in other employment, such as mining, brick-making, teaching, a shop or other business, and have fish farming as side employment.
Table 1. General description of the survey respondents (N = 67) on fish farms in Rwanda.
Farm practices and management
Northern and Southern province had highest numbers of fish farms, followed by Eastern and Western province and Kigali City province (). The majority of the fish farms owned by respondents were earthen fishpond farms (98%). Two farms, located in Northern and Eastern province, used concrete ponds, and concrete and plastic-lined ponds, respectively. The oldest fish farm, established in 1943, was located in Western province. The number and size of farms in each province varied ().
Table 2. Total number of fish farms surveyed in Kigali City, Eastern, Southern, Western, and Northern province, Rwanda.
Nile tilapia, North African catfish, and common carp were the only cultured fish species reported country wide (). Respondents generally cultured tilapia in monoculture, with some differences in degree between provinces. This was especially evident in Kigali City province, where 89% of the farms practiced tilapia monoculture. Polyculture of tilapia with catfish was most prevalent in Southern province (). Previously introduced fish species, such as longfin tilapia, redbreast tilapia, and smoothhead catfish, were not reported on any farm.
Table 3. Distribution of fish species cultured in different provinces of Rwanda (% of fish farms per province).
A total of 11 active hatcheries were recorded in the country, while the number per province varied between one and three (). Most of the hatcheries were privately owned, run by individuals, had been in operation for less than 10 years, and produced only Nile tilapia. The maximum production capacity varied between hatcheries, ranging from 160,000 to 480,000 fingerlings annually (). Rwasave and Kigembe government farms, located in Southern province, had large hatcheries since 1950s, which produced both tilapia and catfish fingerlings. No hatchery produced carp fingerlings during the present study, but a few farms culture carp fingerlings captured from rivers and inland lakes.
Table 4. Number, location and capacity of surveyed fish hatcheries in Rwanda.
Feed for juveniles were reported to be expensive (1.30–1.60 US$/kg, by September 30, 2020) and rarely available, and most hatcheries (84.6%) reported a lack of fingerling feed. Average stocking density applied on all farms in all provinces was 2–3 fingerlings per m2, regardless of fish size. High stocking density of 5 fingerlings per m2 was reported in Kigali province only (). Typical earthen pond size was approximately 300 m2, and most farmers produced their own fingerlings in monoculture ponds. The majority of farmers (61%) reported constraints such as size differences; mainly small (<2 g), mixed sex, and high mortality of obtained fingerlings.
Table 5. Tilapia stocking density applied in different provinces in Rwanda (% of farms per province).
The majority of fish farms (81%) represented by respondents practiced a combination of agro-livestock and fish farming activities. All farms used organic fertilizers in their ponds to stimulate growth of the natural food web. The main fertilizers used were dried grasses, crop wastes like maize and rice stalks, and rabbit and poultry feces. In addition, 81% of respondents reported using supplemental feeding with dry feed, of which 67% used commercial feeds and 14% used feeds produced on-farm ().
Table 6. Fish-feeding strategy applied in different provinces in Rwanda (% of farms per province).
Feeding frequency was 1–4 times daily for the grow-out phase and up to eight times daily for fry. For the grow-out phase, 55% of respondents reported feeding twice daily, at around 09–10 h and 15–16 h, and all performed hand-feeding (). The majority of farms that regularly practiced supplementary feeding were in Kigali City province (89%) use of supplemental feeding showed a positive correlation with stocking density. Whereas, 50% of the farms located in Western province did not practise supplementary feeding.
Feed ingredient availability and proximate composition
The main feed ingredients used by fish farmers and local fish feed producers in different provinces were reported to be locally produced maize (Zea mays), wheat (Triticum aestivum), and rice (Oryza sativa), which were commonly used as broken, bran, and middling polishes (). Dried leaves from kidney beans (Phaseolus vulgaris), cassava (Manihot esculenta), and sweet potatoes (Ipomea batatus) were milled and used as leaf meal. Cassava and sweet potato tubers were utilized as starch sources. Soybean (Glycine max) and sunflower (Helianthus annus) seeds were used as an oil source, as meal, or as cake. Rice, wheat, maize, beans, and potatoes were cultivated to different extents in all five provinces. Brewer’s spent grains were available and used by farmers in Kigali City and Western province. Farmers in some cooperatives reported collecting cattle (Bos taurus) blood and poultry by-products, which they cooked and dried before use, and grinding bones and seashells for use in their fish feed production. Fish oil was rare and used only in small quantities. Fishmeal came from local small cichlids (Haplochromis spp.) and from two small cyprinid sardine species: Rastrineobola argentea, found in Lake Ruhondo in northern Rwanda or imported from Lake Victoria, Uganda, and clupeid Stolothrissa tanganicae imported from Lake Tanganyika, Tanzania ().
Table 7. Feed ingredients used by fish farmers and local fish feed producers in all five provinces of Rwanda. The ingredients are presented in descending order based on abundance for each category.
Feed ingredients from all five provinces were collected and analyzed for their proximate composition. The CP content of the ingredients varied between 67 and 701 g kg−1 DM, with the lowest content in kidney bean leaves and the highest in cattle blood meal (). Locally available fishmeal had a protein content of 549- to 614 g kg−1, while chicken viscera and spent brewer’s yeast had a protein content >350 g kg−1 CP (). Most agricultural by-products, industrial by-products, and plant leaves had low to medium CP content (<400 g kg−1 CP) and CF content for most commonly used grains in bran form, including rice and wheat bran, ranged between 126 and 159 g kg−1. The highest CF was found in soya bean meal (175 g kg−1) followed by agricultural by-products such as cottonseed meal (168.5 g kg−1) and rice bran (159.6 g kg−1). The highest lipid content (EE) was found in groundnut cake (268 g kg−1) and the lowest (16 g kg−1) in blood meal ().
Table 8. Proximate composition and energy content of local feed ingredients (g kg−1 DM).
Sugar molasses and broken maize had the highest content of NFE (708 and 684 g kg−1, respectively), while the lowest value was found in fishmeal (range 107–142 g kg−1) depending on species among the four used in fish meal Rwanda. Wheat displayed slightly higher protein content, and lower EE and ash content, than rice bran ().
Discussion
The present study surveyed the status of pond-fish farming across all five provinces of Rwanda, it also investigated currently available local feed ingredients, and evaluated their nutritive value. Tilapia was the most farmed species, more than half of pond-farms located in Northern and Southern provinces. One to three hatcheries existed in each province, all produced tilapia fingerlings. We identified 31 feed ingredients, rice, wheat, and maize bran were the most commonly used ingredients in the prevailing extensive and semi-intensive pond farming system in Rwanda.
General description of survey respondents and farm owner structure
More than 60% of the fish farms surveyed belonged to cooperatives, whereas, e.g.,, the aquaculture value chain development in Nigerian Egypt, Uganda, and Ghana is markedly driven by the private sector initiatives (Adeleke et al. Citation2021). Gender distribution among fish farm managers in Rwanda was predominantly male (79%), as reported previously for Rwanda and Tanzania (FAO Citation2017; Mmanda et al. Citation2020). The study by FAO (Citation2017) showed an equally skewed gender distribution of fish farmers in Sub-Saharan Africa (SSA) in general. A more equitable gender balance in aquaculture could help reduce household poverty, improve household decision-making, and result in better management of ponds, land, and capitals (Galiè et al. Citation2015; Johnson et al. Citation2016; Ndanga, Quagrainie, and Dennis Citation2013). However, achieving this under Rwandan conditions could be challenging, since most women in Rwandan aquaculture are typically engaged in most of the downstream, post-harvest and marketing activities mainly as fishmongers.
Similarly, young (16–30 years old) fish farmers are still scarce in Rwanda. Only 10% of the respondents belonged to this age category, which is even less than the 17% reported in 1991 by Hishamunda, Curtis, and Upton (Citation1998). In Rwanda, young people comprise 44.2% of the population and over 50% of the population in Africa is below 25 years of age (FAO Citation2014; NISR Citation2019). Young men are often employed as casual part-time workers, e.g., in pond construction and fish harvesting, while young women play a larger role in post-harvest steps but are often limited to sales and marketing (Cai, Leung, and Hishamunda Citation2009). Efforts are needed to achieve a more equal gender distribution in aquaculture and better integration of young people early on. This could contribute positively to aquaculture development and popularization, and also to economic growth.
Farm practices and management
Three fish species namely Nile tilapia, African catfish, and common carp, are currently the main farmed species in Rwanda, with tilapia being the dominant species (56–89%). The present findings are supported by those previously reported for countries in East Africa (Charo-Karisa et al. Citation2006; Gatachew Citation1987; Mbugua Citation2002). Moreover, Nile tilapia was mostly produced in monoculture and was the main species in polyculture, which is in line with findings by Vincke (Citation1987). African catfish was the second most farmed species in both monoculture and polyculture. It is mainly reared to control high tilapia populations in mixed ponds in Rwanda. In a previous study, Hishamunda, Curtis, and Upton (Citation1998) found that two more tilapia species were farmed in monoculture, namely longfin tilapia (2% of farms) and redbreast tilapia (0.1% of farms). In the present survey, these earlier introduced species, as well as Smoothhead catfish, were reported to be no longer farmed on any of the farms represented by respondents. It can be assumed that farming of these species in Rwanda has ceased, based on reported low growth rates (El-Sayed Citation2006; FAO/UNDP Citation1981).
Our results revealed that lack of fry and fingerling feed is a major constraint faced by hatchery operators in Rwanda. Commercial fingerling feeds are rare and expensive, and thus the price of fingerlings is high for many smallholder farmers. For tilapia, the most widely farmed species in Rwanda, early stage feeding is a general challenge for most hatcheries/farmers, due to lack of proper feed. We found that most hatchery owners use homemade feed, instead of imported feed, in order to lower the feed costs in fingerling production. Other hatchery owners mix a portion of commercial feed with available low-cost single ingredients, such as rice or wheat bran. Similar strategies are applied by farmers in the Mekong region of Vietnam, who mix manufactured fish feed with formulated poultry feed and plant by-products such as rice bran and sweet potato roots (Edwards and Allan Citation2004).
The present study finds an increased number of hatcheries countrywide in Rwanda compared with earlier reports by Hishamunda, Curtis, and Engle (Citation1996) and MINAGRI (Citation2011) shows an improvement in the fingerling supply situation.
Northern and Southern provinces have slightly higher numbers of pond-fish farms than the remaining provinces. Northern province is topographically diverse, featuring many rivers and high, steep slopes. Thus, a number of government and NGO projects in this province focus on environmental protection and flood and landslide erosion control. These projects have resulted in construction of bench and progressive terraces, fishponds, and buffer zone protections around water bodies, in order to improve land productivity and reduce soil erosion (MINAGRI Citation2014). This has created favorable conditions for fish farming, resulting in a higher number of fish farms in Northern province.
Southern province is best suited for cultivation of fish, due to relative high daily temperature and flat valley bottoms with very gentle slopes, which lend themselves to easy construction of ponds. Southern province also hosts two major and active public aquaculture stations, Rwasave and Kigembe, which were founded in 1952 and 1954, respectively. These continue to provide direct support to fish farmers in the form of extension services, seed, and other inputs, albeit with no reported or tangible increments (MINAGRI Citation2011). Based on our results, there is potential to increase the production and quality of catfish and tilapia fingerlings, but also to diversify and avail carp’s fingerlings needed by farmers. Lower numbers of fish ponds in Western province can be explained by presence of Lake Kivu, since both fishery activities and cage culture occur in the lake itself.
Our survey showed that, in the prevailing semi-intensive earthen pond farms in Rwanda, stocking is predominantly done with mixed-sex fingerlings. A small number of farmers currently produce their own mixed-sex fingerlings in their hatcheries. Male monosex tilapia culture is preferred, due to faster growth in males than females. In males, metabolic energy is channeled toward growth and anabolic growth-enhancing androgens are produced (Angienda, Aketch, and Waindi Citation2010; Tran-Duy et al. Citation2008). Monosex male tilapia in Rwanda are scarce, therefore it is important that hatchery operators have the capacity to progressively provide monosex male fingerlings to farmers to improve tilapia production in Rwanda.
On average, the most common stocking density reported by survey respondents was 2–3 fingerlings per m2, regardless of fish size, although a small proportion of farms (17.3%) stocked 4–5 fingerlings per m2. There are large discrepancies in recommended pond stocking densities. In Kenya, a stocking rate of 3 fish m−2 is commonly used in ponds to achieve yields of 1 kg per m−2 (Opiyo et al. Citation2018). According to Hishamunda, Curtis, and Engle (Citation1996), increasing the stocking density to about 3–4 fingerlings per m2 in semi-intensive systems increases yield. The optimal density is related to the overall cultivation strategy, and is influenced by the desired final fish size at harvest (Shumway and Parsons Citation2016). Fish stocking density is a key factor in the optimal management of fish culture. It affects the amounts of natural food available (in fertilized ponds) per fish, and the level of supplemental feeding required (Bhujel Citation2013). Increasing the stocking density on pond-farms in Rwanda to 4–5 fish m−2 could provide higher yield at harvest, provided that adequate supplemental feeding is practiced.
The majority of the farms surveyed (81%) practiced a combination of agro-livestock and fish farming activities. Respondents reported using only organic fertilizers in their ponds, such as animal manures, different dried grasses, and crop residues. The main fertilizers used were dried grasses, maize and rice stalks, and rabbit and poultry feces. Organic fertilizers include different plant-derived materials ranging from fresh or dried plant material to animal manures and litters to agricultural by-products (Das and Jana Citation2003). Most of commonly used fertilizers must undergo decomposition to release mainly the three primary plant nutrients nitrogen, phosphorus, and potassium for phytoplankton growth. The daily recommended application rate of these elements is 0.4 g N m−2 and 0.1–0.2 g P m−2 (Bhujel Citation2013). The farmers surveyed do not have experience or know the recommendations for fertilization, and rarely measure satiation or fertilizer dose, so it is likely that they end up over- or under-fertilizing their ponds. This is a challenge that needs to be addressed, as previous results show that tilapia reared in fertilized ponds and fed supplemental diets at 50%, 75%, and 100% satiation produce comparable yields, but the 50% level represents a considerable reduction in production costs and in nutrient loading (Lin and Yi Citation2003). Additionally, most tilapia grow-out ponds in Rwanda contain mixed sexes and ages, so it is difficult to know precisely the pellet size to utilize for adequate feeding. Little is known about the dietary nutrient requirements and supply for species cultured in fertilized pond systems, due to the difficulty in quantifying the contribution of naturally available food organisms (Rahman et al. Citation2006; Spataru, Wohlfarth, and Hulata Citation1983; Veverica et al. Citation2000). Nguyen et al. (Citation2018) demonstrated that simple feed with imbalanced nutrient content can be given to tilapia cultured in water with high primary production of natural feed. In our survey, feeding twice per day was the most common supplementary feeding regime used for grow-out ponds. Feeding frequency is an important factor for cultured fish and can affect overall growth, survival, and production of the fish (Macintosh and Little Citation1995; Phillips, Summerfelt, and Clayton Citation1998; Sanches and Hayashi Citation2001; Tung and Shiau Citation1991). In species such as tilapia with relatively small stomachs and continuous foraging behavior, multiple feeding can improve growth and feed efficiency (NRC (National Research Council) Citation2011; Shiau Citation2002).
We found that the average grow-out period on the surveyed farms ranged from six to nine months, and in most cases harvested fish were sold at the farm gate as fresh whole. This is in accordance with earlier findings that in semi-intensive aquaculture, where ponds are fertilized with manure and inorganic fertilizers, the production cycle is 6–9 months (Suresh, Citation2003).
Feed ingredients and their proximate composition
Our analyses showed that a range of ingredients widely available in Rwanda can potentially be used in fish feed formulation. All grain by-products tested had a low content of CP (<178 g kg−1 DM), but a high content of NFE (408–684 g kg−1 DM) (). These ranges are similar to those reported for other countries in East Africa, such as Tanzania and Kenya (Mmanda et al. Citation2020; Munguti et al. Citation2012). The fat content (EE) in sunflower oil cake (73 g kg−1 DM) differed considerably from that (244 kg−1 DM) reported by Mmanda et al. (Citation2020). Most of the ingredients identified in Rwanda have been studied previously in a mixture, as partial or total replacers for fishmeal for different fish species (El-Saidy and Gaber Citation2003; Khan, Siddique, and Zamal Citation2013; Liti et al. Citation2006). Nyina-wamwiza, Wathelet, and Kestemont (Citation2007) found that groundnut oil cake could replace 50% of fishmeal in the diet of North African catfish, without amino acid supplementation. However, anti-nutritional factors commonly found in a number of plant-based ingredients, and their effect on fish, should be considered during ingredient processing (Francis, Makkar, and Becker Citation2001). Most anti-nutrient and toxic effects of these compounds can be destroyed by processing methods such as soaking, germination, heat processing (boiling and autoclaving), fermentation, or by genetic manipulation, without altering the nutritional value (Hamid, Thakur, and Kumar Citation2017). Additionally, plant by-products contribute high levels of indigestible organic matter in the form of insoluble plant fibers and often contain low levels of limiting amino acids (lysine, methionine, tryptophan) (Gorissen et al. Citation2018; Naylor et al. Citation2009). In cases of full substitution of animal protein with plant protein in formulated fish feeds, supplementation with (synthetic) lysine and methionine is necessary. Sweet potato leaves meal had slightly lower CP content (318 g kg−1) and could be comparable with 359 g kg−1 DM reported in previous studies (Munguti et al. Citation2012). Such differences maybe a natural variation related to the growing environment, leaf maturity stage at harvest, or analytical method used (Church Citation1980; McDonald et al. Citation2002). Sweet potato is cultivated on 89,427 ha across Rwanda (NISR, Citation2020) and its leaves are an important feed ingredient available country-wide.
Fishmeal available and used in Rwanda is made from relatively low-grade fish species, predominantly sun-dried sardines (Rastrineobola argentea and Stolothrissa tanganicae, both known locally as “ndagaa”). These indigenous pelagic fish species from Lake Victoria and Lake Tanganyika, respectively, have been introduced in Lake Ruhondo and Kivu in Rwanda (De Vos, Snoeks, and Van Den Audenaerde Citation2001). R. argentea is the most used, and its proximate composition was consistent with most previous findings in East Africa (Mmanda et al. Citation2020; Munguti et al. Citation2012). Despite its high cost compared with other ingredients used for feed formulation, fishmeal is an ideal source of protein in feeds for most fish species. However, high demand for these small sardines, both as fishmeal and for direct human consumption, makes their use in feed formulations expensive (1500–6000 Rwandan francs (equivalent to 2–7 US$, by July 7th 2018) per kg dry weight), but also non-sustainable, since they can be used directly as human food. Therefore, replacement of fishmeal with other ingredients from sustainable sources not used as human food would be beneficial in reducing feed costs and food fish prices, especially in landlocked developing countries such as Rwanda.
Other locally identified ingredients of animal origin include blood meal, poultry by-products, and fishery by-products. These ingredients are inexpensive, readily available, and suitable for aquaculture diets, and may be good alternative protein source for use in fish feed. Feed containing 10% blood meal has been found to be most efficient in terms of total tilapia fish production, average weight gain, and average final fish weight (Otubusin Citation1987). According to Sabbagha et al. (Citation2019), total substitution of fishmeal with poultry by-product meal in the commercial diet of gilthead sea bream (Sparus aurata) is achievable without compromising fish growth performance, fish welfare, or fillet quality. Poultry by-product meal is palatable and has a high protein content and an EAA profile similar to fishmeal, but contains low levels of dietary methionine and lysine (Bureau, Harris, and Cho Citation1999; González‐Rodríguez et al. Citation2016; NRC (National Research Council) Citation2011). However, combining the poultry by-product meal in tilapia feed recipes with other available lysine-rich ingredients such as fishery by-products or fish skeletons could be a solution (Ahmed and Khan Citation2004).
Brewer’s yeast biomass is the second major by-product from the brewing industry in Rwanda. Our survey found that spent brewers’ yeast is available for use as a major ingredient in fish diets in Rwanda. However, despite its proximate composition featuring high CP content (380 g kg−1 DM), it is not currently used in fish feed formulation in Rwanda. Brewer’s yeast has been used in aquaculture elsewhere since the 1990s and is a potential high-volume alternative to fishmeal protein in the diet of Nile tilapia (Agboola et al. Citation2020; Nguyen et al. Citation2018). Based on our survey results, fish oil is rarely used in Rwanda, most likely due to low availability and high market price but also because freshwater fish, including tilapia, have a low lipid requirement and can be satisfied with C18 PUFA at around 1% of diet dry weight (NRC (National Research Council) Citation2011; Tocher Citation2010). Alternatively, plant oil sources such as sunflower oil, crude palm oil, and soybean oil locally available in Rwanda can be used. Currently, sunflower oil is the most commonly used.
The proximate composition of local feed ingredients was generally within the range reported in previous studies, apart from some values for individual feed ingredients reported within East Africa (Mmanda et al. Citation2020; Munguti et al. Citation2012; Nyina-wamwiza, Wathelet, and Kestemont Citation2007). However, the proximate composition of feed ingredients may vary due to many factors, such as climate conditions, production season, geographical zone, soil type, stage of maturity at harvest, animal species, processing, handling, storage, and contamination by mycotoxin and other toxic compounds (Church Citation1980).
In summary, aquaculture in Rwanda is dominated by Nile tilapia, farmed mainly in semi-intensive systems. Fish farming practices generally indicate lack of training and management skills, reflected in relatively low production levels and inadequate use of resources. These are thus potential areas for improvement. Many of the potential feed ingredients analyzed in this study are available in all five provinces of Rwanda. Although relatively expensive, fishmeal is still used as the main protein source. Use of novel feeds can be a sustainable strategy in future aquaculture development. Efficient use of existing local ingredients, considering their proximate composition, could decrease fishmeal use and allow production of less expensive fish feed locally. This would contribute to more sustainable aquaculture production and improved food security in Rwanda. However, the suitability of local feed ingredients (and their EAA profile) and novel feeds for use in Nile tilapia and catfish feeds needs further assessment, preferably in vivo, before their use by Rwandan fish feed producers and farmers can be recommended.
Acknowledgments
The authors would like to express sincere thanks to the Rwanda’s local government officials in provinces, district offices countrywide for the permit offered and support during the present study. A special thanks is expressed to the laboratory technicians in the UR-FFRS at Rwasave, and Busogo campus in the College of Agriculture, Animal Sciences and Veterinary Medicine/ University of Rwanda for their valuable help during samples handling and proximate analysis. This study was financially supported by the Swedish International Development Cooperation Agency (SIDA) through the UR-Sweden programme for Research, Higher Education, and Institutional Advancement, more specially the Swedish University of Agricultural Sciences (SLU). We are very grateful for their scientific guidance as well as the finances allocated to this study.
Disclosure statement
No potential conflict of interest was reported by the author(s).
Additional information
Funding
References
- Abdel-Tawwab, M., M. H. Ahmad, Y. A. E. Khattab, and A. M. E. Shalaby. 2010. Effect of dietary protein level, initial body weight, and their interaction on the growth, feed utilization, and physiological alterations of Nile Tilapia, Oreochromis niloticus (L.). Aquaculture 2 (98):267–74. doi:10.1016/j.aquaculture.2009.10.027.
- Adeleke, B., D. Robertson-Andersson, G. Moodley, and S. Taylor. 2021. Aquaculture in Africa: A comparative review of Egypt, Nigeria, and Uganda Vis-À-Vis South Africa. Reviews in Fisheries Science & Aquaculture 29 (2):167–97. doi:10.1080/23308249.2020.1795615.
- Agboola, J. O., M. Øverland, A. Skrede, and J. Ø. Hansen. 2020. Yeast as major protein-rich ingredient in aquafeeds: A review of the implications for aquaculture production. Reviews in Aquaculture 1–22. doi:10.1111/raq.12507.
- Ahmed, I., and M. A. Khan. 2004. Dietary lysine requirement of fingerling Indian major carp, Cirrhinus mrigala (Hamilton). Aquaculture 235 (14):499–511. doi:10.1016/j.aquaculture.2003.12.009.
- Angienda, P. O., B. O. Aketch, and E. N. Waindi. 2010. Development of all-male fingerlings by heat treatment and the genetic mechanism of heat induced sex determination in Nile tilapia (Oreochromis niloticus L.). International Journal of Biological and Life Sciences 6:38–43.
- AOAC (Association of Official Analytical Chemists). 2000. Official methods of analysis of AOAC International (17th ed.). Gaithersburg, MD, USA: AOAC International.
- Bhujel, R. C. 2013. On-farm feed management practices for Nile tilapia (Oreochromis niloticus) in Thailand. In On-farm feeding and feed management in aquaculture. ed. M. R. Hasan and M. B. New, 159–89. Rome: FAO. FAO Fisheries and Aquaculture Technical Paper No. 583.
- Bondari, K., and D. C. Sheppard. 1981. Soldier fly larvae as feed in commercial fish productions. Aquaculture 24:103–09. doi:10.1016/0044-8486(81)90047-8.
- Bonfils, S. 2012. Trend analysis of the mean annual temperature in Rwanda during the last fifty two years. Journal of Environmental Protection 3 (6):538–51. doi:10.4236/jep.2012.36065.
- Bureau, D. P., A. M. Harris, and C. Y. Cho. 1999. Apparent digestibility of rendered animal protein ingredients for rainbow trout (Oncorhynchus mykiss). Aquaculture 180 (34):345–58. doi:10.1016/S0044-8486(99)00210-0.
- Cai, J., P. S. Leung, and N. Hishamunda. 2009. Assessment of comparative advantage in aquaculture. FAO Fisheries and Aquaculture Technical Paper; No. 528. Rome, FAO. 87p.
- Charo-Karisa, H., H. Komena, S. Reynolds, M. A. Rezk, R. W. Ponzoni, and H. Bovenhuis. 2006. Genetic and environmental factors affecting growth of Nile tilapia (Oreochromis niloticus) juveniles: Modelling spatial correlations between hapas. Aquaculture 255 (14):586–96. doi:10.1016/j.aquaculture.2005.11.041.
- Church, D. C. 1980. Digestive physiology and nutrition of ruminants. Volume 3-practical nutrition. 2nd ed. Oregon: O., & B Books, Inc. USA.
- Creswell, D. 2005. The feeding and nutrition of the tilapia. AQUA Culture AsiaPacific magazine, November/December, pp. 32–33.
- Dadzie, S. 1992. An overview of Aquaculture in Eastern Africa. Hydrobiologia 232 (1):99–110. doi:10.1007/BF00014618.
- Das, S. K., and B. B. Jana. 2003. Pond fertilization regimen: State-of-the-art. Journal of Applied Aquaculture 13 (12):35–66. doi:10.1300/J028v13n01_03.
- De Vos, L., J. Snoeks, and D. T. Van Den Audenaerde. 2001. An annotated checklist of the fishes of Rwanda (East Central Africa), with historical data on introductions of commercially important species. Journal of East African Natural History 90 (1):41–68. doi:10.2982/0012-8317(2001)90[41:AACOTF]2.0.CO;2.
- Diana, J. S., C. K. Lin, and Y. Yi. 1996. Stocking density and supplemental feeding. Pond Dynamics/Aquaculture CRSP.PD/ACRSP Fourteenth Annual Administrative Report. 133–38
- Edwards, P., and G. L. Allan, ed. 2004. Feeds and feeding for inland aquaculture in Mekong region countries. ACIAR Technical Reports No. 56. 136p.
- El-Saidy, D. M. S. D., and M. Gaber. 2003. Replacement of fishmeal with a mixture of different plant protein sources in juvenile Nile tilapia, Oreochromis niloticus (L.) diets. Aquaculture Research 34 (13):1119–27. doi:10.1046/j.1365-2109.2003.00914.x.
- El-Sayed, A. F. M. 2006. Tilapia culture. Wallingford, UK: CAB International.
- Engle, C. R., M. Brewster, and F. Hitayezu. 1993. An economic analysis of fish production in a subsistence agricultural economy: The case of Rwanda. Journal of Aquaculture in the Tropics 8:151–65.
- FAO/UNDP. 1981. Aquaculture development in Rwanda. Based on the feasibility report of U. W. Schmidt & M. M. J. Vincke. ADCP/MR/81/12. 69 pp.
- FAO. 2006. The state of the world fisheries and aquaculture. Rome, Italy: FAO.
- FAO. 2014. Fisheries and aquaculture technical paper. . MDG Centre.http://www.fao.org/assets/infographics/FAO-Infographic-Youth-Aquaculture-Africa-en.pdf.
- FAO. 2016. The state of world fisheries and aquaculture 2016: Contributing to food security and nutrition for all. http://www.franciscoblaha.info/blog/2016/7/8/the-state-of-the-world-fisheries-and-aquaculture-2016.
- FAO. 2017. Regional review on status and trends in aquaculture development in sub-Saharan Africa – 2015, by Benedict P. Satia. FAO Fisheries and Aquaculture Circular No. 1135/4. Rome, Italy.
- FAO. 2018b. World aquaculture performance indicators (WAPI)—Fish consumption module (WAPI-FISHCSP v.2018.1). Rome, Italy: FAO. 2018.
- FAO. 2018. The state of world fisheries and aquaculture 2018: Meeting the sustainable development goals. https://reliefweb.int/report/world/state-world-fisheries-and-aquaculture-2018.
- FAO. 2020. The state of world fisheries and aquaculture 2020. Rome: Sustainability in action. doi:10.4060/ca9229en.
- FAO. 2021. FAO aquaculture news. No. 63 (May). Rome. http://www.fao.org/3/cb4850en/cb4850en.pdf
- Francis, G., H. P. S. Makkar, and K. Becker. 2001. Antinutritional factors present in plant derived alternate fish feed ingredients and their effects in fish. Aquaculture 199 (34):197–227. doi:10.1016/S0044-8486(01)00526-9.
- Galiè, A., A. Mulema, M. A. Mora Benard, S. N. Onzere, and K. E. Colverson. 2015. Exploring gender perceptions of resource ownership and their implications for food security among rural livestock owners in Tanzania, Ethiopia, and Nicaragua. Agriculture & Food Security 4 (1):2. doi:10.1186/s40066-015-0021-9.
- Gatachew, T. A. 1987. A study on an herbivorous fish, Oreochromis niloticus L., diet and its quality in two Ethiopian Rift Valley lakes, Awasa and Zwai. Journal of Fish Biology 30 (4):439–49. doi:10.1111/j.1095-8649.1987.tb05767.x.
- González‐Rodríguez, Á., J. D. Celada, J. M. Carral, M. Sáez‐Royuela, V. García, and J. B. Fuertes. 2016, 47. Evaluation of poultry by‐product meal as partial replacement of fish meal in practical diets for juvenile tench (Tinca tinca L.). Aquaculture Research 47 (5): 1612–21. doi:10.1111/are.12622.
- Gorissen, S. H. M., J. J. R. Crombag, J. M. G. Senden, W. A. H. Waterval, J. Bierau, L. B. Verdijk, and L. J. C. van Loon. 2018. Protein content and amino acid composition of commercially available plant-based protein isolates. Amino Acids 50 (12):1685–95. doi:10.1007/s00726-018-2640-5.
- Halwart, M. 2020. Fish farming high on the global food system agenda in 2020. FAO Aquaculture Newsletter 61:II–III.
- Hamid, H., N. S. Thakur, and P. Kumar. 2017. Anti-nutritional factors, their adverse effects and need for adequate processing to reduce them in food. Agric International 4 (1):56. doi:10.5958/2454-8634.2017.00013.4.
- Hishamunda, N., M. J. Curtis, and C. R. Engle. 1996. Estimating Oreochromis nilotica production function for small-scale fish culture in Rwanda. Journal of Aquaculture in the Tropics 11:49–5.
- Hishamunda, N., M. J. Curtis, and H. L. Upton. 1998. Evaluating and managing risk in small scale fish farming in a developing economy: An application to Rwanda. Aquaculture Economics & Management 2 (1):31–39. doi:10.1080/13657309809380212.
- Johnson, N. L., C. Kovarik, R. Meinzen-Dick, J. Njuki, and A. Quisumbing. 2016. Gender, assets, and agricultural development: Lessons from eight projects. World Development 83:295–311. doi:10.1016/j.worlddev.2016.01.009.
- Khan, M. S. K., M. A. M. Siddique, and H. Zamal. 2013. Replacement of fish meal by plant protein sources in Nile tilapia (Oreochromis niloticus) diet: Growth performance and utilization. Iranian Journal of Fisheries Sciences 12:855–63.
- Lenihan-Geels, G., S. B. Karen, and L. R. Ferguson. 2013. Alternative sources of omega-3 fats: Can we find a sustainable substitute for fish? Nutrients 5 (4):1301–15. doi:10.3390/nu5041301.
- Lin, C. K., and Y. Yi. 2003. Minimizing environmental impacts of freshwater aquaculture and reuse of pond effluents and mud. Aquaculture 226 (14):57–68. doi:10.1016/S0044-8486(03)00467-8.
- Liti, D. M., R. M. Mugo, J. M. Munguti, and H. Waidbacher. 2006. Growth and economic performance of Nile tilapia (Oreochromis niloticus L.) fed on three brans (maize, wheat and rice) in fertilized ponds. Aquaculture Nutrition 12 (3):239–45. doi:10.1111/j.1365-2095.2006.00397.x.
- Macintosh, D. J., and D. C. Little. 1995. Nile Tilapia Oreochromis niloticus. In Broodstock management and larval quality, ed. N. R. Bromage, and R. J. Roberts), 277–320. Oxford: Blackwell Science.
- Mbugua, H. M. 2002. The role of fisheries department in aquaculture development in Kenya. Samaki News: A Magazine of the Department of Fisheries of Kenya 1:24–30.
- McDonald, P., R. A. J. Edwards, F. D. Greenhalgh, and C. A. Morgan. 2002. Animal nutrition, 583–89. 6th ed. Essex, UK: Pearson Education Limited.
- MINAGRI. 2011. http://extwprlegs1.fao.org/docs/pdf/rwa151563.pdf. Kigali, Rwanda: Ministry of Agriculture and Animal Resources.
- MINAGRI 2014. Ministry of agriculture and animal resources, Republic of Rwanda. Annual report. 299pp.
- Mmanda, P. F., D. P. Mulokozi, J. E. Lindberg, H. A. Norman, M. Mtolera, R. Kitula, and T. Lundh. 2020. Fish farming in Tanzania: The availability and nutritive value of local feed ingredients. Journal of Applied Aquaculture 32 (4):341–60. doi:10.1080/10454438.2019.1708836.
- Molnar, J. J., A. Rubagumya, and V. Adjavon. 1991. Sustainability of aquaculture as a farm enterprise in Rwanda. Journal of Applied Aquaculture 1 (2):37–62. doi:10.1300/J028v01n02_03.
- Munguti, J., H. Charo-Karisa, M. A. Opiyo, E. O. Ogello, E. Marijani, L. Nzayisenga, and D. Liti. 2012. Nutritive value and availability of commonly used feed ingredients for farmed Nile tilapia (Oreochromis niloticus L.) and African catfish (Clarias gariepinus, Burchell) in Kenya, Rwanda and Tanzania. African Journal of Food, Agriculture, Nutrition and Development 12 (51):6135–55. doi:10.18697/ajfand.51.11085.
- National Institute of Statistics of Rwanda (NISR). December 2020. Upgraded seasonal agricultural survey annual report.
- Naylor, R. L., R. W. Hardy, D. P. Bureau, A. Chiu, M. Elliott, A. P. Farrell, I. Forster, D. M. Gatlin, R. J. Goldburg, K. Hua, et al. 2009. Feeding aquaculture in an era of finite resources Proceedings of the National Academy of Sciences of the United States of America 106 (36):15103–10. doi:10.1073/pnas.0905235106.
- Ndanga, L. Z. B., K. K. Quagrainie, and J. H. Dennis. 2013. Economically feasible options for increased women participation in Kenyan aquaculture value chain. Aquaculture 414415:183–90. doi:10.1016/j.aquaculture.2013.08.012.
- Nguyen, N. H. Y., C. T. Da, T. Lundh, T. T. Lan, and A. Kiessling. 2018. Comparative evaluation of Brewer’s yeast as a replacement for fishmeal in diets for tilapia (Oreochromis niloticus), reared in clear water or biofloc environments. Aquaculture 495:654–60. doi:10.1016/j.aquaculture.2018.06.035.
- NISR. 2019. National institute of statistics of Rwanda, labour force survey trends, both August and October 2019.
- NRC (National Research Council). 2011. Nutrient requirements of fish and shrimp. US states: National academies press.
- Nyina-wamwiza, L., B. Wathelet, and P. Kestemont. 2007. Potential of local agricultural by-products for the rearing of African catfish, Clarias gariepinus in Rwanda: Effects on growth feed utilization and body composition. Aquaculture Research 38 (2):206–14. doi:10.1111/j.1365-2109.2007.01658.x.
- Opiyo, M. A., E. Marijani, P. Muendo, R. Odede, W. Leschen, and H. Charo-Karisa. 2018. A review of aquaculture production and health management practices of farmed fish in Kenya. International Journal of Veterinary Science and Medicine 6 (2):141–48. doi:10.1016/j.ijvsm.2018.07.001.
- Otubusin, S. O. 1987. Effects of different levels of blood meal in pelleted feeds on tilapia, Oreochromis niloticus, production in floating bamboo net-cages. Aquaculture 65 (34):263–66. doi:10.1016/0044-8486(87)90239-0.
- Pauly, D., and D. Zeller. 2016. Catch reconstructions reveal that global marine fisheries catches are higher than reported and declining. Nature Communications 7 (1):10244–10244. doi:10.1038/ncomms10244.
- Phillips, T. A., R. C. Summerfelt, and R. D. Clayton. 1998. Feeding frequency effects on water quality and growth of walleye fingerlings in intensive culture. The Progressive Fish-Culturist 60 (1):1–8. doi:10.1577/1548-8640(1998)060<0001:FFEOWQ>2.0.CO;2.
- Rahman, M. M., M. C. J. Verdegem, L. A. J. Nagelkerke, M. A. Wahab, A. Milstein, and J. A. J. Verreth. 2006. Growth, production and food preference of rohu Labeo rohita (H.) in monoculture and in polyculture with common carp Cyprinus carpio (L.) under fed and non-fed ponds. Aquaculture 257 (14):359–72. doi:10.1016/j.aquaculture.2006.03.020.
- Rumsey, G. L. 1993. Fishmeal and alternative sources of proteins. Fisheries and Aquaculture Department. FAO, 18: p. 14–19.
- Sabbagha, M., R. Schiavone, G. Brizzi, B. Sicuro, L. Zilli, and S. Vilella. 2019. Poultry by-product meal as an alternative to fish meal in the juvenile gilthead seabream (Sparus aurata) diet. Aquaculture 511:734–220.
- Sanches, L. E. F., and G. Hayashi. 2001. Effect of feeding frequency on Nile tilapia, Oreochromis niloticus (L.) fries performance during sex reversal in hapas. Maringa 23:871–76.
- Saoud, P., A. D. Davis, L. A. Roy, and R. P. Phelps. 2008. Evaluating the benefits of size-sorting Tilapia fry before stocking. Journal of Applied Aquaculture 17 (4):73–85. doi:10.1300/J028v17n04_05.
- Shiau, S. Y. 2002. Tilapia, Oreochromis spp. In Nutrient requirements and feeding of finfish for aquaculture, ed. C. D. Webster and C. E. Lim, 273–92. Wallingford, UK: CABI Publishing.
- Shumway, S., and Parsons, J. 2016. Scallops: Biology, ecology, aquaculture, and fisheries. 3rd edn. Developments in aquaculture and fisheries science. Oxford, UK: Elsevier Science, 1214 pp.
- Siddiqui, A. Q., M. S. Howlader, and A. A. Adam. 1998. Effects of dietary protein levels on growth, feed conversion and protein utilization in fry and young Nile tilapia, Oreochromis niloticus. Aquaculture 70 (12):63–73. doi:10.1016/0044-8486(88)90007-5.
- Sogbesan, O. A., and A. A. A. Ugwumba. 2007. Growth performance and nutrient composition of Bufo maculata (Linneus) tadpole fed different practical diets as fish meal substitute. African Journal of Biotechnology 6 (18):2177–83. doi:10.5897/AJB2007.000-2342.
- Spataru, P., G. W. Wohlfarth, and G. Hulata. 1983. Studies on the natural food of different fish species in intensively manured polyculture ponds. Aquaculture 35:283–98. doi:10.1016/0044-8486(83)90101-1.
- St-Hilaire, S. C., J. K. Sheppard, S. Tomberlin, L. Irving, M. A. Newton, E. E. McGuire, R. H. Mosley, and W. Sealey. 2007. Fly Prepupae as a feedstuff for Rainbow Trout, Oncorhynchus mykiss. Journal of the World Aquaculture Society 38 (1):59–67. doi:10.1111/j.1749-7345.2006.00073.x.
- Stevens, J. R., R. W. Newton, M. Tlusty, and D. C. Little. 2018. The rise of aquaculture by-products: Increasing food production, value, and sustainability through strategic utilisation. Marine Policy 90:115–24. doi:10.1016/j.marpol.2017.12.027.
- Suresh, V. 2003. Tilapias. In Aquaculture: Farming aquatic animals and plants. Fishing news books, ed. J. S. Lucas and P. C. Southgate, 321–45. UK: Blackwell Publishing Company.
- Tocher, D. R. 2010. Fatty acid requirements in ontogeny of marine and freshwater fish. Aquaculture Research 41 (5):717–32. doi:10.1111/j.1365-2109.2008.02150.x.
- Tran-Duy, A., J. W. Schrama, A. A. Van Dam, and J. A. J. Verreth. 2008. Effects of oxygen concentration and body weight on maximum feed intake, growth and hematological parameters of Nile tilapia, Oreochromis niloticus. Aquaculture 275 (14):152–62. doi:10.1016/j.aquaculture.2007.12.024.
- Tung, P.-H., and S.-Y. Shiau. 1991. Effects of meal frequency on growth performance of hybrid tilapia, Oreochromis niloticus x 0. aureus, fed different carbohydrate diets. Aquaculture 92:343–50. doi:10.1016/0044-8486(91)90039-A.
- Veverica, K. L., B. Omolo, J. Amadiva, and J. R. Bowman 2000. Aquaculture training for Kenyan fisheries officers and university students. Seventeenth annual technical report. Pond Dynamics/ Aquaculture CRSP, Oregon State University, Corvallis, pp. 167–70.
- Vincke, M. M. J. 1987. Productive systems suited to village aquaculture in Africa. IDRC/FAO Workshop on research priorities for African aquaculture. Dakar, Senegal. 1986: 114–21.
- Welcomme, R. L. 1988. International introductions of inland aquatic species. FAO Fish. Tech. Pap. 294. 318 p. doi: 92-5-102664-5.