ABSTRACT
Distributed power generation—electricity generation that is produced by many small stationary power generators distributed throughout an urban air basin—has the potential to supply a significant portion of electricity in future years. As a result, distributed generation may lead to increased pollutant emissions within an urban air basin, which could adversely affect air quality. However, the use of combined heating and power with distributed generation may reduce the energy consumption for space heating and air conditioning, resulting in a net decrease of pollutant and greenhouse gas emissions. This work used a systematic approach based on land-use geographical information system data to determine the spatial and temporal distribution of distributed generation emissions in the San Joaquin Valley Air Basin of California and simulated the potential air quality impacts using state-of-the-art three-dimensional computer models. The evaluation of the potential market penetration of distributed generation focuses on the year 2023. In general, the air quality impacts of distributed generation were found to be small due to the restrictive 2007 California Air Resources Board air emission standards applied to all distributed generation units and due to the use of combined heating and power. Results suggest that if distributed generation units were allowed to emit at the current Best Available Control Technology standards (which are less restrictive than the 2007 California Air Resources Board standards), air quality impacts of distributed generation could compromise compliance with the federal 8-hr average ozone standard in the region.
The San Joaquin Valley is a fast growing region that demands increasing power generation to sustain the economic development, and at the same time it is one of the worst polluted areas in the United States. Hence, the region demands alternatives that minimize the air quality impacts of power generation. This paper addresses the air quality impacts of distributed generation of power, an alternative to central power generation that can potentially reduce greenhouse gas and pollutant emissions throughout the United States.
INTRODUCTION
Distributed generation (DG) refers to the generation of electric power at or near the location of electricity load using technologies such as fuel cells, microturbines, and natural-gas- or diesel-powered internal combustion engines (ICEs). The power-generating capacity of DG units ranges from few kilowatts (kW) to tens of megawatt (MW). Distributed generation contrasts with conventional power generation in which electricity is produced at large central plants with capacities between 500 and 1500 MW and is transmitted through the grid to the locations of electricity load.
There has been significant interest in DG technologies in recent years, as they offer several incentives over conventional generation.Citation1 – Citation4 For example, DG systems have potential to supply high-quality power with greater reliability to commercial, industrial, and residential facilities, especially for mission critical applications. The use of combined heat and power (CHP) applications with DG units significantly increases overall energy efficiency and provides environmental benefits. Systemwide efficiency gains can also be realized through avoided transmission losses that occur when electricity is produced at central generation plants. In addition to these incentives, ever increasing power demand and grid limitations could also lead to widespread adoption of DG technologies. California, with a reorganized electric power industry, is expected to have distributed power contributing significantly to the total power generation capacity in the future. As per the DG strategic plan developed by the California Energy Commission (CEC),Citation5 more than 2000 MW of current generation capacity in California can be classified as DG and is expected to grow in the future.
From ambient air quality point of view, distributed power generation is characterized by a widely dispersed emission sources of oxides of nitrogen and sulfur (NOx and SOx), volatile organic compounds (VOCs), and particulate matter (PM) in an urban area. In contrast, the conventional power generation consists of concentrated sources of emissions from large central power plants that are usually installed in remote locales. The introduction of emissions from DG may lead to increase in ambient ozone and particulate matter concentrations in urban areas with already bad air quality. Furthermore, DG emissions often occur close to the surface level, as opposed to those from central plants with tall stacks, and directly impact surface level pollutant concentrations. Therefore, the impact of emissions from DG sources on urban air quality is of great interest.
Few recent studies addressed some aspects of DG impacts on urban air pollution. Allison and LentsCitation1 concluded that only highly efficient DG technologies offer environmental benefits when compared with combined cycle central generation plants. Ianucci et al.Citation6 calculated aggregated emissions resulting from DG installations. Heath et al.Citation7 compared effects of DG emissions on human inhalation exposure with central power generation. Those studies assumed DG emission levels that were significantly higher than the current 2007 California Air Resources Board (CARB) emission standards and the quantification of the impacts of DG were mostly based on their effect on direct emissions. However, a thorough quantification of air quality impacts of DG on a regional-scale requires modeling the fate of DG emissions using a three-dimensional atmospheric chemical transport model. Using this approach, Rodriguez et al.Citation2 applied the California Institute of Technology (CIT) model to study impacts of DG emissions on ambient ozone and PM concentrations in the South Coast Air Basin of California for the year 2010. This study concluded that deployment of DG technologies to meet 10% of increased power demand leads to ozone increases on the order of 1 ppb and PM by 1 μg/mCitation3. More recently, Carreras-Sospedra et al.Citation4 applied the Community Multiscale Air Quality (CMAQ) model to study air quality effects of DG deployment to replace highly polluting central plants in northeastern United States and concluded that significant air quality benefits can be realized through DG.
In this study, air quality impacts from future deployment of DG technologies are quantified for the San Joaquin Valley (SJV) of California. In addition to the common drivers for DG in California, the SJV is experiencing high population growth leading to higher electricity demand. However, at the same time, the SJV is also one of the regions that regularly experiences ozone and PM concentrations above the prescribed national and state air quality standards. The unique topographical features of the valley, combined with the seasonality of air pollution episodes in the SJV, play an important role in determining the impacts of DG on air quality. Therefore, it is imperative to understand how future DG emissions impact ambient air quality through comprehensive atmospheric and emissions modeling in order to inform policy-making for DG.
AIR QUALITY MODELING OF THE SAN JOAQUIN VALLEY
The SJV Air Basin, approximately 250 miles long and averaging 80 miles wide, is the second largest in terms of land area in California. The SJV is flanked by coastal mountain range on the west and Sierra Nevada range on the east. The valley is bounded by Tehachapi Mountains on the south and is open in the north. These unique geographic features of the valley have significant bearing on air movement in the SJV Air Basin. The mountain ranges on the west, south, and east edges of the valley restrict the air movement leading to stagnation and poor airflow in the valley.
The SJV experiences some of the highest ozone and PM concentration levels in United States. Consequently, the region is classified as a nonattainment region for the state 1-hr and federal 8-hr ozone standards and the annual standard for PM with a diameter smaller than 2.5 micrometers (PM2.5). Ozone episodes typically occur in the summer when valley experiences high temperatures and stagnant conditions.
The SJV presents unique air quality simulation and pollutant control challenges due to the seasonality of air pollution episodes. Although ozone episodes occur during summer months, the SJV experiences high PM concentrations in winter.Citation8 – Citation11 Wintertime conditions in the SJV are characterized by low surface wind speeds, low temperatures, and high relative humidity.Citation12 In addition to accumulation of pollutants, such conditions favor production of PM through secondary formation.Citation13 Several field and modeling studies showed that ammonium nitrate, formed from gas-phase ammonia (NH3) and NOx emissions through secondary processes, dominate PM concentration in the SJV.Citation14 – Citation16 Agricultural operations in the rural areas of the basin are major sources of ammonia. Ammonium nitrate (NH4NO3) is formed when gas-phase nitric acid (HNO3) produced from the NOx emissions in urban areas react with NH3 from rural areas.Citation12,Citation17,Citation18
Both ambient ozone and PM concentrations depend strongly on spatial and temporal profiles of precursor emissions, transport of precursors and reaction products through atmospheric transport mechanisms, and removal processes such as dry and wet deposition. Therefore, comprehensive air quality models that incorporate all these processes in detail are needed to understand and characterize the formation and transport of pollutants in a given region. In this study, the Comprehensive Air quality Model with extensions (CAMx)Citation19 is used for ozone simulations and CMAQ modelCitation20 is used for PM simulations. Selection of the two models is dictated by the availability of well-tested and model-ready input data for the two different episodes. Both models have been used in many published air quality and regulatory studies.Citation21 – Citation26
The Statewide Air Pollution Research Center (SAPRC99) chemical mechanismCitation27 is used in both air quality models. The SAPRC99 mechanism is a lumped species mechanism that has been especially developed for regional air quality modeling. The aerosol component of CMAQ is derived from the Regional Particulate Model (RPM).Citation28 The CMAQ model represents particle size distribution as a superimposition of three log-normal modes. PM2.5 is represented by two modes: the Aitken mode, which represents fresh particles, and the accumulation mode, which represents aged particles. The coarse mode represents particles between PM2.5 and PM10.Citation29,Citation30
Modeling Domain
The modeling domain is shown in . The domain extends from Pacific Ocean on the West to Central Nevada on the east and northern border of Los Angeles County in the south to California/Oregon border on the north. This domain is divided into 4 × 4-km cells in the horizontal direction, constituting 185 cells in each direction. In the vertical direction, the computational domain extends up to 5000 m in terrain—following coordinates through 16 vertical layers. Although entire model domain is simulated in this study, only the part of the domain that includes the SJV region is shown in subsequent analysis in the interest of clarity.
Figure 1. Air quality modeling domain to evaluate the impacts of distributed generation on ozone and PM in the San Joaquin Valley (SJV) of California. The SJV boundary is shown as a thick dotted line.
Meteorological and Emission Data
Three-dimensional modeling of ambient ozone and particulate matter requires spatially and temporally resolved fields of meteorological data and emissions. Meteorological data for both summer (ozone) and winter (PM) episodes were obtained from CARB. These data were collected during Central California Air Quality Study (CCAQS) field studies that were conducted in the year 2000. CCAQS comprises of two studies, the California Regional Particulate Air Quality Study (CRPAQS),Citation31 which took place from December 1999 to February 2001, and Central California Ozone Study (CCOS), which took place in the summer of 2000. These studies involved extensive meteorological and air quality measurements that were used in the development of input data fields for model studies.
Ozone simulations are conducted using the meteorological data from the episode that occurred from July 29 to August 2, 2000. These fields are prepared by the CARB using the California Meteorological (CALMET) objective analysis model with the output from Pennsylvania State University/National Center for Atmospheric Research mesoscale prognostic model (MM5) as initial guess field. Jackson et al.Citation32 showed that the resulting hybrid CALMET/MM5 hybrid meteorological fields used in the present study provide better agreement between observed ozone concentrations and model predictions. In addition, even though hybrid approaches tend to incur into mass conservation problems, mass divergence in the MM5/CALMET meteorological fields for the episode was smaller than in the fields generated by MM5 alone. Consequently, the hybrid fields were selected for the simulations. This episode captures typical meteorological features of the valley that cause high ozone concentrations, often exceeding the state and federal air quality standards. An analysis by Lehrman et al.Citation33 showed that meteorological categories of all days during this episode are within 1 standard deviation of the mean for days with ozone concentration greater than the National Ambient Air Quality Standard (NAAQS).
The spatially and temporally resolved emission inventory for the modeling domain was generated by CARB in support of development of air quality plans for the SJV region. The inventories obtained from CARB are estimated for CCOS base years (year 2000 for ozone and year 2001 for PM). Analysis of model performance for ozoneCitation34 and PMCitation35 concluded that performance of both models is satisfactory under the United States Environmental Protection Agency (U.S. EPA) guidelines. Both summer and winter emission inventories for CCOS base years are scaled to year 2023 using the estimated reductions that are needed to attain ozone 8-hr standard as presented in the air quality management plan by SJV Air Pollution Control District (SJVAPCD).Citation36
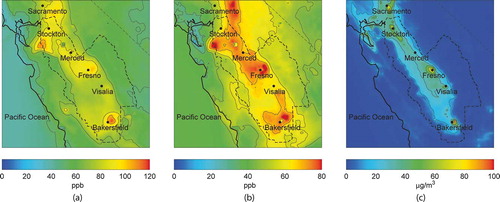
Figure 2 shows peak 1-hr and 8-hr ozone concentrations for the 2023 base case. As expected, significant decreases in ozone concentrations are predicted in comparison with the CCOS base case for the year 2000.Citation34 However, both 1-hr and 8-hr ozone concentrations at many locations in the basin are close to or slightly exceed the ozone standards. Because NH4NO3 dominates wintertime PM in the SJV, reduction in NOx leads to a significant reduction in 24-hr PM2.5 throughout the basin for the 2023 base case, compared to simulation results for the year 2001,Citation35 as shown in .
Figure 2. Model-predicted ozone: (a) peak 1-hr ozone, (b) peak 8-hr ozone, and (c) 24-hr PM concentrations, in the SJV using baseline emissions for the target year of the study (2023). Future emissions are developed based on the estimates from the air quality management plan developed by SJVAPCD to demonstrate the attainment of 8-hr ozone standard by the year 2023. Meteorological inputs are from CCOS and CRPAQS data sets for ozone and PM, respectively.
DEVELOPMENT OF DISTRIBUTED GENERATION SCENARIOS
In the context of this study, a DG scenario is said to be fully defined when spatially, chemically, and temporally resolved set of emissions can be calculated for a particular deployment scenario of distributed power generation sources. Such characterization of emissions depend on four main parameters, namely, (i) aggregate DG power that is assumed in a given scenario; (ii) DG technologies that are deployed and their emission specifications; (iii) spatial and temporal distribution of DG emissions; and finally (iv) any displaced emissions resulting from the deployment of DG power. A systematic framework is developed and applied to incorporate these four parameters into well-defined DG scenarios. This framework is based on the methodology developed by Samuelsen et al.Citation36 and Medrano et al.Citation3 in order to evaluate the impacts of DG on air quality in the southern California.Citation2 The four major parameters are presented below.
Aggregate DG Power
Total emissions from future DG units introduced into the SJV strongly depend on aggregate DG power that is installed in the region. The aggregate DG power depends on several factors such as time frame under consideration, policy incentives, DG technology development, and market trends. The CEC Strategic PlanCitation5 forecasted that total DG power deployed in California could be as high as 20% of total increase in the peak power demand of the state by 2020. A more recent study by the Electric Power Research Institute (EPRI)Citation37 considered several policy initiatives and market drivers that strongly influence penetration of DG power. This study concluded that cumulative DG power by 2020 in California could range from 1966 to 7340 MW, which translates to 12–45% of increased peak demand. The forecasted range of DG market penetration reflects the uncertainty in future policy direction, research, and development advances that are possible and willingness of consumer adoption of DG technologies. The 12% DG penetration is forecasted based on existing incentive programs. The highest level of DG penetration of about 45% of increased peak demand is expected if significant advances in DG technologies occur through research and development, policies are adopted that favor wholesale export of surplus DG power, and if DG units can benefit from credits for potential CO2 emission reductions. Given the uncertainty in the fraction of future power needs that are met by DG, a range of DG penetration levels—and corresponding aggregate DG power—are considered to investigate effects of DG on air quality.
The future peak power demand is predicted based on growth projections of electricity demand by the Energy Information Administration.Citation38 Assuming the annual growth rate of 1.56%, the peak power demand in California in 2023 is projected to be 70 GW. Based on countywide electricity consumption data, the SJV constitutes 12% of statewide peak power demand. This results in peak power demand growth of 2.0 GW for SJV by the year 2023.
DG Technologies and Emission Specifications
The DG technologies that are likely to be deployed in California include current major technologies that are commercially available, such as natural-gas-fired combustion turbines and reciprocating internal combustion engines (ICEs). The emerging technologies that are undergoing significant research and development include photovoltaics, fuel cells, gas turbine–fuel cell hybrids, and natural-gas-fired microturbine generators (MTGs).
Besides the input fuel type, operational features, and overall efficiencies, a major distinguishing factor of DG technologies is their emission characteristics. For example, some DG technologies such as wind turbines and photovoltaics have no emissions. On the other hand, diesel-powered ICEs are highly polluting and are permitted to operate in California only as back-up generators. Emissions from natural-gas-fired turbines and ICEs are currently higher than central generation plants for equivalent power, but much lower than diesel-powered ICEs. Although emission factors for many DG technologies are available in the literature,Citation1,Citation6,Citation39 – Citation41 overall DG emissions and future deployment of DG technologies in California are strongly determined by emission regulations formulated by CARB and local air quality management districts. CARB certifies DG units that are under 1 MW and meeting its emission standards.Citation42 The units that are greater than 1 MW typically undergo permitting process with local air districts and are subject to Best Available Control Technology (BACT) guidelines. BACT guidelines require the implementation of best control technologies possible that are proven in practice or those that are available without significant economic burden. Large DG units, which are often natural-gas-fired turbines or ICEs, are currently subject to such BACT guidelines. Emission factors of all technologies and CARB and BACT emission standards are summarized in . As shown in , current BACT emissions in California are much higher than CARB DG certification emissions.
Table 1. Emission factors of all technologies and regulatory standards used in this study
In this study, a set of scenarios are developed that explore impacts from DG with emission specifications spanning the range of current regulatory framework. Every market segment preferentially adopts certain DG technologies, mainly because their capacity range and features are best suited to the energy demands of that segment. For example, large industrial facilities may be mainly served by gas turbines with 2–50 MW. Large commercial and medium-size industrial locations will likely favor natural gas reciprocating engines and gas turbines in the range of 500 kW to 2 MW; commercial and small industrial sectors, with capacities ranges of 25–500 kW are more suited for photovoltaics, MTGs, small ICEs and fuel cells; the residential applications in the range 1–5 kW will likely favor fuel cells and photovoltaics. Therefore, the relationship between DG technology, DG size, and market sector needs to be considered in order to develop a DG scenario. Therefore, DG market is divided into five activity sectors, viz., agricultural, commercial, industrial, and high-density residential and low-density residential. Each activity sector is further divided into six size categories (<50, 50–250, 250–1000 kW, 1–5, 5–20, 20–50 MW) to account for variability in demand for DG capacity. DG market sectors and size categories are further associated with each of the DG technologies. This relationship between DG technology, size category, and market sector is formalized and used in conjunction with land use information to obtain the spatial distribution of DG emissions as described in the following section.
Spatial and Temporal Distribution of DG Emissions
The extent of DG power adoption by each of the activity sectors is determined based on the area of that particular sector in the SJV. The spatial distribution of the six activity sectors mentioned above is obtained from the California Spatial Information Library.Citation43 Each activity sector in each computational cell is further disaggregated into six DG size categories. This disaggregation process is based on several reports on energy consumption surveys in the commercial, residential, and manufacturing sectors by the Energy Information Agency.Citation44 – Citation46 These reports relate total floor space of various establishment types in each sector to the annual electricity consumption, and provide the information to determine the average power demand for each establishment and the potential for each sector to adopt DG in each of the six size classes. DG market studiesCitation37 and feedback from regulatory agencies in California provide the information on size-, technology-, and sector-specific relative DG adoption rates to allocate size-specific DG technologies across the six activity sector and six power size categories in each computational cell. Following the calculation of average DG power for each sector in each cell, the temporal variation of this power is determined using sector-specific load profiles for each sector (from Southern California Edison). Finally, the pollutant emissions for all computational cells are determined on hourly basis by applying technology- or regulation-dependent emission specifications. Net DG emissions are obtained after accounting for any displaced emissions, which are described below.
Displaced Emissions
A major incentive for the adoption of DG technologies is their potential to achieve high overall efficiencies and associated cost benefits through waste heat utilization. The waste heat is typically captured through a recovery system and utilized against thermal loads of the host facility leading to combined heating cooling and power (CHP) application. Consequently, DG/CHP can displace emissions from boilers that are otherwise employed to meet the thermal loads of the facility. Therefore, emission offsets need to be applied to account for displaced emissions from CHP applications in order to accurately quantify the air quality benefits of DG. In this study, CHP energy offsets for each DG technology (Q fuel,i ) are calculated as follows:
where Q fuel,i is the net energy saved by the CHP unit using DG technology i that otherwise would have to be consumed by a boiler to produce usable heat; Q HR,i is the total net heat rate produced by DG that displaces the heat produced by a boiler; f CHP is a fraction of DG implemented in a given region that is installed with waste heat recovery equipment; f HR is the average heat recovery utilization factor, which includes the lost waste heat due to supply and demand mismatch; Q elec,i is the electric energy produced by DG; ηelec,i and ηtotal,i are the electrical and total efficiencies of each fuel-driven DG technology i, respectively, and ηboiler is the boiler efficiency. Emission offsets are then calculated multiplying the boiler emission factors () by the energy offsets. In this study, several DG scenarios are developed to investigate the role of CHP on overall DG impacts by varying the values of f CHP and f HR.
AIR QUALITY IMPACTS OF DISTRIBUTED GENERATION
Air quality modeling is performed for future year baseline and DG emission scenarios for both summer (ozone) and winter (PM) episodes. The impacts of DG are quantified by analyzing differences between the baseline scenario and DG emissions scenarios for ozone and PM concentrations. In order to minimize the effect of initial conditions, the concentrations from the final day of simulated air quality episodes are analyzed. The parameters that define a representative DG scenario are modified systematically to analyze the sensitivity of air quality impacts to changes in (i) aggregate DG power, (ii) emission specifications, (iii) the extent of CHP emission offset, and (iv) spatial distribution. It is intended that the collective insight from all these scenarios provides a comprehensive assessment of the air quality impacts of DG in the San Joaquin Valley.
DG Base Scenario
This scenario intends to represent a realistic instance of DG implementation in the year 2023. The assumptions are based on market studies and vetted by DG stakeholders, such as regulatory bodies (CARB, SJVAPCD) and other key stakeholders in the electricity generation (Southern California Edison and Pacific Gas and Electric), during the course of a 3-year study funded by the CEC.Citation47 Assumptions for future projections—especially for long-term projections—are uncertain and inherently limited by information available in the present. Additional cases provide uncertainty bounds that delimit the potential air quality impacts of DG. This DG base scenario assumes that DG penetration corresponds to 18% of total increased peak power demand, which represents a moderate DG penetration. The resulting aggregate DG power is 373 MW. In addition, this scenario assumes that all DG units emit at CARB emission specifications for certified DG. shows the distribution of DG power across the six size categories and six activity sectors resulting from using DG market penetration studies. Most of the DG power is expected to be adopted by industrial and commercial sectors. shows the distribution of technologies that contribute to this DG power. Natural gas turbines contribute approximately half of total DG power, followed by natural gas ICEs with 47%. The emerging technologies such as fuel cells contribute nearly 3% of total DG power. DG emissions are mainly concentrated in the areas around Bakersfield, Visalia, Fresno, Merced, and Stockton—main urban centers of the SJV.
Figure 3. Distribution of DG power by size class amongst the various land-use sectors considered in the SJVAB for the example scenario.
Figure 4. DG technology mix obtained using the DG scenario development framework for an example scenario.
Effect of Aggregate DG Power
Aggregate DG power is one of the main parameters that determine overall DG emissions. Three scenarios are constructed to span the fraction of the increase in peak power demand that is expected to be met by DG resources. The first scenario assumes that 45% of the increased power demand is met by DG, resulting in the total DG power of 934 MW. The penetration level of 45% represents an extra high level of DG adoption resulting from policies that strongly favor DG power. Therefore this scenario serves as an upper bound for aggregate DG power in the SJV for the target year. The second scenario explores large-scale deployment of DG in which the aggregate DG power is 1200 MW, equivalent to the capacity of a central generation power plant recently installed in the SJV.Citation48 Although it is highly improbable that the level of DG adoption in the SJV would reach 1200 MW, 58% of the increased peak power demand, this scenario is constructed to compare the impacts of DG directly with a scenario with central generation of equivalent power capacity. In these scenarios, all DG technologies are assumed to comply with the CARB emission standards. It should be noted that currently it is not required for all DG technologies to comply with CARB specifications. However, this assumption is made because there is a strong possibility that all DG units will be required to comply with CARB standards in near future. In addition, no CHP emission credits are applied for these scenarios in order to isolate the effect of total DG power on air quality.
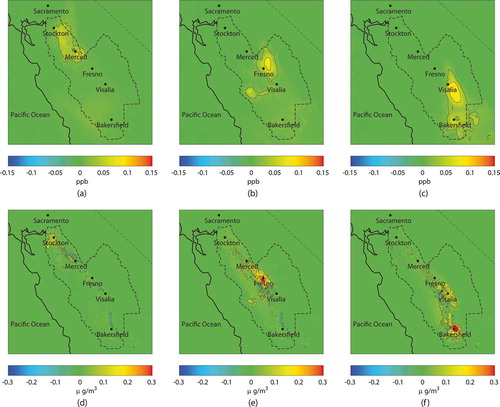
The total basinwide DG emissions from scenarios that vary aggregate DG power are presented in . Total emissions for NOx range from 0.19 to 0.63 tons/day for the DG penetration range of 18–58%. The corresponding ranges for VOC and direct PM emissions are 0.03–0.10 and 0.16–0.51 tons/day, respectively. As expected, emissions increase with total DG penetration. However, DG emissions account for less than 1% of total SJV emissions, mainly due to the assumption that all DG technologies comply with strict CARB emissions standards. The model-predicted increase in peak 1-hr ozone for scenarios that vary total DG power is shown in –c. The increase in peak 1-hr ozone ranges from 0.10 to 0.20 ppb for DG penetration range of 18–58% of increased peak demand. Most of the domain experiences an increase in ozone concentration due to addition of NOx from DG. This is due to the chemistry of ozone formation in the SJV for the year 2023, which is limited by the availability of NOx. This result is in contrast to predicted impacts of power plants in the SJV for the year 2000.Citation49 Vijayaraghavan et al.Citation49 showed that in the main urban areas in central California, ozone production was VOC-limited, whereas in rural areas the ozone production was NOx-limited. The emissions of NOX and VOC in the year 2023 are 75% and 25%, respectively, lower than the emissions for the year 2000. This drastic reduction in NOx emissions is the main cause for the change from a VOC- to NOx-limited regime in the urban areas. Similarly, impacts of DG in the SJV differ with the impacts of DG in the South Coast Air Basin of California for 2010,Citation2 where an increase in NOx emissions due to DG leads to a decrease in ozone concentration. Maximum impacts for ozone are predicted to occur in the downwind area of Visalia, followed by Fresno and Bakersfield areas. Furthermore, most of the impacts are along the corridor that connects these urban centers. Because the same land-use distribution is used for all scenarios, spatial distribution of impacts remains fairly constant across the scenarios.
Table 2. Basinwide emissions for all DG scenarios simulated in this study
Figure 5. Effects of aggregate DG power. Increase in peak 1-hr ozone concentration due to emissions for scenarios (a) base DG scenario, (b) 45% of the increased demand, and (c) large-scale adoption. Increase in 24-hr average PM2.5 concentration due to emissions for scenarios (d) base DG scenario, (e) 45% of the increased demand, and (f) large-scale adoption.
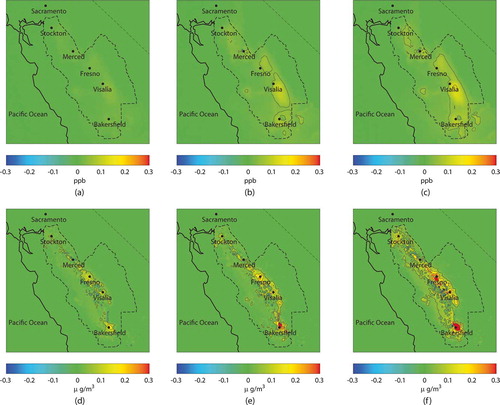
Figure 5d–f show increase in 24-hr average PM2.5 concentration for scenarios that vary total DG power. The 24-hr average PM2.5 increase ranges from 0.2 to 0.7 μg/m3 for DG penetration range of 18–58% of increased peak demand. PM2.5 impacts increase with total DG power. In addition to direct PM emissions, this increase is attributed to secondary aerosol formation from NOx and NH3 emissions. Peak impacts on PM are predicted to occur at urban locations in the valley where DG emissions are introduced. In comparison with ozone, PM impacts are more concentrated and occur close to the model cells with DG emissions due to limited atmospheric transport. Furthermore, PM2.5impacts are more strongly affected than ozone by aggregate DG power due to both stagnation and direct PM emissions. Maximum increase in PM2.5 is predicted near Bakersfield. Similar to ozone, PM impacts occur along the corridor that connects Bakersfield, Fresno, Visalia, and Stockton.
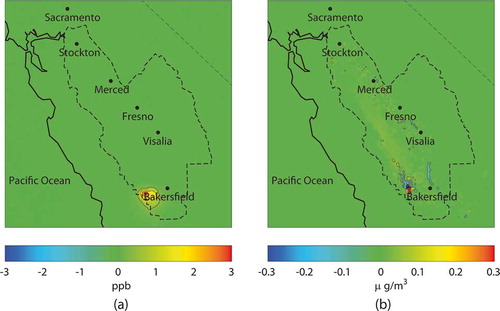
Finally, shows increase in ozone and PM2.5 concentration due to a central power plant of 1200 MW capacity. The location corresponds to the site of a newly installed power plant in the SJV.Citation50 The peak increase in maximum 1-hr ozone and 24-hr average PM is 3 ppb and 2 μg/m3, respectively. Peak increase in ozone and PM2.5 from central generation is much higher than that for DG with equivalent power. However, impacts from central generation are highly localized around the cell contained the central plant. Previous studies evaluated the effect of DG using earlier emission standards in California, and found that The study by Vijayaraghavan et al.Citation49 showed that the use of a plume-in-grid model reduced the impact of point sources at the point of emissions and increased the impacts downwind from the point of release. However, the overall model performance was not altered significantly by the use of the plume-in-grid module. This last point is the main reason why the air quality modeling community has been debating whether to include the plume-in-grid treatment in air quality models in the last years.Citation51 Despite the lack of gain in model performance, plume-in-grid represents plume dynamics more realistically than models without it. Hence, results may overestimate the impacts of central generation at the point of emissions, and underestimate the effects downwind.
Figure 6. Air quality impacts of a central power plant: (a) increase in peak 1-hr ozone concentration due to emissions for scenarios; (b) increase in 24-hr average PM2.5 concentration.
Effect of Emission Specifications
Emission specifications of DG units directly affect total DG emissions. As shown in , some DG technologies currently emit at higher levels than CARB specifications or even central power plants on MW-hour basis. Although currently significant research and development efforts are underway to reduce emissions from such technologies, it may not be possible for all DG technologies to achieve CARB emission standards. Furthermore, DG units can experience performance degradation over a period of time, leading to increase in emissions. Therefore, the effect of emission specifications of DG technologies needs to be studied in order to quantify the impacts of DG on future air quality. Two scenarios are constructed to study the effect of emission specifications on DG impacts keeping the other parameters constant. Total DG penetration assumed for these scenarios is 18% of increased peak demand. The first scenario assumes that all DG emits at the current BACT levels for ICEs. The ICEs constitute a major fraction of total DG power and currently they cannot meet the CARB standards. It is expected that their emission levels will decrease; however, the extent of such decrease is uncertain. Therefore, this scenario represents an upper bound on emissions resulting from DG. The second scenario explores the possibility of performance degradation for some units. A study by the South Coast AQMD has shown that over half of the ICE units emitted more than 3 times the permitted levels for NOx and CO after they were in operation for some period of time.Citation52 Therefore this scenario (“out-of-compliance”) incorporates such a possibility by assuming that ICEs are out-of-compliance and their NOx and CO emissions exceed by 300% the current BACT emissions levels due to performance degradation.
The total basinwide emissions from scenarios that vary emission specifications are shown in . When compared with the scenario that assumes all DG emits at CARB levels, the scenario with ICEs emitting at BACT levels results in a significant increase in overall DG NOx emissions. The BACT scenario is predicted to add 1.8 tons/day of NOx from DG, which is more than 1% of total basinwide emissions. Similarly, the out-of-compliance scenario also results in significantly higher NOx emissions. This result is directly attributed to the fact that current BACT guidelines for ICEs are several times higher than CARB emission specifications for DG. The predicted increase in peak 1-hr ozone from scenarios that vary emission specifications are shown in and b. The BACT and out-of-compliance scenarios lead to a maximum increase of 0.4 and 0.7 ppb, respectively. In comparison with the scenario that assumes all DG units operating at CARB emission standards, BACT and out-of-compliance scenarios lead to higher increases in peak 1-hr ozone concentrations due to much higher levels of total DG emissions, especially for NOx. The spatial distribution of impacts is consistent in all scenarios, with maximum increases occurring in areas around Visalia, Fresno, and Bakersfield.
Figure 7. Effects of emissions specifications. Increase in peak 1-hr ozone concentration due to emissions for scenarios: (a) all DG at BACT standards and (b) out-of-compliance ICE. Increase in 24-hr average PM2.5 concentration due to emissions for scenarios: (c) all DG at BACT standards and (d) out-of-compliance ICE.
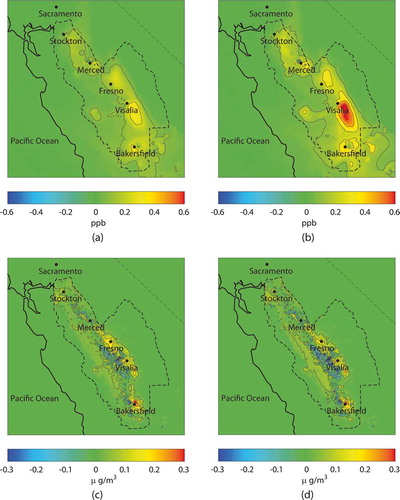
Figure 7c and d show increase in 24-hr average PM2.5 concentrations for scenarios with varying emission specifications. The BACT and out-of-compliance scenarios result in increase of 24-hr average PM2.5 concentration by 0.35 and 0.4 μg/m3, respectively. Note that PM2.5 is predicted to decrease at some locations for these two scenarios. The observed decreases in 24-hr average PM2.5 at these locations are attributed to the nighttime chemistry of NOx. Addition of NOx from DG at nighttime causes ozone titration and decreases PM formation, leading to an overall reduction in 24-hr average PM2.5 in those areas. Products of the ozone titration, nitrogen oxides, are then transported downwind and contribute to the increases in particle concentrations described above. The complexity of the impacts on PM2.5—increases and decreases due to an increase in NOX emissions—are due to the highly nonlinear behavior of particle formation. Watson and Chow reported highly resolved temporal variation of ammonium nitrate in the San Joaquin Valley, and presented rapid variations in the nitrate formation even in periods of high stagnation, showing the complexity of the formation of nitrate particles in the valley and the need for highly resolved measurements.Citation53 Previous modeling efforts to generate isopleths for particle formation in southern California also showed the nonlinearity of ammonium nitrate formation.Citation54,Citation55
Effect of CHP Application
The effect of CHP application on air quality impacts from DG is studied by simulating scenarios that assume varying levels of waste heat recovery and associated emission offsets due to displaced boiler emissions. Because the application of CHP is a major incentive for DG, it is expected that many DG units will be used in this mode. However, all DG units may not employ CHP in conjunction with DG because of additional capital requirements, lack of sufficient thermal demand, or other constraints. Therefore, it is assumed that 60% of DG power will be generated in conjunction with CHP as a realistic estimate, based on market studies and insights from stakeholders.Citation47 Because not all the recovered waste heat from DG/CHP installations can be utilized due to mismatch between thermal loads and quantity of waste heat recovered, it is assumed that 50% of waste heat is effectively utilized as a realistic estimate. As CHP application offsets emissions, it is possible to achieve net reduction in total DG emissions when coupled with CHP. Hence, a scenario (“ALL CHP”) with f CHP = 100% CHP and f HR = 100% is constructed to evaluate the upper bound for emissions offsets due to CHP.
As shown in , assuming a “realistic” level of CHP application results in almost negligible net emissions from DG, because CHP offset compensates for all emissions from DG units. In the scenario with maximum possible CHP utilization, net emissions are negative because CHP offsets are greater than emissions from DG units. shows increase in ozone and PM concentrations from these two scenarios. The scenario with 60% of DG power with CHP has only negligible impacts on ozone. However, the peak 1-hr ozone decreases by a maximum of 0.1 ppb in the scenario that assumes 100% CHP. Scenario “ALL CHP” leads to increases in PM2.5 of up to 0.4 μg/m3, and those impacts are highly localized and occur in relatively small number of model. The increase is attributed to nighttime chemistry of NOx with NH3, and to direct emissions of PM. Even though nighttime increases in ozone concentration with respect to the base case would produce secondary PM, CHP application does not completely offset NH3 and direct PM emissions. Hence, direct PM and NH3 lead to an increase in overall 24-hr PM2.5 formation.
Figure 8. Effects of combined heating and power. Increase in peak 1-hr ozone concentration due to emissions for scenarios: (a) realistic CHP offset and (b) maximum CHP offset. Increase in 24-hr average PM2.5 concentration due to emissions for scenarios: (a) realistic CHP offset and (b) maximum CHP offset.
Spatial Sensitivity of DG Impacts
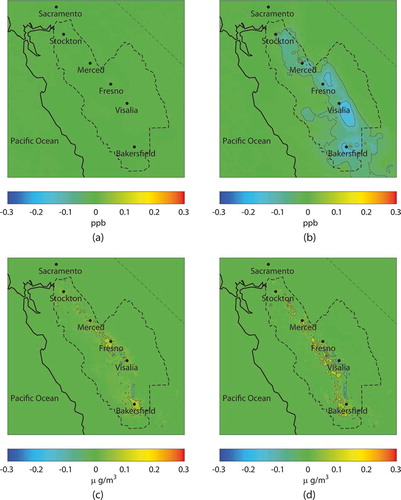
Atmospheric transport of precursor emissions plays a major role in ozone and PM formation, especially when such transport carries emissions from one area to another with more favorable conditions for pollutant formation. Rodriguez et al.Citation48 explored the possibility of DG emissions from one part of the South Coast Air Basin affecting another through atmospheric transport and concluded that DG emissions from coastal areas impact inland locations. In this section, a sensitivity analysis is conducted to determine if such spatial trends exist in the SJV and what role atmospheric transport plays in determining impacts of DG on air quality. For the purpose of this analysis, the SJV is divided into three regions: northern region comprising of San Joaquin, Stanislaus, and Merced counties, central region comprising of Madera and Fresno counties, and finally southern region comprising of Tulare and Kern counties. Three scenarios are developed by introducing DG emissions into only one of the three regions of the basin. All remaining DG parameters are kept constant across these three scenarios (18% DG penetration, no CHP offset, CARB emissions). Ozone increases by about 0.1 ppb in each of these scenarios (–c). In each of these cases, the impact is limited to only the region where DG is introduced. Temporal profiles of impacts from these scenarios also have been examined that show 1-hr peak ozone concentration due to DG emissions decreases in the night and increases during the daytime. Ozone decreases in the nighttime due to the titration from NOx emissions and increases during the daytime due to photochemistry of additional NOx and VOCs from DG emissions. However, the impact at all times during the day is limited only to the region where DG is introduced. This is attributed to limited atmospheric transport in the basin due to stagnation and low wind speeds.
Figure 9. Spatial sensitivity of DG impacts. Increase in peak 1-hr ozone concentration due to emissions for scenarios: (a) sensitivity case with emissions located in the North section of the SJV, (b) sensitivity case with emissions located in the central section of the SJV, and (c) sensitivity case with emissions located in the South section of the SJV. Increase in 24-hr average PM2.5 concentration due to emissions for scenarios: (d) sensitivity case with emissions located in the north section of the SJV, (e) sensitivity case with emissions located in the central section of the SJV, and (f) sensitivity case with emissions located in the south section of the SJV.
PM2.5 increases up to 0.3 μg/m3 for each of these scenarios (–f). A general trend of PM increases occurring north of locations with DG emissions is predicted in these scenarios. Observation of temporal profiles has shown that atmospheric transport of DG emissions and reaction products of those emissions are transported northwards during the winter PM episode. However, the range of such transport is observed to be limited. Therefore, depending on meteorological conditions, it is possible for DG emissions from one region to impact other regions.
CONCLUSIONS
This paper quantifies the impacts of emissions from distributed generation of electric power on ambient ozone and PM concentrations in the San Joaquin Valley Air Basin of California. The impacts of DG in the SJV complement the findings in previous studies on DG in other areas in the United States, in southern California (Rodriguez et al.Citation48) and northeastern United States (Carreras-Sospedra et al.Citation4). Several scenarios of adoption of DG power in the SJV for the year 2023 are developed by varying aggregate DG power, emission specifications of DG technologies, and level of avoided emissions due to the combined heating and power applications of DG power. A methodology based upon geographic information systems land-use data is used to spatially and temporally allocate the emissions from each scenario. Air quality modeling for the SJV is then conducted using CAMx and CMAQ models for ozone and PM, respectively.
Ozone concentrations are predicted to increase in much of the domain with the introduction of NOx emissions from DG deployment. This is because ozone formation in the SJV is NOx-limited for the emission levels that are targeted for attaining the 8-hr ozone standard. Conversely, the aggressive use of CHP could more than offset all NOx emissions from DG and decrease ozone concentration. The increase in peak 1-hr ozone due to DG ranged from 0.1 to 0.2 ppb for the DG penetration levels of 18 58% of increased peak demand in the SJV when all DG units are assumed to emit at CARB emission standards. Although the increase in ozone consistently increases with aggregate DG power, from the perspective of air quality management, the impact on ozone may be considered small to negligible under these circumstances. However, when it is assumed that all DG emit at the level of current BACT levels for ICEs, the peak increase in 1-hr ozone is 0.4 ppb. Although this level of impact is small, it could be important for locations that are on the verge of compliance with air quality standards. Large-scale deployment of DG with the total power of 1200 MW resulted in a maximum impact of 0.6 ppb and the equivalent power from a central plant resulted in a concentration increase of 3 ppb, suggesting that distributed generation emissions are preferred to those of a central power plant with equivalent power.
Similar to ozone, PM concentrations are predicted to increase when DG emissions are introduced for most part of the domain. However, NOx emissions from DG during nighttime lead to reduction in PM2.5 at some locations in the basin. This is attributed to the titration of ozone by NOx leading to a decrease in secondary PM formation. This effect is more evident in scenarios that include performance degradation or high emission levels from DG technologies. The increase in 24-hr average PM2.5 due to DG ranged from 0.2 to 0.7 μg/m3 for the DG penetration levels of 18 58% of increased peak demand in SJV when it is assumed that all DG emits at CARB emission standards.
Both 1-hr ozone and 24-hr average PM2.5 impacts are predicted to be more concentrated in or near the urban areas of the basin (e.g., Stockton, Merced, Fresno, Visalia, and Bakersfield). The locales with highest impacts are shown to occur close to where DG emissions are released. Transport throughout the basin is shown to not significantly affect the locations where air quality impacts of DG are realized.
ACKNOWLEDGMENTS
The Authors gratefully acknowledge the financial support of the California Energy Commission (CEC) for sponsoring this work. Any opinions, findings, and conclusions or recommendations expressed in this material are those of the authors and do not necessarily reflect the views of the CEC. The Authors thank the California Air Resources Board for their provision of the emissions inventory.
Related Research Data
REFERENCES
- Allison , J.E. and Lents , J. 2002 . J. Encouraging Distributed Generation of Power That Improves Air Quality: Can We Have Our Cake and Eat It Too? . Energy Policy , 30 : 737 – 752 .
- Rodriguez , M.A. , Carreras-Sospedra , M. , Medrano , M. , Brouwer , J. , Samuelsen , G.S. and Dabdub , D. 2006 . Air Quality Impacts of Distributed Power Generation in the South Coast Air Basin of California 1: Scenario Development and Modeling Analysis . Atmos. Environ. , 40 : 5508 – 5521 .
- Medrano , M. , Brouwer , J. , Carreras-Sospedra , M. , Rodriguez , M.A. , Dabdub , D. and Samuelsen , G.S. 2008 . A Methodology for Developing Distributed Generation Scenarios in Urban Areas Using Geographical Information Systems . Int. J. Energy Technol. Pol. , 6 : 413 – 434 .
- Carreras-Sospedra , M. , Dabdub , D. , Brouwer , J. , Knipping , E. , Kumar , N. , Darrow , K. , Hampson , A. and Hedman , B. 2008 . Air Quality Impacts of Distributed Energy Resources Implemented in the Northeastern United States . J. Air Waste Manage. Assoc. , 58 : 902 – 912 . doi: 10.3155/1047-3289. 58.7.902.
- Tomashefsky , S. and Marks , M. 2002 . Distributed Generation Strategic Plan; California Energy Commission: Sacramento, California, USA
- Ianucci , J. , Horgan , S. , Eyer , J. and Cibulka , L. 2000 . Air Pollution Emissions Impacts Associated with the Economic Market Potential of Distributed Generation in Californi , a; Distributed Utility Associates : Livermore, California, USA, prepared for The California Air Resources Board .
- Heath , G.A. , Granvold , P.W. , Hoats , A.S. and Nazaroff , WW. 2003 . Intake Fraction Assessment of the Air Pollutant Exposure Implications of a Shift Toward Distributed Electricity Generation . Atmos. Environ. , 40 : 7164 – 7177 .
- Chow , J.C. , Watson , J.G. , Lowenthal , D.H. , Solomon , P.A. , Magliano , K.L. , Ziman , S.D. and Richards , L.W. 1992 . PM10 Source Apportionment in California's San Joaquin Valley . Atmos. Environ. Part A , 26 : 3335 – 3354 .
- Chow , J.C. , Watson , J.G. , Lowenthal , D.H. , Hackney , R. , Magliano , K.L. , Lehrman , D. and Smith , T.B. 1998 . Temporal Variations of PM2.5, PM10, and Gaseous Precursors during the 1995 Integrated Monitoring Study in Central California. In Proceedings of PM2.5: A Fine Particle Standard, January 28-30, Long Beach, California, USA , Edited by: Chow , J.C. and Koutrakis , P. 59 – 77 . PA : Air and Waste Management Association: Pittsburgh .
- Magliano , K.L. , Ranzieri , A.J. and Solomon , P.A. 1998 . Chemical Mass Balance Modeling of the 1995 Integrated Monitoring Study Database. In Proceedings of PM2.5: A Fine Particle Standard, January 28-30, Long Beach, California, USA , Edited by: Chow , J.C. and Koutrakis , P. 824 – 838 . Air and Waste Management Association: Pittsburgh, PA .
- Magliano , K.L. , Ranzieri , A.J. , Solomon , P.A. and Watson , J.G. 1998b . Chemical Mass Balance Modeling of Data from the 1995 Integrated Monitoring Study , Sacramento , CA : California Air Resources Board .
- Chow , J.C. , Chen , L.-W. A. , Watson , J.G. , Lowenthal , D.H. , Magliano , K.A. , Turkiewicz , K. and Lehrman , D.E. 2006 . PM2.5 Chemical Composition and Spatiotemporal Variability during the California Regional PM10/PM2.5 Air Quality Study (CRPAQS) . J.Geophys. Res. , 111 : D10S04 doi: 10.1029/2005JD006457
- Takahama , S. , Wittig , A.E. , Vayenas , D.V. , Davidson , C.I. and Pandis , S.N. 2004 . Modeling the Diurnal Variation of Nitrate during the Pittsburgh Air Quality Study . J.Geophys. Res. , 109 : D16S06 doi: 10.1029/2003JD004149
- Stockwell , W.R. , Watson , J.G. , Robinson , N.F. , Steiner , W. and Sylte , W.W. 2000 . The Ammonium Nitrate Particle Equivalent of NOx Emissions for Wintertime Conditions in Central California's San Joaquin Valley . Atmos. Environ. , 34 : 4711 – 4717 .
- Held , T. , Ying , Q. , Kaduwela , A. and Kleeman , M.J. 2004 . Modeling Particulate Matter in the San Joaquin Valley with a Source-Oriented Externally Mixed Three-Dimensional Photochemical Grid Model . Atmos. Environ. Part A , 38 : 3689 – 3711 .
- Ying , Q. and Kleeman , M.J. 2006 . Source Contributions to the Regional Distribution of Secondary Particulate Matter in California . Atmos. Environ. , 40 : 736 – 752 .
- Lehrman , D.E. , Smith , T.B. and Knuth , W.R. 1998 . California Regional PM10/PM2.5 Air Quality Study (CRPAQS) 1995 Integrated Monitoring Study Data Analysis: Work Element 2.2.2Meteorological Representativeness and Work Element 2.2.3 Fog and Low Clouds Characteristics , T&B System : Santa Rosa, CA .
- Watson , J.G. 2002 . Visibility: Science and Regulation . J.Air Waste Manag. Assoc. , 52 : 628 – 713 .
- Morris , R.E. , Yarwood , G. , Emery , C. and Koo , B. 2004 . Development and Application of the CAMx Regional One-Atmosphere Model to Treat Ozone, Particulate Matter, Visibility, Air Toxics and Mercury. Presented at 97th Annual Conference and Exhibition of the A&WMA, Indianapolis, IN, USA, June 22-25
- Byun , D.W. and Ching , J.K.S. 1999 . Science Algorithms of the EPA Models-3 Community Multiscale Air Quality (CMAQ) Modeling System; EPA/600/R-99/030; United States Environmental Protection Agency, Office of Research and Development: Washington, DC, USA
- Yarwood , G. , Stoeckenius , T.E. and Dunker , A.M. 2003 . Modeling Weekday/Weekend Ozone Differences in the Los Angeles Region for 1997 . J.Air Waste Manag. Assoc. , 53 : 864 – 875 .
- Nam , J. , Kimura , Y. , Vizuete , W. , Murphy , C. and Allen , D.T. 2006 . Modeling the Impacts of Emission Events on Ozone Formation in Houston; Texas . Atmos. Environ. , 40 : 5329 – 5341 . doi: 10.1016/j.atmosenv.2006.05.002
- Nobel , C.E. , McDonald-Buller , E.C. , Kimura , Y. and Allen , D.T. 2001 . Accounting for Spatial Variation of Ozone Productivity in NOx Emission Trading . Environ. Sci. Technol. , 35 : 4397 – 4407 . doi: 10.1021/es001931d
- Eder , B. and Yu , S. 2005 . A Performance Evaluation of the 2004 Release of Models-3 CMAQ . Atmos. Environ. , 40 : 4811 – 4824 .
- Tong , D.Q. and Mauzerall , D.L. 2006 . Spatial Variability of Summertime Tropospheric Ozone over the Continental United States: Implications of an Evaluation of the CMAQ Model . Atmos. Environ. , 40 : 3041 – 3056 .
- Zhang , Y. , Liu , P. , Queen , A. , Misenis , C. , Pun , B. , Seigneur , C. and Wu , S.-Y. 2006 . A Comprehensive Performance Evaluation of MM5-CMAQ for the Summer 1999 Southern Oxidants Study Episode, Part II.Gas and Aerosol Predictions . Atmos. Environ. , 40 ( 4839- ) : 4855
- Carter, W.P.L. Documentation of the SAPRC-99 Chemical Mechanism for VOC Reactivity Assessment. Final Report to the California Air Resources Board, Contracts 92-329 and 95-308; Center for Environmental Research and Technology, University of California: Riverside, California, USA, May 2000 http://www.cert.ucr.edu/~carter/absts.htm (http://www.cert.ucr.edu/~carter/absts.htm) (Accessed: August 2011 ).
- Binkowski , F.S. and Shankar , U. 1995 . The Regional Particulate Model 1. Model Description and Preliminary Results . J.Geophys. Res. , 100 : 26191 – 26209 . D12
- Whitby , E.R. , McMurry , P.H. , Shankar , U. and Binkowski , F.S. Modal Aerosol Dynamics Modeling, Rep. 6003-91020, Atmospheric Research and Exposure Assessment Laboratory; NTIS PB91-161729AS; U.S. Environmental Protection Agency , NC, 1991 : Research Triangle Park .
- Whitby , E.R. and McMurry , P.H. 1997 . Modal Aerosol Dynamics Modeling . Aerosol Sci. Technol. , 27 : 673 – 688 .
- Watson , J.G. , DuBois , D.W. , DeMandel , R. , Kaduwela , A.P. , Magliano , K.L. , McDade , C. , Mueller , P.K. , Ranzieri , A.J. , Roth , P.M. and Tanrikulu , S. 1998 . Field Program Plan for the California Regional PM10/PM2.5 Air Quality Study (CRPAQS) , Desert Research Institute : Reno, NV .
- Jackson , B. , Chau , D. , Gurer , K. and Kaduwela , A. 2006 . Comparison of Ozone Simulations Using MM5 and CALMET/MM5 Hybrid Metrological Fields for the July/August 2000 CCOS Episode . Atmos. Environ. , 40 : 2812 – 2822 .
- Lerhman , D. , Knuth , B. and Fairly , D. 2003 . Characterization of the CCOS 2000 Measurement Period. T&B Systems Contract No. 01-2CCOS , Sacramento , CA : California Air Resources Board, Planning and Technical Support Division .
- SJVAPCD.1-Hour Extreme Ozone Attainment Demonstration Plan, adopted by the San Joaquin Valley Air Pollution Control District. 2004 http://www.valleyair.org/Air_Quality_Plans/AQ_plans_Ozone_ Final.htm (http://www.valleyair.org/Air_Quality_Plans/AQ_plans_Ozone_ Final.htm) (Accessed: August 2011 ).
- Kaduwela , A. 2005 . Ozone and PM2.5 Monitoring Data in the San Joaquin Valley During the California Regional Particulate Air Quality Study, December 1999 to December 2000 , Sacramento , CA : The California Air Resources Board .
- Samuelsen , G.S. , Dabdub , D. , Brouwer , J. , Medrano , M. , Rodriguez , M. and Carreras-Sospedra , M. 2005 . Air Quality Impacts of Distributed Generation; CEC-500-2005-069-F; California Energy Commission, PIER Energy-Related Environmental Research: Sacramento, California, USA
- SJVAPCD.2007 Ozone Plan, adopted by the San Joaquin Valley Air Pollution Control District, 2007 http://www.valleyair.org/Air_ Quality_Plans/AQ_Final_Adopted_Ozone2007.htm (http://www.valleyair.org/Air_ Quality_Plans/AQ_Final_Adopted_Ozone2007.htm) (Accessed: August 2011 ).
- EPRI . 2005 . Assessment of California Combined Heat and Power Market and Policy Options for Increased Penetration; CEC-500-2005-173; Electric Power Research Institute: Palo Alto, CA, California Energy Commission Sacramento , CA
- EIA . 2006 . 2006 Annual Energy Outlook; Energy Information Administration: Washington, DC, USA
- Marnay , C. , Chard , J.S. , Hamachi , K.S. , Lipman , T. and Moezzi , M.M. 2001 . Modeling of Customer Adoption of Distributed Energy Resources, Consortium for Electric Reliability Technology Solutions; Ernest Orlando Lawrence Berkeley National Laboratory, prepared for California Energy Commission Sacramento , CA
- Nexus . 2002 . Performance and Cost Trajectories of Clean Distributed Generation Technologies; Energy Nexus Group, prepared for the Energy Foundation: San Francisco, California, USA
- NRE , L. 2003 . Gas Fired Distributed Generation Technology Characterization: Microturbines; Energy and Environmental Analysis, Inc., prepared for National Renewable Energy Laboratory: Golden, Colorado, USA
- CARB.The 2002 California Almanac of Emissions and Air Quality of the California Air Resources Board. 2002 http://www.arb.ca.gov/aqd/almanac/almanac.htm (http://www.arb.ca.gov/aqd/almanac/almanac.htm)
- CaSIL.California Spatial Information Library. 2006 http://atlas.ca.gov/ (http://atlas.ca.gov/)
- EIA. 2002 Manufacturing Energy Consumption Survey (MECS); Energy Information Agency: Washington, DC, 2003 http://www.eia.gov/emeu/mecs/ (http://www.eia.gov/emeu/mecs/)
- EI , A. 2003 . A Look at Residential Energy Consumption (RECS) in 2001; Energy Information Agency: Washington, DC http://www.eia.gov/emeu/recs/recs2001/detail_tables.html (accessed August 2011).
- EI , A. 2003 . A Look at Building Activities in the 2003 Commercial Buildings Energy Consumption Survey (CBECS); Energy Information Agency: Washington, DC http://www.eia.gov/emeu/cbecs/cbecs2003/detailed_tables_2003/detailed_tables_2003.html (accessed August 2011).
- Samuelsen , G.S. , Dabdub , D. , Brouwer , J. , Carreras-Sospedra , M. and Vutukuru , S. 2009 . Air Quality Impacts of Distributed Generation in the South coast Air Basin and the San Joaquin Valley Regions of California; CEC-500-2009-070; California Energy Commission, PIER Energy-Related Environmental Research Sacramento , CA 2009
- Rodriguez , M.A. , Brouwer , J. , Samuelsen , G.S. and Dabdub , D. 2007 . Air Quality Impacts of Distributed Power Generation in the South Coast Air Basin of California 2: Model Uncertainty and Sensitivity Analysis . Atmos. Environ. , 41 : 5618 – 5635 .
- Vijayaraghavan , K. , Karamchandani , P. and Seigneur , C. 2006 . Plume-in-grid Modeling of Summer Air Pollution in Central California . Atmos. Environ. , 40 : 5097 – 5109 .
- 1999 . California Energy Commission (CEC). Commission Decision: Application for Certification for La Paloma Generating Power Plant Project; Docket No. 98-AFC-2; La Paloma Generating Company, LLC: Sacramento, California, USA
- Karamchandani , P. , Vijayaraghavan , K. , Chen , S.-Y. , Balmori , R. , Knipping , E. and Kumar , N. October 19-21 2009 . Evaluation and Application of AMSTERDAM.Presented at 8th Annual Community Modeling and Analysis System Conference October 19-21 , Chapel Hill , NC
- Kay , M. 2008 . Internal Communication. South Coast Air Quality Management District: Sacramento, California, USA
- Watson , J.G. and Chow , J. 2002 . A wintertime PM2.5 Episode at the Fresno, CA, Supersite . Atmos. Environ. , 36 : 465 – 475 .
- Meng , Z. , Dabdub , D. and Seinfeld , J.H. 1997 . Chemical Coupling between Atmospheric Ozone and Particulate Matter . Science , 277 : 116 – 119 .
- Nguyen , K. and Dabdub , D. 2002 . NOx and VOC control and its effect on the formation of aerosols . Aerosol Sci. Technol. , 36 : 560 – 572 .