ABSTRACT
This study investigated the seasonal variation and spatial distribution of gaseous and particulate mercury at a unique mercury-contaminated remediation site located at the near-coastal region of Tainan City, Taiwan. Gaseous elemental mercury (GEM), particulate mercury (PTM), and dustfall mercury (DFM) were measured at six nearby sites from November 2009 to September 2010. A newly issued Method for Sampling and Analyzing Mercury in Air (National Institute of Environmental Analysis [NIEA] Method A304.10C) translated from U.S. Environmental Protection Agency (EPA) Method IO-5, was applied for the measurement of atmospheric mercury in this particular study. One-year field measurements showed that the seasonal averaged concentrations of GEM and PTM were in the range of 5.56–12.60 and 0.06–0.22 ng/m3, respectively, whereas the seasonal averaged deposition fluxes of DFM were in the range of 27.0–56.8 g/km2-month. The maximum concentrations of GEM and PTM were 38.95 and 0.58 ng/m3, respectively. The atmospheric mercury apportioned as 97.42–99.87% GEM and 0.13–2.58% PTM. As a whole, the concentrations of mercury species were higher in the springtime and summertime than those in the wintertime and fall. The southern winds generally brought higher mercury concentrations, whereas the northern winds brought relatively lower mercury concentrations, to the nearby fishing villages. This study revealed that the mercury-contaminated remediation site, an abandoned chlor-alkali manufacturing plant, was the major mercury emission source that caused severe atmospheric mercury contamination over the investigation region. The hot spot of mercury emissions was allocated at the southern tip of the abandoned chlor-alkali manufacturing plant. On-site continuous monitoring of GEM at the mercury-contaminated remediation site observed that GEM concentrations during the open excavation period were 2–3 times higher than those during the nonexcavation period.
A manual and an auto-monitoring technique were successfully applied to sample gaseous and particulate mercury at a unique mercury-contaminated remediation site and further measured with a cold-vapor atomic fluorescence spectrometry (CVAFS). The mercury-contaminated remediation site was announced as a supersite of mercury contamination by the Environmental Protection Bureau (EPB) of Tainan City in 2003, causing significant contamination of atmospheric mercury over the investigation region. Both ambient temperature and prevailing wind direction played critical roles on the tempospatial variation and partition of gaseous and particulate mercury in the ambient atmosphere.
INTRODUCTION
The concern of mercury pollution arises from the health effects caused by the existences of elemental mercury and its derivatives in the atmosphere and in the water bodies.Citation1,Citation2 Elemental mercury and most of its derivatives are metabolic poisons causing neurological and reproductive damage in terrestrial and aquatic organisms.Citation3 According to the estimates of global mercury budget, 6000 and 10,800 tons of mercury are currently present in the troposphere and in the water bodies on earth, respectively.Citation4 Recently, atmospheric mercury has been claimed as one of the most important global environmental issues following greenhouse gas effects.Citation5 It could also cause critical local and regional environmental impacts on ambient air quality of industrial locations near anthropogenic emission sources.Citation6,Citation7 United Nations Environmental Programme (UNEP)Citation8 reported that the emission of mercury from anthropogenic emission sources is estimated to be approximately 4000 tons per year. Emission sources, regional atmospheric chemistry, and near-ground micrometeorological conditions may influence the temporal variation and spatial distribution of atmospheric mercury speciation, concentration, and deposition flux.Citation9–11
Mercury is a persistent, toxic, and bioaccumulative heavy metal that exists primarily in three forms in the atmospheric environment: gaseous mercury including elemental and reactive mercury, and particulate mercury.Citation12,Citation13 Among them, elemental mercury has high volatility, low chemical reactivity, and low solubility in water, which accounts for more than 95% of total gaseous mercury (TGM) and has a residence time of 1–2 years in the atmosphere, which can be transported over great distances across continents,Citation14–16 whereas reactive mercury is relatively abundant in the particulate phase and has a residence time of several days or a few weeks. Background concentrations of particulate mercury have been shown to be 0.3–0.5% of TGM except in the industrialized regions (up to 40% of TGM).Citation17 Moreover, the partition of inorganic mercury species vary between locations.Citation18–21
The chemical and physical properties of mercury and its derivatives dominate their behavior in the atmosphere and their significance as environmental contaminants.Citation14 Gaseous elemental mercury is mainly emitted from anthropogenic sourcesCitation6 and mercury associated with airborne particulate matter is also largely of anthropogenic origin.Citation22 Major anthropogenic emission sources include point sources (e.g., municipal and industrial waste incinerators, fossil-fuel combustion, iron/steel smelting plants, petroleum refineries, cement plants, etc.) and area sources (e.g., industrialized region, mercury-contaminated site, etc.). The global background concentration of gaseous elemental mercury (GEM) is in the range of 1–2 ng/m3 and some of them could be further oxidized in ambient atmosphere and in clouds as well.Citation12,Citation23 Deposition fluxes of mercury are strongly affected by gas–particle partitioning, since gases and particles deposit via different mechanisms.Citation24,Citation25
To date, many field studies have been conducted for atmospheric mercury measurements.Citation9,Citation10,Citation23,Citation26,Citation27 Yet none have been done for measuring atmospheric mercury speciation and concentration at a unique mercury-contaminated remediation site. For this purpose, a 1-year field campaign was designated to measure the tempospatial variation and partition of gaseous and particulate mercury, as well as the deposition flux of wet/dry mercury at the mercury-contaminated remediation site located at the near-coastal region of Tainan City, Taiwan.
METHODOLOGIES
Sampling Site Selection and Description
Atmospheric mercury speciation and concentration measurement was conducted at the unique mercury-contaminated remediation site (23°1′52″N latitude, 120°7′19″E longitude) that was announced as a supersite of mercury contamination by the Environmental Protection Bureau (EPB) of Tainan City in 2003.Citation28,Citation29 It was originally an abandoned chlor-alkali manufacturing plant in which liquid-phase elemental mercury is used as a flowing cathode to produce sodium hydroxide and chlorine from 1947 to 1990.Citation13 The abandoned chlor-alkali manufacturing plant surrounding with farms and fishing ponds is situated about 1.5 km from the western coastline of Tainan City (). The investigating region is a worldwide noted high mercury-contaminated site. There had been a chlor-alkali manufacturing plant that produced 15,000 tones chlor-alkali per year by consuming 2.4 tones mercury per year, and closed in June 1982. Very high concentration of mercury, up to 3370 mg/kg, was observed in the surface soil of 0–1 m below ground, mainly spread over the southern portion of the mercury-contaminated region. The northeast of the investigating region had a residential community including three fishing villages, whereas the south is mostly fishing ponds and farms. Three fishing villages with a total population of approximately 2000 are located about 0.5–1.0 km from the northeastern tip of the abandoned chlor-alkali manufacturing plant. The area of the abandoned chlor-alkali manufacturing plant is approximately 38.4 ha. No other point and area emission sources are known around the investigation region. Long-term emissions of mercury and dioxins from the mercury-contaminated site were highly concerned by the general publics as well as Environmental Protection Bureau of Tainan City.
Figure 1. Landscape and site locations of the atmospheric mercury sampling network surrounding the mercury-contaminated remediation site.
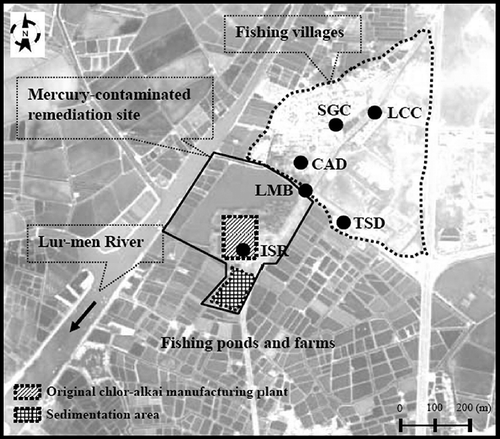
Consequently, it is important to investigate the seasonal variation and spatial distribution of gaseous and particulate mercury at such a unique mercury-contaminated remediation site. As illustrated in , a mercury sampling network of six sites was designated to cover an in situ remediation (ISR) site, the boundary Lur-Men Bridge (LMB) site, and four other nearby sampling sites, including Tai-Salt Dormitory (TSD) site, Chlor-Alkali Dormitory (CAD) site, Shen-Goum Community (SGC) site, and Lur Community Center (LCC) site. Site ISR is located at the area of the highest mercury concentration in the surface soil. Site LMB is adjacent to the boundary of the mercury-contaminated site that is close to the outlet of runoff drained from the chlor-alkali manufacturing plant. Sites TSD, CAD, SGC, and LCC are located at the sensitive points of the downwind communities. Among them, Site SGC is located at an elementary school, and sites TSD, CAD, and LCC are located at the community centers of three fishing villages.
Sampling Methods
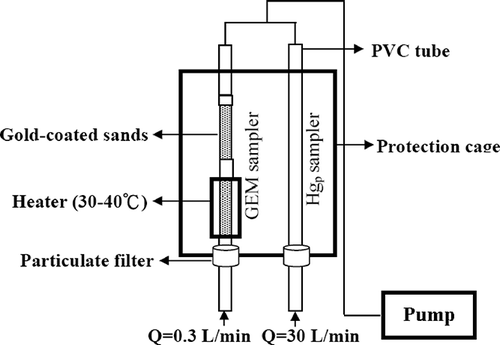
In this work, a newly issued Method for Sampling and Analyzing Mercury in Air (NIEA A304.10C; Taiwan Environmental Protection Agency [EPA]), is translated from U.S. EPA Method IO-5, was applied to measure the speciation and concentration of atmospheric mercury. The schematic diagram of a separate mercury sampling system used to collect atmospheric mercury in the vapor and particle phases is illustrated in . In this system, GEM was captured on the surface of gold-coated sands through amalgamation with a constant air flow of 0.3 L/min. The inlet air was initially filtered to trap particles and then heated at 30–40 °C to remove moisture, which could cause interferences in the adsorption of GEM on the surface of gold-coated sands, whereas particulate mercury (PTM) was collected by a 47-mm glass fiber filter with a constant air flow of 30 L/min. The sampling system was operated to simultaneously collect GEM and PTM at each site for 24 hr, whereas dustfall was sampled with a standard dustfall collector for the duration of 1 month at each sampling site. All mercury samples were collected in four seasons from November 2009 to September 2010 (springtime: February–April; summertime: May–July; fall: August–October; wintertime: November–January of next year).
Analytical and Monitoring Methods
After sampling, the adsorbed elemental mercury was initially desorbed at 300–400 °C and further measured with a cold-vapor atomic fluorescence spectrometry (CVAFS). The method detection limits (MDLs) achieved using NIEA A304.10C were 0.030 and 0.045 ng/m3 for particle- and vapor-phase mercury, determined as triple the standard deviation (SD) of the instrumental blank values.
For vapor-phase mercury, samples were analyzed in duplicate. Repeated injections of vapor-phase mercury standards can be used to assess the analytical precision of less than 5% for the methods described. Particle-phase mercury should be less than 10%, and the correlation coefficient (r) should be 0.995 or higher and each of the points on the calibration curve should be predicted by the slope within 5% differential of their actual values. The calibration curves of GEM and PTM prepared for this study had correlation coefficients (r) of 0.998 and 0.997, respectively. Moreover, the percentages of differences for the repeated injections of GEM and PTM was 3.5% and 5.8%, respectively, which could be used to assess the analytical precision of Method NIEA A304.10C.
Furthermore, particle-phase mercury collected on the glass-fiber filters was initially extracted in a nitric acid solution using microwave digestion to yield acid-extractable particulate mercury prior to analysis. The extract was oxidized with BrCl to convert all forms of Hg to Hg2+ and SnCl2 was added to the extract to reduce Hg2+ to volatile Hg0. The Hg0 was further liberated from the extract by purging with inert Ar gas and collected on the surface of gold-coated sands. The amount of mercury collected on the gold-coated sands was then determined with the CVAFS.
Moreover, a continuous mercury-monitoring instrument (Tekran, Model 2537B, Canada) was also operated to measure gaseous elemental mercury in the near-surface atmosphere with a sampling cycle of 6.0 min. The continuous monitoring data were further compared in parallel with the measurement data obtained from Method NIEA A304.10C to ensure the accuracy of two GEM measurement methods. The measurement of atmospheric mercury with different sampling and measuring techniques world make the measuring data more reliable. Additionally, a meteorological measurement system was used to measure ambient temperature (Temp.), relative humidity (RH), wind speed (WS), wind direction (WD), and ultraviolet radiation (UVB). The field measured Meteorological data are listed in .
Table 1. Meteorological measurement data during the atmospheric mercury sampling periods
Furthermore, the concentration contours of atmospheric mercury were drawn with Surfer, a spatial plotting software, in this study. It has been used extensively for terrain modeling, landscape visualization, surface analysis, contour mapping, etc. This article takes the gap of internal grid as a calculation base, overlaying the data of atmospheric mercury concentration obtained from each sampling site of the mercury-contaminated remediation site. The concentration of atmospheric mercury outside the sampling zone could be estimated by extrapolation.
RESULTS AND DISCUSSION
Seasonal Variation and Partition of GEM and PTM
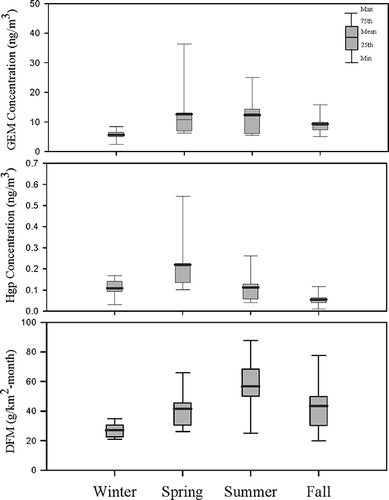
illustrates the seasonal variation of GEM, PTM, and DFM concentrations at the mercury-contaminated remediation site in four seasons. The field measurement data as well as its mean, median, standard deviation (SD), and partition of GEM and PTM are summarized in .
Table 2. Field measurement of atmospheric mercury concentrations and their mean, median, standard deviation (SD), and partition of GEM, PTM, and DFM at each sampling sites
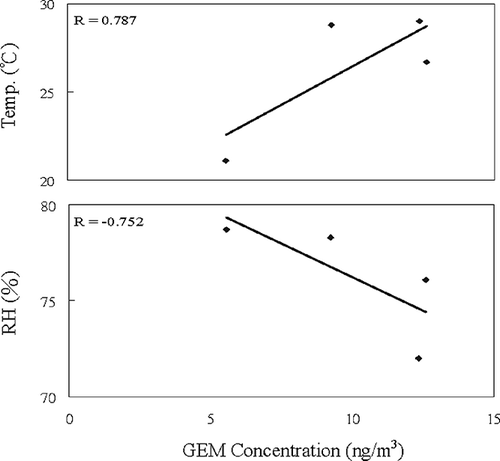
The highest concentration of GEM was observed in the springtime and summertime, whereas the lowest GEM was observed in the wintertime. It showed that ambient temperature might play a critical role on the emission of GEM to the atmosphere, since mercury and its derivates can be emitted directly from the ground surface of the contaminated site owing to their low vapor pressure. summaries the correlation coefficients of GEM, PTM, and DFM concentrations, ambient temperature, relative humidity, ultraviolet B ray (wavelength 280–320 nm; UVB), and wind speed. GEM concentration correlated positively with ambient temperature (r = 0.787) and UVB (r = 0.756), and negatively with relative humidity (r = −0.752). PTM concentration correlated positively with wind speed (r = 0.917). DFM concentration correlated positively with ambient temperature (r = 0.744) and UVB (r = 0.957), and negatively with relative humidity (r = −0.971). The results indicated that ambient temperature, UVB, and relative humidity highly influenced the concentrations of GEM and DFM, whereas PTM concentration was solely influenced by wind speed. also illustrates the correlation of GEM concentrations, ambient temperature, and relative humidity. Furthermore, Liu et al. (2002) revealed that mercury contained in soils tends to be vaporized to the atmosphere in summertime. Besides, both vaporizing point and melting point of mercury are low, thus it is assumed that mercury can be vaporized from soil to the atmosphere at high ambient temperatures, resulting in high mercury concentration in the atmosphere. Moreover, sampling of atmospheric mercury at a background site along the coast of Tainan City showed that the concentrations of GEM and PTM were in the range of 2.03–2.83 and 0.01–0.02 ng/m3, respectively. The average concentrations of GEM during the four seasons were ordered as springtime (12.60 ng/m3) > summertime (12.36 ng/m3) > fall (9.25 ng/m3) > wintertime (5.56 ng/m3). Field measurements indicated that GEM concentrations didn't closely concur with ambient temperature, since relatively high GEM concentration and low temperature were observed in the springtime (see ). Further investigating the wind direction in the investigation area, we found the prevailing wind of the springtime came mainly from the southeast, which blew fugitive GEM from the contaminated area to the downwind sampling sites. It can be proven from the highest GEM concentration always occurred at site ISR in all four seasons.
Table 3. Correlation of GEM, PTM, and DFM with ambient meteorological factors
The average concentrations of PTM during the four seasons were ordered as springtime (0.22 ng/m3) > summertime (0.11 ng/m3) > wintertime (0.11 ng/m3) > fall (0.06 ng/m3). Similar seasonal trend for PTM was found as for GEM except the lowest PTM concentration was observed in the fall. In spite of prevailing wind direction, wind speed might be also critical to this phenomenon. Strong near-surface winds with an averaged wind speed of 2.3 m/sec in the springtime could blow a large amount of fugitive mercury-contained dusts to the atmosphere. In the fall, the wind field was dominated by sea-land breezes with relatively low wind speed of 0.8–2.6 m/sec, resulting in the lowest PTM concentration among the four seasons.
summarizes the partition of vapor- and particle-phase mercury in four seasons at the mercury-contained remediation site. In this work, the partition of vapor- and particle-phase mercury was determined by the concentrations of GEM and PTM due to the fact that the concentration of reactive gaseous mercury (RGM) is very much lower than that of GEM.Citation9,Citation13 The averaged partitions of GEM in wintertime, springtime, summertime, and fall were 98.15%, 98.13%, 99.11%, and 99.43%, respectively, whereas the averaged partitions of PTM in wintertime, springtime, summertime, and fall were 1.85%, 1.87%, 0.89%, and 0.57%, respectively. It showed that the partitions of PTM in the springtime and wintertime were 2–3 times higher than those in the summertime and fall. It was mainly attributed to relatively strong winds blown in the springtime and wintertime causing high emissions of fugitive dusts containing mercury to the downwind region. The PTM partitions of 0.13–2.58% in this mercury-contaminated site were much lower than previous reports of 2–15% and some even up to 40% at the industrialized region.Citation9,Citation14,Citation17
Spatial Distribution of GEM and PTM
The concentrations of GEM and PTM measured at each site are summarized in . For all seasons, the concentrations of GEM and PTM at site ISR, the most polluted in situ site, were always the highest compared to other sampling sites. The concentrations of GEM and PTM measured at site LMB ranked the second, since it is situated at the boundary of the abandoned chlor-alkali manufacturing plant. For each individual 24-hr mercury measurement data set, the maximum GEM and PTM concentrations of 38.95 and 0.58 ng/m3 were observed at site ISR in the springtime. The minimum GEM and PTM concentrations of 2.33 and 0.03 ng/m3 were observed at site SGC in the wintertime. Up to 16.7 times differences of GEM between site ISR and site SGC suggested that the abandoned chlor-alkali manufacturing plant is indeed a continuous mercury emission site, which would cause severe adverse effects on human health at the three nearby fishing villages.
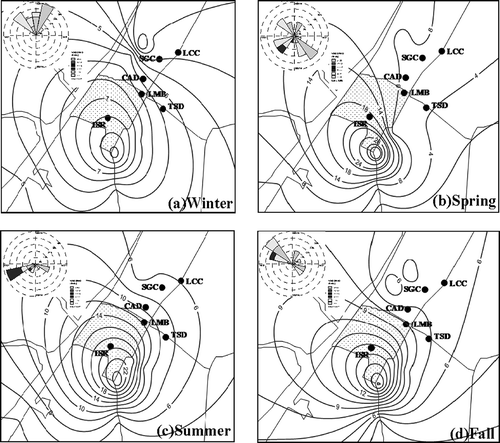
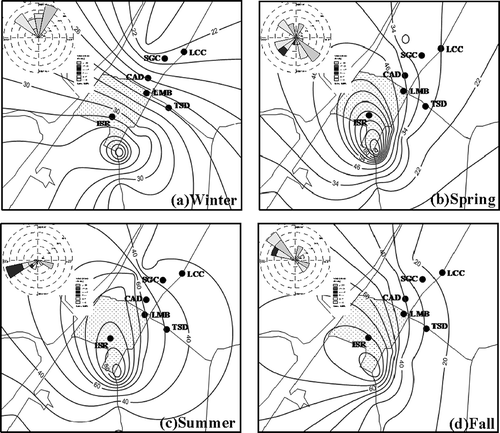
further illustrates the concentration contours of GEM plus PTM (GEM + PTM) in the region surrounding the abandoned chlor-alkali manufacturing plant in four seasons. The concentrations of GEM + PTM herein represent the exposure from major amount of atmospheric mercury through inhalation. The hot spots of GEM + PTM emissions in all seasons were allocated at the southern tip of the abandoned chlor-alkali manufacturing plant, which concurred with the location of the heavily polluted mercury-contaminated area. The spatial distribution of GEM + PTM showed that atmospheric mercury had a tendency to disperse from the southern hot spot of the abandoned chlor-alkali manufacturing plant and transport to the northern nearby fishing villages. The spatial distributions of GEM + PTM versus prevailing winds showed that, as the northern winds were blowing in the wintertime and fall (see and d), the concentrations of GEM + PTM were generally lower at all sampling sites. As the southern winds were blowing in the springtime and summertime (see and c), the concentrations of GEM + PTM were always higher at all sampling sites.
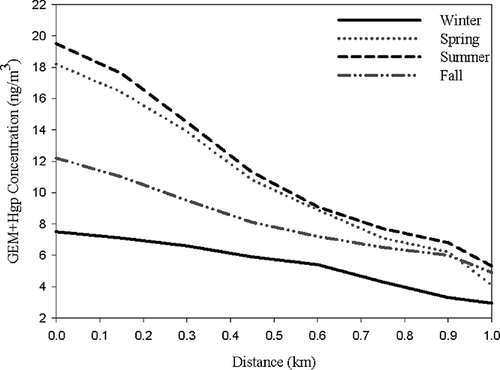
Further plotting the concentration of GEM + PTM versus transportation distance is illustrated in . In the summertime, the concentration of GEM + PTM decreased from 19.51 ng/m3 at the hot spot to 6.83 ng/m3 at the location with downwind distance of 1.0 km. Similar trends were observed in the springtime as in the wintertime, since the prevailing southern winds were blown in these two seasons. However, as the northern winds were blowing in the seasons of wintertime and fall, the rates of GEM + PTM concentration decreases were relatively lower than those in the wintertime and fall.
Mercury Emission from Open Excavation
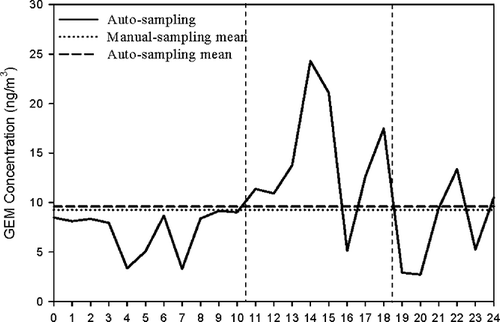
The comparison of auto-monitoring (Tekran, model 2537B) with manual sampling (NIEA A304.10C) of GEM is illustrated in . The auto-monitoring of GEM was conducted continuously from 12:00 a.m. to 12:00 a.m., and the manual sampling of GEM was conducted for each 8 hours on April 10, 2010. A sharp variation of GEM concentration was observed in the range of 2.68–24.95 ng/m3. Overall speaking, the daytime GEM concentrations (8:00 am to 6:00 pm) were much higher than the nighttime GEM concentrations (6:00 pm to 8:00 am), which concurred with previous reports.Citation9,Citation30,Citation31 Higher GEM concentration at the daytime was mainly attributed to the fact that photochemical reactions could reduce Hg2+ to volatile Hg0.
Open excavation of topsoil down to 1.5 m below ground was conducted from 10:30 a.m. to 6:30 p.m. on April 10, 2010. During the open excavation period, two peaks of GEM concentration were observed as 24.95 and 17.08 ng/m3 at 1:52 p.m. and 5:58 p.m., respectively. The concentration of GEM increased dramatically from 10.49 to 24.95 ng/m3 due to the emissions of mercury and its derivatives to the atmosphere during the open excavation period. The averaged GEM concentration of 9.63 ng/m3 measured by the continuous monitor was almost the same as the 24-hr averaged concentration of 9.57 ng/m3 measured by the manual sampling method. The relative error between the auto-monitoring and the manual sampling methods was as low as 0.63%. The results indicated that these two atmospheric mercury measurement methods are very much identical.
After excavation, the GEM concentrations increased dramatically at several sampling sites. For instance, the GEM concentrations on the ground surface before and after 8-hr open excavation at site CAD were 9.54 and 15.95 ng/m3, respectively, whereas the GEM concentrations on the ground surface before and after 8-hr open excavation at site TSD were 7.30 and 21.18 ng/m3, respectively. Two- to 3-folds higher of GEM concentration could be achieved during the open excavation period at the mercury-contaminated remediation site.
Deposition Flux of Wet/Dry Mercury
The deposition fluxes of wet/dry mercury were determined by measuring the mercury content of dustfall, which was collected by the dustfall collector situated at each sampling site for 1 month. As shown in and , the seasonal deposition fluxes of wet/dry mercury were in the order of summertime > fall > springtime > wintertime. The maximum deposition flux in the summertime should be attributed to the fact that rainfalls of approximately 900–1500 mm frequently fell in the summer season. Large amount of rainwater and high frequency of rainfalls could scavenge the dissolved mercury, including reactive gaseous mercury and particulate mercury, below clouds in the low atmospheric layer. Moreover, the southwestern prevailing winds could blow atmospheric mercury, mainly particle-phase mercury, from the mercury-contaminated remediation site to disperse and then deposit on the downwind region, causing high deposition flux of wet/dry mercury.
On the contrary, the minimum deposition flux of wet/dry mercury occurred in the wintertime. Although the concentration of atmospheric aerosol particles (particulate matter with aerodynamic diameter ≥10 μm [PM10]) in the wintertime (73.08 μg/m3) was the highest among the four seasons (springtime: 51.46 μg/m3; summertime: 38.69 μg/m3; fall: 70.86 μg/m3), the deposition fluxes of wet/dry mercury in the wintertime were, however, the lowest compared to other seasons at all sampling sites. The results indicated that both the frequency and the amount of rainfalls played critical roles to determine the deposition flux of wet/dry mercury in southern Taiwan. The deposition fluxes of wet/dry mercury in the fall and springtime were actually quite similar, and ranked the second and the third highest, respectively.
illustrates the deposition flux contour of DFM surrounding the mercury-contaminated remediation site in four seasons. Similar to the spatial distribution of GEM + PTM concentration, the deposition flux of wet/dry had a tendency to vary from the highest at the southern hot spot to the lowest at the nearby fishing villages. Additionally, the dispersion of DFM closely followed the prevailing wind direction for different seasons. The results implied that the wet/dry mercury deposited at the downwind region could be emitted from the abandoned chlor-alkali manufacturing plant.
CONCLUSIONS
The tempospatial variation and partition of gaseous and particulate mercury were investigated surrounding an abandoned chlor-alkali manufacturing plant. This study revealed that atmospheric mercury apportioned as 97.42–99.87% GEM and 0.13–2.58% PTM. The partitions of PTM in the springtime and wintertime were approximately 2–3 times higher than those in the summertime and fall. This phenomenon was attributed to relatively strong winds blown in the springtime and wintertime, causing high fugitive dusts containing mercury to the downwind fishing villages. The variation of seasonal GEM + PTM concentration with prevailing winds showed that the concentrations of GEM + PTM were generally low at all sampling points when northern winds were blowing in the wintertime and fall. On the contrary, when southern winds were blowing in the springtime and summertime, the concentrations of GEM + PTM were always high at all sampling sites. Moreover, the daytime GEM concentrations were much higher than the nighttime GEM concentrations. Higher GEM concentration at the daytime was mainly attributed to the fact that photochemical reactions could reduce divalent Hg to volatile elemental Hg. Although the concentration of atmospheric aerosol particles in the wintertime was the highest among the four seasons, the deposition fluxes of wet/dry mercury in the wintertime were, however, the lowest compared to other seasons. The frequency and the amount of rainfalls dominated the deposition flux of wet/dry mercury over the investigation region. The deposition fluxes of wet/dry mercury in the fall and springtime were similar and ranked the second and the third highest, respectively. Overall speaking, the abandoned chlor-alkali manufacturing plant was proven as the mercury emission source, which could cause severe atmospheric mercury contamination at the fishing villages. Both ambient temperature and prevailing wind direction play critical roles on the tempospatial variation and partition of gaseous and particulate mercury in the atmosphere.
ACKNOWLEDGMENTS
The authors gratefully acknowledge the financial support and kind assistance from Central Technology Company through project grants PJ9854 and PJ9925.
REFERENCES
- Lin , C.J. and Pehkonen , S.O. 1999 . The Chemistry of Atmospheric Mercury: A Review . Atmos. Environ. , 33 : 2067 – 2079 .
- Clarkson , T.W. and Magos , L. 2006 . The Toxicity of Mercury and Its Chemical Compounds . Crit. Rev. Toxicol , 36 ( 8 ) : 609 – 662 .
- U.S. Environmental Protection Agency . June 1999 . Compendium of Methods for the Determination of Inorganic Compounds in Ambient Air—Chapter IO-5, Sampling and Analysis for Atmospheric Mercury , June , Research Park Triangle , NC : Center for Environmental Research Information, Office of Research and Development . EPA/625/R-96/010a
- Mason , R.P. , Fitzgerald , W.F. and Morel , M.M. 1994 . The Biogeochemical Cycling of Elemental Mercury: Anthropogenic Influences . Geochim. Cosmochim. Acta , 58 : 3191 – 3198 .
- United Nations Environmental Programme (UNEP) . December 2008 . The Global Atmospheric Mercury Assessment: Sources, Emissions and Transport , December , Geneva : UNEP .
- Nelson , P.F. 2007 . Atmospheric Emissions of Mercury from Australian Point Sources . Atmos. Environ. , 41 : 1717 – 1724 .
- Kim , K.-H. and Kim , M.-Y. 2000 . The Effects of Anthropogenic Sources on Temporal Distribution Characteristics of Total Gaseous Mercury in Korea . Atmos. Environ. , 34 : 3337 – 3347 .
- United Nations Environmental Programme (UNEP) . December 2002 . Global Mercury Assessment , December , Geneva : UNEP .
- Poissant , L. , Pilote , M. , Beauvais , C. , Constant , P. and Zhang , H.H. 2005 . A Year of Continuous Measurements of Three Atmospheric Mercury Species (GEM, RGM, and Hgp) in Southern Quebec, Canada . Atmos. Environ. , 39 : 1275 – 1287 .
- Poissant , L. and Hoenninger , G. 2004 . Atmospheric Mercury and Ozone Depletion Events Observed at the Hudson Bay in Northern Quebec along to BrO (DOAS) Measurements . RMZ Mater. Geoenviron. , 51 : 1722 – 1725 .
- Johnson , D.L. and Braman , R.S. 1974 . Distribution of Atmospheric Mercury Species Near the Ground . Environ. Sci. Technol. , 8 : 1002 – 1009 .
- Schroeder , W.H. and Munthe , J. 1998 . Atmospheric Mercury—An Overview . Atmos. Environ. , 32 : 809 – 822 .
- Lin , C.J. and Pehkonen , S.O. 1999 . The Chemistry of Atmospheric Mercury: A Review . Atmos. Environ. , 33 : 2067 – 2079 .
- Boening , D.W. and Pehkonen , S.O . 2000 . Ecological Effects, Transport, and Fate of Mercury: A General Review . Chemosphere , 40 : 1335 – 1351 .
- Lindqvist , O. and Rodhe , H. 1985 . Atmospheric Mercury—A Review . Tellus , 27B : 136 – 159 .
- Slemr , F. , Schuster , G. and Seiler , W. 1985 . Distribution, Speciation and Budget of Atmospheric Mercury . J. Atmos. Chem. , 3 : 407 – 434 .
- Lamborg , C.H. , Hoyer , M.E. , Keeler , G.J. , Olmez , I. and Huang , X. 1995 . “ Particulate-Phase Mercury in the Atmosphere: Collection/Analysis Method Development Band Applications ” . In Mercury Pollution-Integration and Synthesis , Edited by: Watras , C.L. and Hukabee , J.W. 215 – 259 . Boca Raton , FL : Lewis Publisher .
- Sakata , M. and Marumoto , K. 2005 . Wet and Dry Deposition Fluxes of Mercury in Japan . Atmos. Environ. , 39 : 3139 – 3146 .
- Hedgecock , I.M. and Pirronr , N. 2004 . Chasing Quicksilver: Modeling the Atmospheric Lifetime of Hg-(g)(0) in the Marine Boundary Layer at Various Latitudes . Environ. Sci. Technol. , 38 : 69 – 76 .
- Landis , M.S. and Keeler , G.J. 2002 . Atmospheric Mercury Deposition to Lake Michigan during the Lake Michigan Study . Environ. Sci. Technol. , 36 : 4518 – 4525 .
- Lamborg , C.H. , Fitzgerald , W.F. , Vandal , G.M. and Rolfhus , K.R. 1995 . Atmospheric Mercury in Northern Wisconsin: Sources and Species . Water Air Soil Pollut. , 80 : 198 – 206 .
- Xiao , Z.F. , Munthe , J. , Schroeder , W.H. and Lindqvist , O. 1991 . Sampling and Determination of Gaseous and Particulate Mercury in the Atmosphere Using Gold-Coated Denuders . Water Air Soil Pollut. , 56 : 141 – 151 .
- Friedli , H.R. , Radke , L.F. , Lu , J.Y. , Banic , C.M. , Leaitch , W.R. and MacPherson , J.I. 2003 . Mercury Emissions from Burning of Biomass from Temperate Northern American Forests: Laboratory and Airborne Measurements . Atmos. Environ. , 37 : 253 – 267 .
- Rutter , A.P. and Schauer , J.J. 2007 . The Effect of Temperature on the Gas-Particle Portioning of Reactive Mercury in the Atmospheric Aerosols . Atmos. Environ. , 41 : 8647 – 8657 .
- Seinfeld , J.H. and Pandis , S.N. 1998 . Atmospheric Chemistry and Physics: From Air Pollution to Climate Change , New York : Wiley-Interscience .
- Golubeva , N. , Burtseva , L. and Matishov , G. 2003 . Measurements of Mercury in the Near-Surface Layer of the Atmosphere of Russian Arctic . Sci. Total Environ. , 306 : 3 – 9 .
- Malcolm , E.G. and Keeler , G.J. 2002 . Measurements of Mercury in Dew: Atmospheric Removal of Mercury Species to a Wetted Surface . Environ. Sci. Technol. , 36 : 2815 – 2821 .
- Chang , J.W. , Pai , M.C. , Chen , H.L , Guo , H.R. , Su , H.J. and Lee , C.C. 2008 . Cognitive Function and Blood Methylmercury in Adults Living Near a Deserted Chloralkali Factory . Environ. Res. , 108 : 334 – 339 .
- Chang , J.W. , Chen , H.L. , Su , H.J. , Liao , P.C. , Guo , H.R. and Lee , C.C. 2011 . Simultaneous Exposure of Non-diabetics to High Levels of Dioxins and Mercury Increases Their Risk of Insulin Resistance . J. Hazard. Mater. , 185 : 749 – 755 .
- Kuo , T.-H. , Chang , C.-F. , Urba , A. and Kvietkus , K. 2006 . Atmospheric Gaseous Mercury in Northern Taiwan . Sci. Total Environ. , 368 : 10 – 18 .
- Shon , Z.H. , Kim , K.H. , Song , S.K. , Kim , M.Y. and Lee , J.S. 2008 . Environmental Fate of Gaseous Elemental Mercury at an Urban Monitoring Site Based on Long-Term Measurements in Korea (1997–2005) . Atmos. Environ. 2008 , 42 : 142 – 155 .
