Abstract
Tethered-sonde measurements of atmospheric profiles were performed at Urumuqi, capital of the Xinjiang Uyghur Autonomous Region of China, from 29 December 2008 to 14 January 2009. The data were used to examine the boundary layer structure during this severe air pollution period. Diurnal evolution of local wind flow near Urumqi was simulated using the fifth-generation Pennsylvania State University–National Center for Atmospheric Research (NCAR) Mesoscale Model (MM5). Measurements from operational radiosonde data showed that a southeasterly elevated low-level jet often intruded upon Urumqi through the middle Tianshan Mountain pass to the south of the city. The tethered-sonde measurements showed that calm and northwesterly winds prevailed near the surface in Urumqi, whereas the southeasterly winds of relatively higher speed were dominant above ∼400 m. Both temperature inversion and humidity inversion frequently occured during day and nighttime. Temperature inversion intensity could sharply rise as the stronger elevated southeasterly gale (ESEG) happened. Model simulations showed that the winds near the surface around Urumqi remained calm during nighttime and developed toward the mountains during daytime. As cool air flow in the basin confronted the southeasterly winds from the pass in the lower layer, they formed a convergence line around Urumqi city, which was not favor for dilution of air pollutants.
There is little knowledge about the relationship between air pollution and the local gap wind (well known as the southeasterly gale [SEG]) in Urumqi during winter. On the basis of tethered-sonde measurements and model simulations, the authors showed that the SEG, if only occurring above ∼400 m (called the elevated SEG [ESEG] in this study), did alter the urban boundary-layer structure and favor formation of a convergence zone near the surface, which was beneficial for occurrence of severe air pollution episode. Therefore, it needs to further study how the ESEG maintains and impacts on atmospheric environment.
Introduction
Urumqi (86°38′–88°58′E, 42°46′–44°08′N), the largest city in western interior of China, is the capital of Xinjiang Uygur Autonomous Region. Urumqi is geographically noteworthy for being the furthest city in the world from any coastline, where the semi-arid climate prevails. The urban area lies in the Urumqi valley, which is at the northern foot of Tianshan Mountain and in the southern edge of Jungger Basin. The city is surrounded by rather steeply rising mountains and hills ranging from 1397 to 5445 m above the sea level (ASL) on nearly three sides, whereas the average altitude of the urban area is 800 m ASL. In general, the urban terrain comprises a bell-mouthed area where the larger end faces the northern Jungger Basin and the smaller southeastern one connects the middle Tianshan Mountain pass ().
Figure 1. (a) The topography, the domain system for MM5 model, and the location of Urumqi city. (b) Observational sites (Xinjiang Exhibition Centre, denoted as UR2), the Special Meteorological Station of Urumqi (denoted as UR1), the middle Tianshan Mountain pass (denoted as MT Pass) and the detailed topography of domain 3. The black dotted line is a cross-section along which simulated potential temperature and wind vectors are displayed in Figure 5d.
Since the 1990s, Urumqi has developed rapidly and now serves as a regional transport node and commercial center. Like most megacities in developing countries (CitationFast et al., 2007), atmospheric environment of Urumqi has deteriorated with population growth and economic development. Regional air pollution is not only related to anthropogenic emissions but also to local meteorological conditions that are influenced by the surrounding terrain. For example, mountain-valley breezes in Beijing resulted in a mountain-chimney effect that impacted dilution of air pollutants (CitationChen et al., 2009). Furthermore, the “horseshoe” terrain around Beijing city blocks the transportation of pollutants outside of Beijing. Therefore, special terrain is one of important factors impacting air quality of Beijing (CitationLi et al. 2003; CitationXu et al. 2004). It was shown that peak heating effect, cold-air pooling effect, and the heating effect of aerosols in Lanzhou, a severely polluted city in western China that is surrounded by hills at four sides, worked together to cause a strong temperature inversion (CitationHu et al., 1989; CitationHu and Zhang, 1999; CitationWang et al., 1993), leading to frequent air pollution episodes there, especially in winter (CitationZhang, 2001). In Mexico City, it was indicated that the interaction of a low gap wind with regional air flows into the Mexico Basin led to complex convergence patterns that determined the concentration and fate of air pollutants (CitationDoran and Zhong, 2000; CitationFast et al. 2007; CitationFoy et al., 2006). The gap wind is defined as wind that blows through mountain passes or in topographically confined channels and that generally occurs whenever a pressure gradient is directed from one side of the pass or channel to the other (CitationDoran and Zhong, 2000). Gap winds also occur in Kathmandu, Nepal. Two different gap flows meeting at the center of the city form a double-layered structure that suppresses vertical mixing and results in high air pollution (CitationRegmi et al. 2003). Urumqi was evaluated as one of the 10 most heavily air-polluted cities in the world in 1998 (CitationMamtimin and Meixner, 2007). However, little research has been performed to study the urban boundary-layer structure and its relationship to the surrounding complex topography as far as we know, nor have the influences of the distinct gap winds from the mountain pass on severe air pollution been studied. In this study, we will show the gap wind in Urumqi is an important variation of the foehn. Foehn wind is commonly observed on the lee side of large mountain ranges and is typically associated with large increases in temperature and decreases in relative humidity due to adiabatic compression of the descending wind (CitationGattin, 2007). The famous foehn in Alps results in Central Europe enjoying a warmer climate (CitationMcknight et al., 2000). Here, the so-called variation of the foehn could intrudes over the Urumqi above ∼400 m in winter, which differs from the other gap winds in Mexico City and Kathmadu (CitationDoran and Zhong, 2000; CitationFoy et al., 2006; CitationRegmi et al., 2003).
The objective of this study is twofold. First, the features of the urban boundary-layer structure in Urumqi were investigated using high temporal resolution for the first time, as far as we know. Secondly, model simulation is used to reveal the characteristics of low-level circulation accompanied by the elevated southeasterly gales (ESEG) in Urumqi and its potential influence on local air quality. The paper is organized as follows. The background, observations, and model description are presented in following section, which is followed by observation results based on tethered-sonde observations in combination with the conventional radiosonde measurements. Model simulation results are then presented. The final section includes discussion and conclusions.
Background, Observations, and Model Description
Background
The Tianshan Mountain range crosses the entire Xinjiang Uygur Autonomous Region from west to east, with an average altitude of 4000 m. This mountain range plays an important role in controlling current between the areas on either side of it. Notably, the middle Tianshan Mountain pass crosses the mountain with the north narrow exit of 80 km and the southern exit twice wider than the north one, naturally forming an airflow channel (). Urumqi is located at the north exit of mountain pass. The average temperature of Urumqi in July and January are 25 and −15 °C, respectively. The annual precipitation is ∼271.4 mm. The winter climate can be characterized as cold and wet, with average maximum and minimum temperatures of −10 and −20 °C in January, respectively. Weak winds and cooling of the lower layers give rise to fog episodes. In addition, gap winds (southeasterly and northwesterly) are often recorded in this region. The local name of the southeasterly gap wind is the southeasterly gale (SEG). Zhang et al., CitationMeng et al. (1995; Citation1996a; 1996b) and CitationZhang (2007) indicated that the SEG was driven by a pressure gradient and was often characterized by moderate to hurricane wind speeds as well as sharp increase in temperature. The peak wind speed of the SEG happened on 24 November 2004 reached 46 m S−1 in the northwest suburb of Urumqi, whereas the temperature sharply increased by 8.6 °C from 2:00 a.m. to 5:00 a.m. Beijing Standard Time (BST; the local time is 2 hr later than BST) (CitationDou et al., 2005), which exhibited remarkable features of the foehn (CitationPan, 1994). The SEG can occur from the ground to ∼4000 m and survive from several hours to 2–3 days (CitationDou et al., 2005; CitationMeng et al., 1995; Zhang et al., 1989). Therefore, the SEG often causes extensive property damage (CitationDou et al., 2005; CitationZhang, 2007). Most ground-based SEGs are observed in spring and autumn, although they also occur in summer and winter occasionally. It should be noted the SEG rarely penetrates the deep and stable temperature inversion layer over city in winter and thereby occurs above the middle boundary layers in most cases (CitationWang, 2001; Zhang et al., 1989). It is named to be the elevated southeasterly gale (ESEG) in this study. With the occurrence of the grounded-based SEG in winter, the air quality of Urumqi is usually good (CitationLi, 2006;CitationWu et al., 2007). This is because the ground is covered by snow and the ground-based gale favors pollutant dispersion. However, the air quality can also be poor if it appears in the warm half of the year, because the stronger wind can lift up surface dust and soil particles into the boundary layer (CitationLi, 2006;CitationWu et al., 2007). In addition, the air quality in winter could be adverse if the SEG occurs at the upper level of the boundary layer, which has not been previously studied as far as we know.
With the rapid growth of economy during the past 20 years, most factories such as plants producing power, petroleum chemicals, cement, etc., located in the northern and southern suburbs of the city, result in a high concentration of industrial pollutants. In addition, the number of motor vehicles has rapidly increased in recent years to >300,000 in October 2010. As Urumqi is located nearby Guerbantonggute Desert and Jungger Basin, soil dust is a main particulate source in spring (CitationLi et al., 2008). Furthermore, there is a half-year for house heating domestically and industrially from 15 October to 15 April of the next year. Therefore, the air pollution intensity of Urumqi usually is in the order of winter > spring > fall > summer (CitationLi et al., 2008). It was shown clearly that winter is the most polluted season, which is due to the heavy heating with coal combustion in this season (CitationLi et al., 2008). Feng et al (CitationFeng et al., 2005). confirmed that the major sources of fine particulate matter (PM10) were mainly composed of coal combustion (67%), sulfate (14%), and others (19%) in heating season. Note that dust aerosols are mostly observed in spring and summer and they are rarely observed in winter due to snow cover. The above emissions led to an average of 8.7 severe air pollution episodes within the heating season (CitationLi et al., 2009). Here, a severe air pollution episode is defined when the daily air pollution index (API) exceeds 200 (daily particulate matter ≤10 μm [PM10] being 350 μg m−3) for 1 day or several consecutive days. Because severe air pollution over Urumqi in January is mainly caused by PM10, we focused on the PM10 concentration in this study.
Observations
The tethered-sonde experiment was performed in the Xinjiang Exhibition Center (denoted as UR2 in ), the urban center of Urumqi, from 29 December 2008 to 14 January 2009. There were two light snowfall events during this period, with precipitation of 0.5 and 0.1 mm on 31 December 2008 and 3 January 2009, respectively. The anticyclonic system dominated Xinjiang, with the high-pressure center located in Mongolia during most of observation period. Twelve foggy days were recorded during these days.
The main observational instruments included a tethered balloon (лS111; Vaisala Company, Helsinki, Finland). The payload included a radiosonde for the measurement of temperature, humidity, air pressure, and wind profiles. The tethered-balloon sondings were performed eight times per day: 2:00 a.m., 5:00 a.m., 8:00 a.m., 11:00 a.m., 2:00 p.m., 5:00 p.m., 8:00 p.m., 11:00 p.m. BST. Given the frequency of data collection was 1 sec, so the tethered balloon was released at a speed of 1.0–1.5 m sec−1. The observation data were calculated with vertical resolution of 5 m up to 800 m. We also used daily conventional radiosonde data at 8:00 a.m. and 8:00 p.m. BST provided by the Special Meteorological Station of Urumqi (UR1 in ) to further investigate the complete vertical structure of the ESEG. The conventional radiosonde data have a vertical resolution of 50 m from ground to 2500 m.
In addition, daily mean PM10 concentrations were obtained from the Environmental Monitoring Station of Urumqi. Note the daily average PM10 concentration on a certain day represents the mean value from 1:00 p.m. BST the previous day to 12:00 a.m. BST on the recorded day.
Model description
To further study the low-level circulations around Urumqi in mid-winter, the fifth-generation Pennsylvania State University/National Center for Atmospheric Research Mesoscale Model (MM5) version 3.7.4 was utilized and initialized with National Center for Environmental Prediction (NCEP)/NCAR reanalysis data (resolution of 1° × 1°). A 9-day simulation was carried out from 8:00 a.m. BST, 4 January to 8:00 p.m. BST, 13 January 2009. Twenty-five land-use categories and 30-sec terrain elevation data acquired from the U.S. Geological Survey (USGS) were used. The domain system consisted of a triple-nested, two-way, interacting mesh. illustrates the domain system (D1, D2, and D3) and the topography. indicates the model's domain 3 (finest). In the vertical, 30 unevenly spaced full-sigma levels are used. The lowest level is about 7 m above ground and will be referred to as surface level in the remainder of this paper. The top boundary of the model was 100 hPa. The parameterization schemes used in this study are summarized in . The top boundary of the model was 100 hPa. The parameterization schemes used in this study are summarized in .
Table 1. The options description used for MM5 model simulation
Observation Results
Air pollution status
lists the daily mean PM10 concentrations during the observational period, which all exceeds the limit of 150 μg m−3 regulated by the National Ambient Air Quality Standard of China for PM10. They include a total of five severe air pollutions episodes, which occur on 30 December, 3 January, 6–7 January, 9–11 January, and 14 January, respectively. The longest air pollution episode lasts 3 days during 9–11 January. The maximum daily PM10 concentration is 627 μg m−3 on 30 December 2008, which also is the highest value in this winter and surpassed the highest limit of the standard (600 μg m−3).
Table 2. Daily average PM10 concentrations (μg m−3) and statistical results of the ESEG occurrence at 8:00 a.m. and 8:00 p.m. BST in Urumqi from 29 December 2008 to 14 January 2009
Diurnal variation of temperature and humidity profiles
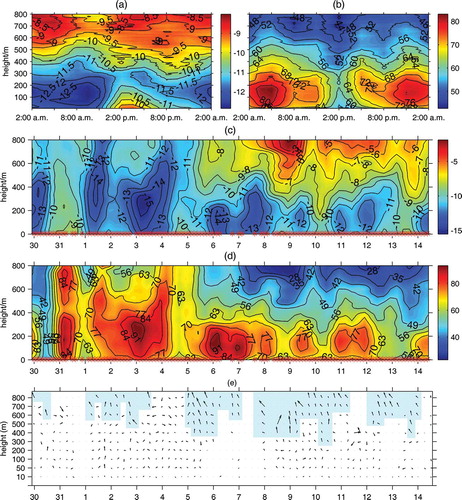
and show the diurnal evolution of the boundary layer structure and statistical results of temperature inversion variables, respectively, during the wintertime severe air pollution period. On average, the prominent characteristic is that the elevated temperature inversion almost retained all day long (). The occurrence frequencies of the inversion are relatively high, with the minimum of 85.7% at 5:00 p.m. BST. In the evening (11:00 p.m. the previous day and 2:00 a.m. BST) and in the late morning (11:00 a.m. BST), they are even up to 100% (). The highest temperature inversion intensity (0.69 °C per 100 m) occurs at 5:00 a.m., whereas the minimum of 0.41 °C per 100 m occurs at 8:00 p.m. BST. It deserves notice especially that the bottoms of the temperature inversion are comparatively low, with the lowest value of ∼70 m at 2:00 a.m. BST and the highest value of 270 m at 2:00 p.m. BST. Given that the mixing layer height is determined using the base of an elevated temperature inversion layer or stable layer (CitationSeibert et al., 2000), it can be inferred that the mixing layer height for Urumqi is also strikingly low.
Table 3. Diurnal variation of inversion variables in Urumqi from 29 December 2008 to 14 January 2009
Figure 2. Average diurnal variation of (a) temperature, (b) relative humidity and daily evolution of (c) temperature, (d) relative humidity, and (e) wind vectors from 29 December 2008 to 14 January 2009 in Urumqi. Note that data on those days without asterisks at x-axis in (c) and (d) are interpolated because of lack of measurements. The area marked with pale blue in (e) denotes the ESEG in boundary layer.
Some interesting features appeared in Urumqi, as compared with observations in Lanzhou (CitationCheng et al., 1991; CitationZhang and chen, 1998) and Beijing (CitationBian et al., 2001). The occurrence frequency of temperature inversion is the highest and the inversion duration is the longest in Urumqi. The inversion intensity and the bottom of the inversion in Urumqi is close to that in Lanzhou (CitationCheng et al., 1991; CitationZhang and Chen, 1998). It should be noted that the comparison is based on half or one month observations. High frequency and long duration of temperature inversion in combination with the lower mixing height together accounted for, to some extent, why heavy pollution episodes often occur during the observation period, given the fact that there is a close relationship between them (CitationLi et al., 2007).
The average diurnal variation of relative humidity is shown in . A large amount of water vapor near surface cannot break through the stable temperature inversion layer and correspondingly forms the relative humidity inversion. The top of the relative humidity inversion is well consistent with the bottom of the temperature inversion. The relative humidity in lower layer almost remains around ∼80% from the early evening to early morning the next day, which play a critical role in formation of 12-day fog during the observational period. It has been demonstrated that the condition of high relative humidity could promote aerosol particle to grow hygroscopicly (CitationHu et al., 2010) and chemical transformation (CitationLee et al., 2008). Therefore, it may be taken for granted that the relative humidity in Urumqi in winter is another key factor that does make important contribution to the terrible air quality.
Diurnal variation of wind profile
In general, the wind speeds below 300 m are very light, with values of ∼1.4 m sec−1 for most of the period from 8:00 p.m. to 11:00 a.m. BST the next day (figure not shown). In the late morning and afternoon, they develop and reach ∼2.1 m sec−1. The wind speeds above 300 m increase ranging from 1.5 to 5.5 m sec−1. The calm near surface is common at frequency close to 58.2%, whereas at upper level (∼800 m), it sharply decreases to 5.6%. The frequencies of wind direction at different levels reveal that the prevailing winds near surface are mainly distributed in three directions (i.e., northwest, north-northwest, and north), with a total frequency of 18.3%. They gradually turn southwesterly in an anticlockwise direction. The southerly wind flows control relatively upper boundary layers from 200 m upward, which were influenced by the local mountainous terrain and by the peripheral flow of strong Mongolian anticyclone. At 800 m, the southeasterly wind plays a primary role, with the frequency up to 63.0%. The southerly wind with relatively higher speed in upper layer is not helpful in transporting pollutants toward the open basin to the north so as to improve local air quality for the reason that large amount of air pollutants were suppressed within the mixing layer or below the inversion layer.
Profiles with occurrence of the ESEG
From daily evolution of temperature, relative humidity, and wind in the boundary layer based on the tethered-sonde measurements (see , d and e, respectively), it can be seen that the temperature begins to increase above ∼300 m after 5 January in comparison with the previous stage, especially at 2:00 a.m. BST on 9 January when the inversion intensity increased to 1.38 °C per 100 m, twice as much as the average at the same moment (). The increase in temperature simultaneously corresponds to remarkable decrease in relative humidity in the same period (). From profiles of wind vectors (), it illustrates that there are obviously stronger southeasterly flows intruding Urumqi above ∼400 m after 5 January and the peak wind speeds are 9–11 m sec−1 around ∼500 m on 8–9 January (see the area in where the ESEG is marked by pale blue). The so-called stronger southeasterly flows are actually the ESEGs.
Because the tethered-sonde measurement of upper layer (>800 m) was not feasible during the stronger ESEG period, the conventional radiosonde data were adopted so as to further investigate the complete ESEG profiles and corresponding features of the boundary layer structure. lists the statistics results of the ESEG. During 17 days of poor air quality, ESEGs are recorded 13 times at 8:00 a.m. and 8:00 p.m. BST, respectively. This high frequency (76.5%) confirmed that the ESEG is a considerable and prevalent phenomenon for Urumqi. From and d, it reflects that the strength of the ESEG around ∼500 m on 5 January is weaker than that on 8 January. In order to illustrate that the ESEG is likely a potential cause for notable changes in temperature and humidity structure in the boundary layer, the 2-day ESEGs on 5 and 8 January were selected. The comparison results are as follows ().
Figure 3. The profiles of (a) temperature, (b) relative humidity, (c) wind speed, and (d) wind direction using the tethered-sonde (TS, at the UR2 site) and the conventional radiosonde (CS, at the UR1 site) data at 8:00 a.m. BST on 5 and 8 January 2009. Surface weather maps at 8:00 a.m. BST on (e) 5 January and (f) 8 January. (The black dot in figures (e) and (f) is the location of Urumqi.)
| 1. | The common feature on these 2 days was that the wind directions almost did not vary, and they remained southeasterly (∼130°) between 400 m and 1800 m on 5 and 8 January (), which was one of the most significant features of the ESEG. The ESEG flows were considerable deep (exceeding 1500 m). It can be seen that the ESEGs revealed by the conventional radiosonde are stronger than that using the tethered-sonde measurement. | ||||
| 2. | Another common feature was the wind-speed profiles exhibited single-peak curves but the maximum at different height of 1500 m (on 5 January) and 800 m (on 8 January), respectively (). The peak speeds were 19 m sec−1 (on 5 January) and 23 m sec−1 (on 8 January), respectively. | ||||
| 3. | The boundary-layer structures were different and ranged between neutral (on 5 January) and stable (on 8 January) below 1200 m. Furthermore, the inversion intensity (over 1.3 °C per 100 m) on 8 January was stronger than that on 5 January () and the depths of the inversion layer were indeed large (>1100 m). | ||||
| 4. | As stated previously, the ESEG is a variation of the foehn. Therefore, the drier and warmer the vertical structures were, the stronger the winds in the lower layer were (). With the sudden change of wind direction from northerly to southeasterly in the lower layer, a series of changes in temperature, wind speed, and humidity followed at about 200 m. | ||||
Compared comprehensively, the strength of the ESEG on 8 January were stronger in contrast to those on 5 January; the height of the maximum speed was 700 m lower than that on 5 January. Therefore, relative larger amount of momentum from winds aloft mixing into the lower layer on 8 January can be inferred in this case, which could make greater contributions to sharp increases in temperature in the boundary layer. Certainly, the most essential reason for the vertical structure difference of the ESEG between 5 and 8 January was the pressure gradients between the Tianshan Mountain range ( and f). It can seen that there is a stream of cold air from the Mongolia anticyclone entering into the region to the south of Xinjiang, which provided more benefit conditions for the cool air flowing into southern Xinjiang, coming into being large pressure gradient.
Simulation Results
Comparison of the simulation winds with observation
Figure 4a and b show a comparison of the simulated (denoted as Mod.) and observed wind speeds and wind directions for ∼500 m layers at UR2 (denoted as TS Obs.) and UR1 (denoted as CS Obs.) on 4–13 January. The simulated wind speeds fluctuate with the rise and vanish of the ESEG and capture the main features of the ESEG with the simulated wind directions waving around ∼130°. Therefore, it can be inferred that the model is successful in predicting the occurrence of the ESEG these days. However, the calculated winds in the lower layer lose a degree of accuracy compared to the observed ones, whose main difference is that the calculated ESEG are so strong as to reach to surface of urban center area. In fact, the northernmost position where the near-surface ESEG were often observed was in the fringe area of the city, close to the north exit of the mountain pass. –j shows the comparisons between the model results and the observation at eight times on 8 January. The simulated diurnal variations of wind speed and wind direction are in agreement with the measurement at UR2. Because the ESEG on 8 January are quite representative for the observational period and followed by 3-day severe air pollution event, in the following discussion we use the results of the simulation on 8 January ().
Figure 4. Comparison of the simulated and observed evolution of (a) the wind speeds and (b) wind directions at level of ∼500 m during 4–13 January 2009. Comparison of (c1–c8) wind speed profiles and (d1–d8) wind direction profiles between the simulated and observed data at eight data-collection times on 8 January 2009 at the UR2 site of Urumqi. The legend in (a) is valid for (b); “TS Obs.” denotes the tethered-sonde observation at UR2; “CS Obs.” denotes the conventional radiosonde observation at UR1; “Mod.” denotes the simulated results at UR2 of Urumqi. The legend in (c) is valid for (d); “Obs.” denotes the tethered-sonde observation at UR2; “Mod.” is similar to the above.
Figure 5. Predicted near-surface winds over the middle Tianshan Mountain pass and Urumqi on 8 January 2009 (a) at 2:00 a.m. BST, (b) at 3:00 p.m. BST near the surface, and (c) at 3:00 p.m. BST at level of ∼500 m. Contours shows terrain height with intervals of 500 m. (d) Cross-sectional plot along the line (see and ) at 3:00 p.m. BST. Solid lines: potential temperature; vectors: wind component along cross-section, vertical wind component is increased by 10 times. The area in gray color in (d) represents terrain.
Surface wind circulation near Urumqi
Figure 5a and b illustrate the calculated near-surface wind in the evening (at 2:00 a.m. BST on 8 January) and at noon (at 1:00 p.m. BST on 8 January), respectively. After sunset (at ∼7:00 p.m. BST), the downslope winds begin and gradually become stronger prevailing on the surrounding mountain slopes, especially near the eastern mountain (with a peak of 5445 m, ). In the mountain pass, the relatively stronger SEG dominates the whole valley, pouring into the north gateway. Within the Jungger Basin, cool air accumulates during the nighttime. Because of the cold air layer, the downslope winds over mountain slopes can not break though it. Therefore, the wind in the basin remains almost calm, including Urumqi city. This surface-wind pattern lasts until ∼12:00 a.m. BST on 8 January. Due to radiative heating of the ground surface, the downslope winds begin to weaken, whereas the wind fields at the basin floor develop toward the mountain, confronting the southeasterly winds to the south of Urumqi city (). After sunset, the downslope winds returns. A convergence zone is visible near the altitude contour line of 1000 m most of the time ( and b).
At ∼500 m layer, the wind patterns in the evening and during daytime are similar to near-surface one. The distinct difference of flow between the two levels is the strength of the southeasterly flow. As illustrated in , the strong ESEG flows out from the mountain pass and continue in the southeastward–northwestward direction, the same as the wind direction in the pass. Thus, this low level jet sweeps through Urumqi at relatively higher levels, which is absolutely different from the flow near the surface ().
The local flows described in the previous section will be further examined in order to confirm its nature and to assess its roles in the formation of severe air pollution. Vertical sections of the simulated winds and potential temperature are shown in (along the black line in and ). The latitudes of urban area of Urumqi is between 43.73°N and 43.96°N. The potential temperature shows that the cold air is accumulated in the southern mountain. As evident from the wind field (, c), this cold air is not complete blocked and flowed through the mountain pass with high speed. The southerly flow on the lee side of mountain towards Urumqi tends to violent downward motion and then upward motion, exhibiting characteristics of hydraulic jump. It can be inferred from the potential temperature contours that the adiabatic warming process originating from downward motion could result in the sharp rise of the temperature in the same layer, which is manifested by the observation on this day (). The sinking flow convergences with the cooler northerly from the basin and lifts up, moving over the northerly in its originally direction (southeast-northwest). It illustrates that the ESEG is a kind of foehn. In terms of the foehn classification (CitationPan, 1994), the windward flow often produces precipitation and releases latent heat of condensation on windward side of the mountain before it transforms to the typical foehn on the lee side of the mountain. For the free atmosphere foehn, it is a result from the anticyclonic sinking, which can drop to the relatively low layer but almost windless near surface. In fact, the Mongolia anticyclone controlled Xinjiang from the surface weather map on 8 January (), corresponding to subsiding movement over a large area. The sharp pressure gradient between the two sides of mountain forces the cold air into the mountain pass or across mountain crest. The downslope flow together with the anticyclonic sinking motion could make contribution to the formation of the foehn like the ESEG.
In addition, it can be seen that the wind structure is very complicated near Urumqi below 600 hPa. The strong southerly wind controls the south area of Urumqi below 600 hPa. However, over north area of Urumqi, weak northerly prevails in low layer (>780 hPa) (seen in ). The northerly winds and the southerly ones form a convergence area near the latitude of ∼43.82°N in the boundary layer, extremely unfavorable for the horizontal dispersion of air pollutants, especially in the nearly north-south Urumqi valley. As shown by the above analysis, the presence of the ESEG could further lead to the boundary stratification more stable and suppress the vertical dilution of air pollution. Therefore, it is these favorable conditions that could cause a series of severe air pollution episodes during this observational period, especially the latter stage.
Discussion
Depending upon the topography of the mountain valley and the surrounding environment, different mechanisms govern the local air flows in the different basins (CitationRegmi et al., 2003). Compared comprehensively, the ESEG flow properties in Urumqi and its influence on local air pollution are different from the gap winds in Mexico City (CitationDoran and Zhong, 2000; CitationFast et al., 2007; CitationFoy et al., 2006) and Kathmandu Valley (CitationRegmi et al., 2003). First, the formation mechanism of the gap winds in Mexico City and Kathmandu valley are thermally driven, so the gap winds there exhibit significant alternation features during sunrise and sunset periods (CitationDoran and Zhong, 2000; CitationRegmi et al., 2003). However, the gap winds of the ESEG in Urumqi retain their southeasterly direction all day because their formation is mainly caused by the pressure gradient between the two sides of the Tianshan Mountain range. It is worth noting that the ESEGs not only belong to the gap wind but also are foehn. Secondly, there are notable discrepancies in the influence mechanisms on local air pollution between these gap winds. The gap winds entering Mexico City lead to very different wind convergence lines over the city depending on the meteorological conditions, which further results in various spatial distributions of high ozone concentrations (CitationFoy et al., 2006). For the Kathmandu valley (CitationFoy et al., 2006), two gap winds synchronously intrude into the valley, southwesterly and northwesterly, respectively. Thus the cooler and shallow southwesterly wind is capped by the relatively warmer northwesterly wind, and the presence of the strong, stable layer over the whole valley in the daytime sets the basic meteorological background for the air pollution transport in the valley (CitationFoy et al., 2006). In Urumqi, both stable stratification and dynamical convergence in boundary layer could be all closely related to the ESEG.
Conclusion
Characteristics of boundary-layer structures over Urumqi in mid-winter were investigated using both tethered-balloon observations and conventional radiosonde data during 29 December 2008 to 14 January 2009. The MM5 model was used to examine the local flow features with the occurrence of the ESEG.
| 1. | Based on the tethered-balloon measurement, the diurnal variation of temperature structure in Urumqi can be characterized as temperature inversion day and night, with the maximum inversion intensity (0.69 °C per 100 m) in early morning and the minimum (0.41 °C per 100 m) in late afternoon. Also, there are always humidity inversions below 200 m within which the average relative humidity can approximate ∼80%, providing enough water vapor for fog formation. The surface is always calm, with frequency of 58.2%, whereas the same value at an altitude of 800 m is only 5.6%. The prevailing wind direction in the lower boundary layer is mostly dominated by northwesterly winds. At upper level, the southeasterly adds up to 63.0% of the frequency, corresponding to the ESEG. Affected jointly by the elements including long time of the elevated temperature inversion, high relative humidity, and light wind in the lower boundary layer, it is inevitable that severe air pollution events frequently occur in middle winter. | ||||
| 2. | The conventional radiosonde measurement from the Special Meteorological Station of Urumqi recorded 13 ESEG occurrences at 8:00 a.m. and 8:00 p.m. BST, respectively. This frequency (76.5%) demonstrates that the ESEG is a prevalent phenomenon in Urumqi during mid-winter. The complete vertical profiles further illustrate that the ESEG is very deep even up to 2000 m. | ||||
| 3. | The MM5 simulation reasonably illustrated the local circulation patterns near Urumqi. At nighttime, the downslope winds prevail on the mountain slope, whereas most of the south Jungger Basin below 1000 m is calm. During the day, the northerly winds from the basin develop. In the lower layer, the ESEG outflowing from the mountain pass is terminated near Urumqi city by the cool air in the Jungger Basin, which results in a convergence line along an altitude of 1000 m most of time. At upper level, the ESEG could sweep through over Urumqi and run towards the basin. Therefore, such boundary layer conditions with occurrence of the ESEG could be unfavorable for dispersion of air pollutants in Urumqi in mid-winter. | ||||
Acknowledgments
This work was supported by the National Department Public Benefit Research Foundation (Grant No. GYHY201006012), the Meteorological Science Fund of the Chinese Desert (Grant No. IDM2008003), the Ministry of Environmental Protection Special Funds for Scientific Research on Public Causes (Grant No. 200909007), the National Natural Science Foundation of China (Grant No. 41075050), Xinjiang Meteorological Science Foundation (Grant No. C2008001) and Xinjiang Natural Science Foundation (Grant No. 2011211A102). The authors would like to thank the eight graduate students who performed the tethered-balloon observations in the chill of winter.
References
- Bian , L. , Chen , Y. , Wang , X. , Gao , Z. , Wang , Y. and Lu , L. 2001 . Observational study of wind and temperature: profiles of urban boundary layer in Beijing winter . Appl. Meteorol. Sci. , 13 ( Suppl ) : 13 – 25 .
- Chen , Y. , Zhao , C. , Zhang , Q. , Deng , Z. , Huang , M. and Ma , X. 2009 . Aircraft study of mountain chimney effect of Beijing, China . J. Geophys. Res. , 114 D08306. doi: 10.1029/2008JD010610
- Cheng , C. , Huang , J. and Long , X. 1991 . Analyses of boundary layer characteristics over Valley city in wintertime . Chin. Sci. Bull. , 18 : 1393 – 1596 .
- Doran , J.C. and Zhong , S. 2000 . Thermally driven gap winds into the Mexico city basin . J. Appl. Meteorol. , 39 : 1330 – 1340 .
- Dou , X. , Bin , J. and Jiang , J. 2005 . The meteorological causes of the collapse of iron tower in Urumqi electronic network . Xinjiang Meteorol. , 28 : 32 – 34 .
- Fast , J. , Foy , B.D. , Acevedo Rosas , F. , Caetano , E. , Carmichael , G. , Emmons , L. , Mckenna , D. , Mena , M. , Skamarock , W. Tie , X. 2007 . A meteorological overview of the MILAGRO field campaigns . Atmos. Chem. Phys. Discuss. , 7 : 2037 – 2089 .
- Feng , Y. , Peng , L. , Wu , J. , Zhu , T. , Lu , A. and Zhang , K. 2005 . Analytic studies on source of TSP and PMl0 in environmental air of Urumqi city . China Environ. Sci. , 25 ( Suppl ) : 30 – 33 .
- Foy , B.D. , Clappier , A. , Molina , L.T. and Molina , M.J. 2006 . Distinct wind convergence patterns in the Mexico city basin Due To the interaction of the gap winds with the synoptic flow . Atmos. Chem. Phys. , 6 : 1249 – 1265 .
- Gaffin , D.M . 2007 . Foehn winds that produced large temperature differences near the southern Appalachian mountains . Weather Forecasting , 22 : 145 – 159 .
- Grell , G.A . 1993 . Progonostic evaluation of assumptions used by cumulus parameterization . Mon. Weather Rev. , 121 : 764 – 787 .
- Hong , S.Y. and Pan , H.L. 1996 . Nonlocal boundary layer vertical diffusion in a medium-range forecast model . Mon. Weather Rev. , 124 : 2322 – 2339 .
- Hu , D. , Qiao , L. , Chen , J. , Ye , X. , Cheng , T. and Fang , W. 2010 . Hygroscopicity of inorganic aerosols: size and relative humidity effects on the growth factor . Aerosol Air Qual. Res. , 3 : 255 – 264 .
- Hu , Y. , Ge , Z. , Liu , J. , Zhang , Y. and Wei , G.A. 1989 . Surface layer experiment in Lanzhou hollow basin in early winter . Sci. Atmos. Sin. , 13 : 452 – 459 .
- Hu , Y. and Zhang , Q. 1999 . Atmosphere pollution mechanism along with prevention and cure of the Lanzhou hollow basin . China Environ. Sci. , 19 : 119 – 122 .
- Lee , A. , Ling , T. and Chan , C. 2008 . Understanding hygroscopic growth and phase transformation of aerosols using single particle Raman spectroscopy in an electrodynamic balance . Faraday Discuss. , 137 : 245 – 263 .
- Li , C. , Mao , J. , Alexis , K. , Liu , X. , Liu , G. and Zhu , A. 2003 . Research on the air pollution in Beijing and its surroundings with MODIS AOD products . Chin. J. Atmos. Sci. , 27 : 869 – 880 .
- Li , J. , Zheng , Y. and Liu , Z. 2007 . Relation between the low altitude temperature stratification and the heating period atmospheric air pollution in Urumqi city . Arid Land Geogr. , 30 : 519 – 525 .
- Li , J. , Zhuang , G. , Huang , K. , Lin , Y. , Xu , C. and Yu , S. 2008 . Characteristics and sources of air-borne particulate in Urumqi, China, the upstream area of Asia dust . Atmos. Environ. , 42 : 776 – 787 .
- Li , X. , Zhang , G. and Xin , Y. Air Pollution Characteristics of Multi-cities in the North of Middle Tianshan Mountain, Xinjiang, China . Proceedings of Bioinformatics and Biomedical Engineering's 3rd International Conference . Beijing June 11–13, New York: IEEE. Paper 10777243-1. doi: 10.1109/ ICBBE.2009.5162296
- Li , X . 2006 . Effects of meteorological factors on optical properties of aerosol in Urumqi . Arid Zone Res. , 23 : 484 – 488 .
- Mamtimin , B. and Meixner , F.X. 2007 . The characteristics of air pollution in the Semi-Arid city of Urumqi (NW China) and its relation to climatological process . Geophys. Res. Abstr , 9 : 06537
- McKnight , T.L. and Hess , Darrel . 2000 . “ Foehn/Chinoonk Winds ” . In Physical Geography: A Landscape Appreciation , Upper Saddle River, NJ : Prentice Hall . p. 132
- Meng , Q. and Diao , P. 1996 . Recognition of impact of Tianshan mountain topography on the southeastly gust in Urumqi . Xinjiang Meteorol. , 19 : 5 – 9 .
- Meng , Q. , Lu , B. and Diao , P. 1995 . Research on the distribution of the southeasterly gust in Urumqi region . Xinjiang Meteorol. , 18 : 6 – 10 .
- Meng , Q. , Lu , B. and Diao , P. 1996 . The relationship between southeasterly gust in Urumqi region and evolution in pressure . Xinjiang Meteorol. , 19 : 5 – 9 .
- Pan , S. 1994 . Modern Climatic Principle , 548 Beijing : Meteorological Press .
- Regmi , R.P. , Kitada , T. and Kurata , G. 2003 . Numerical simulation of late wintertime local flows in Kathmandu valley, Nepal: implication for air pollution transport . J. Appl. Meteorol. , 42 : 389 – 403 .
- Seibert , P. , Beyrich , F. , Gryning , S.E. , Joffre , S. , Rasmussen , A. and Tercier , P. 2000 . Review and intercomparison of operational methods for the determination of the mixing height . Atmos. Environ. , 34 : 1001 – 1027 .
- Wang , C . 2001 . Characteristics of low altitude wind shear of southeastwardly gale and flight safety guarantee at Urumqi airport . Meteorology , 27 : 34 – 37 .
- Wang , H. , Huang , J. and Chen , C. 1993 . The influences of urban aerosols on solar radiation and their reflection in urban boundary layer temperature variation . Acta Meteorol. Sin. , 51 : 457 – 464 .
- Wu , Y. , Wang , X. and Huang , C.R. 2007 . Characteristic of low-level wind and its influence on air pollution in Urumqi city . Desert Oasis Meteorol. , 1 : 39 – 41 .
- Xu , X. , Zhou , L. , Zhou , X.J. , Yan , P. , Weng , Y. , Tao , S. , Mao , J. , Ding , G. , Bian , L. and Chan , J. 2004 . Urban environment around the source of air pollution process and influence area . Sci. China Ser. , 34 : 958 – 966 .
- Zhang , J. , Sun , S. and Zhang , F. 1986 . The Guidance Handbook of Short-term Weather Forecasting in Xinjiang 341 – 347 . Urumqi
- Zhang , L . 2007 . Analysis on synoptic statistical characteristics of the southeasterly gale at the international airport in Urumqi for the last 20 years . J. Civil Aviat. Flight Univ. China , 18 : 3 – 6 .
- Zhang , Q . 2001 . The influence of terrain and inversion layer on pollutant transfer over Lanzhou . China Environ. Sci. , 21 : 230 – 234 .
- Zhang , Y. and Chen , C. 1998 . A study on the characteristics of winter temperature stratification over Lanzhou city . J. Lanzhou Univ. (Nat. Sci.) , 34 : 104 – 110 .