Abstract
Incinerators are claimed to be responsible of particle and gaseous emissions: to this purpose Best Available Techniques (BAT) are used in the flue-gas treatment sections leading to pollutant emission lower than established threshold limit values. As regard particle emission, only a mass-based threshold limit is required by the regulatory authorities. However, in the last years the attention of medical experts moved from coarse and fine particles towards ultrafine particles (UFPs; diameter less than 0.1 μm), mainly emitted by combustion processes. According to toxicological and epidemiological studies, ultrafine particles could represent a risk for health and environment. Therefore, it is necessary to quantify particle emissions from incinerators also to perform an exposure assessment for the human populations living in their surrounding areas.
A further topic to be stressed in the UFP emission from incinerators is the particle filtration efficiency as function of different flue-gas treatment sections. In fact, it could be somehow important to know which particle filtration method is able to assure high abatement efficiency also in terms of UFPs. To this purpose, in the present work experimental results in terms of ultrafine particle emissions from several incineration plants are reported. Experimental campaigns were carried out in the period 2007–2010 by measuring UFP number distributions and total concentrations at the stack of five plants through condensation particle counters and mobility particle sizer spectrometers. Average total particle number concentrations ranging from 0.4 × 10³ to 6.0 × 10³ particles cm−3 were measured at the stack of the analyzed plants. Further experimental campaigns were performed to characterize particle levels before the fabric filters in two of the analyzed plants in order to deepen their particle reduction effect; particle concentrations higher than 1 × 10⁷ particles cm−3 were measured, leading to filtration efficiency greater than 99.99%.
The main implication of the study is that the use of a fabric filter in the flue-gas treatment section of incinerators is able to guarantee very low concentrations at the stack in terms of UFPs. As regards the incineration plants, a further implication of the proposed study is that an a priori negative social response seems to be unjustified when referred to the ultrafine particle emissions.
Introduction
Particulate emission from anthropogenic sources is nowadays a relevant topic under examination of air quality and medical experts. A number of epidemiological studies were carried out to evaluate the correlation between the particulate matter (PM) and its negative health effects such as cardiovascular and breathing problems (CitationKreyling et al., 2006; CitationPope and Dockery, 2006). Moreover, toxicologists attempted to evaluate the particle properties mainly responsible of such negative effects in terms of both size and chemical composition. About the chemical composition, no definitive results were carried out to assess if particle toxicity is mainly due to the organic compounds surrounding the particles (CitationEiguren-Fernandez et al., 2010) or the soot core itself (CitationSoto et al., 2008). As regard particle size, even if not unanimous results were reached, the interest of such experts is moving from mass-based concentrations (CitationLoomis, 2000; CitationPope, 2000) (particulate matter with aerodynamic diameters lower than 10 PM10 and 2.5 μm, PM2.5), towards submicrometer and ultrafine particles (UFPs; i.e. particles sized about 100 nm in diameter or less as defined by the CitationInternational Organization for Standardization through the ISO/TR 27628:2007), which mainly contribute to surface area and number concentrations (CitationHauser et al., 2001; CitationGiechaskiel et al., 2009). Anyway, the air quality regulation is still referred to threshold limit values based on gravimetric time-integrated measurement of PM10, and only proposed guideline values for PM2.5 (CitationU.S. Environmental Protection Agency (EPA), 1997; CitationEuropean Committee for Standardization, 2001; CitationEuropean Committee for Standardization, 2005; CitationEuropean Parliament and Council, 2008). To reach such air quality standards, threshold values were also introduced to regulate the emissions of anthropogenic sources as industrial plants and vehicular traffic (CitationEuropean Commission, 2008; CitationEuropean Parliament and Council, 2010). These anthropogenic activities are also recognized as the greatest emitters of UFPs (CitationCass et al., 2000; CitationMorawska et al., 2008); at the moment, threshold limit values in terms of particle number concentrations are introduced for European diesel-fueled vehicles (CitationEuropean Commission, 2008) and proposed for gasoline-fueled vehicles, whereas no regulating values are provided for industrial plants. Therefore, it is somehow important to characterize the emission sources as well as the evolution of particle size distribution in their proximity in order to carry out aerosol source apportionments and exposure assessment analyses in the areas characterized by high anthropogenic pressure (CitationBuonanno et al., 2009b; CitationBuonanno et al., 2010b).
In the waste management, incineration represents a favorable technique for reducing the waste volume and recovering its energy content to generate electricity and district heating. However, incinerators were subjected to a strong debate in Western countries about their emission of UFPs. Actually, as well as other industrial plants, only a mass-based threshold limit value is currently required in the operation of such plants as stated by the Directive 2010/75/EU (CitationEuropean Parliament and Council, 2010); in particular, total dust values (total amount of particle emitted in terms of mass) at the stack of the plant have to be lower than 10 and 30 mg m−3 on daily and half-hour basis, respectively. However, according to the scientific literature in terms of anthropogenic emissions (CitationAirborne Particles Expert Group, 1999; CitationCass et al., 2000; CitationEPA, 2000), incinerators are supposed to emit a very low amount of particles if compared to fossil fuel power plants and vehicle emissions since the Best Available Techniques (BAT) (CitationEuropean Commission, 2006) are used in the flue gas cleaning operations of modern plants. Actually, a few number of experimental campaigns focused on the evaluation of UFP emission from incinerators were carried out (CitationGomez-Moreno et al., 2003; CitationMaghun et al., 2003; CitationBuonanno et al., 2009a; CitationBuonanno et al., 2010a; CitationBuonanno et al., 2010b). Moreover, such analyses were often limited to a dimensional characterization of the aerosol emitted and/or to samplings at a downwind receptor site without evaluation of the performance of the flue-gas treatment sections. In our previous work (CitationBuonanno et al., 2009a), measurements of fine and ultrafine particles at the stack of an incinerator were performed. However, in that case study, measurement methods not involving particle counting through condensation techniques and classification by means of particle electrical mobility methods were used.
In the present paper, an analysis of UFP emission levels from five plants is shown. In particular, four incineration plants burning wastes and a plant burning biomass were analyzed. Measurements of total particle number and size distribution of aerosol particles were performed through a mobile system consisting of particle counters, mobility particle sizer spectrometers, thermodilution systems, as well as home-designed sampling systems. The main aim of the paper is to deepen the knowledge about fabric filter influence on ultrafine particle emission levels; therefore, aerosol particle measurements were also extended at a section located before the fabric filter for two of the incinerators under examination.
Experimental Analysis
Plant descriptions
Experimental campaigns involving aerosol particle characterization were performed in five plants showing different flue-gas treatment sections, four of which burning municipal waste or refuse-derived fuels (RDF) (Plants 1 to 4 in ) and another one fed with biomass (Plant 5 in ). The main purpose of these plants is the waste (or biomass) energy content recovery in a Rankine cycle power generation system. The five plants are made up of the following main sections: (i) the waste/biomass delivery area, where the delivery trucks arrive and dump the waste/biomass in a storage area (typically a bunker); (ii) the combustion and heat recovery section, consisting of a combustion chamber and an additional burner system to maintain the exhausts, for at least 2 sec, at the required minimum temperature (850 °C) (CitationEuropean Parliament and Council, 2010); (iii) the power generation section, constituted by a condensing turbine unit directly coupled to the generator; and (iv) the flue-gas treatment section. The exhaust treatment sections are different between the analyzed plants in terms of gas acid (dry, semidry, wet process), NOx (selective noncatalytic reduction [SNCR], or selective catalytic reduction [SCR]), and dust removal (fabric filter, electrostatic precipitator, cyclones). In a summary of the main characteristics of the combustion and flue-gas treatment sections of each plant is reported. clearly shows that a fabric filter (with Polytetrafluoroethylene (PTFE) membrane) is present in each incineration plant analyzed, whereas it is not used in the biomass-fed Plant 5.
Table 1. Main characteristics of the combustion and flue-gas treatment sections of the analyzed plants
The main technical data of the plants are summarized in , where nominal performances in terms of annual reagent consumption are also reported.
Table 2. Main technical data of the analyzed plants
Experimental apparatus
In order to measure total particle number concentrations and size distributions the following instruments were used:
| • | A condensation particle counter CPC 3775 (TSI Inc., Shoreview, MN) able to measure total particle number concentration down to 4 nm in diameter. | ||||
| • | A scanning mobility particle sizer spectrometer SMPS 3936 (TSI Inc., Shoreview, MN) made up of an electrostatic classifier EC 3080 (TSI Inc., Shoreview, MN), used to classify the sampled particles in different channel according to their size, and a CPC 3775 (TSI Inc. Shoreview, MN). The SMPS 3936 is able to measure particle number distribution in the range 6–800 nm and it can be also used to estimate surface area and mass distribution when a priori morphological and chemical analyses (useful to obtain information about the shape factor and the density of the particles) are carried out. | ||||
| • | A condensation particle counter CPC 5403 (Grimm, Ainring, Germany) able to measure total particle number concentration down to 4.5 nm in diameter. | ||||
| • | An electrostatic classifier “Vienna”-type DMA 55706 (Grimm) able to classify particles in the range 5.5–350 nm. It was also used in a scanning mobility particle sizer configuration when coupled with the CPC 5403. | ||||
| • | A thermodilution system (two-step dilution) made up of a rotating disk thermodiluter (model 379020; Matter Engineering AG, Wohlen, Switzerland) (CitationHüglin et al., 1997) and a thermal conditioner (model 379030; Matter Engineering AG, Wohlen, Switzerland) (CitationBurtscher, 2005) allowing to ensure a proper sample conditioning during the measurement of number distributions and total concentrations of particles emitted by the waste incinerators. | ||||
| • | A thermodilution apparatus constituted by a continuous automatic dioxin monitoring system (DMS; Monitoring Systems, Bad Voslau, Austria). It works according to the dilution method described in the BS EN 1948-1:2006 (European Committe for Standardization, 2006) and it is able to dilute sampled flue gas up to 1:10. Unlike the dioxin sampling, in our experimental analysis the dilution air was heated in order to perform a proper sample conditioning. | ||||
| • | A thermodilution apparatus made up of the diluter VKL-10E (Particle Technology Palas, Karlsruhe, Germany) cautiously heated up to actual flue-gas temperature in order to perform a proper sample conditioning. Dilution factors of 1:10 can be reached. | ||||
Methodology description
The experimental campaigns were carried out during the period 2007–2010. Measurements of total particle number concentrations and particle size distributions were performed at the stack of each selected plant. Moreover, in order to deepen the fabric filter contribution to the particle abatement, measurements were carried out also at a section before the fabric filter for Plants 1 and 2. Sampling length of 120 sec was chosen for particle size distribution measurement, whereas total concentration data with a 1-sec time resolution were carried out. In details of the experimental analyses carried out at the plants are summarized; in particular, measurement periods, measurement points, and experimental apparatus are reported.
Table 3. Details of the experimental analyses of the considered plants
Aerosol emitted from combustion sources (such as the incinerators) are typically hot, highly concentrated, and made up of volatile gaseous compounds that tend to condense, leading to either the formation of stable nuclei (nucleation) or the growth of existing particles (condensation). Therefore, it is necessary to properly dilute and thermally condition the aerosol; if not, particle size distributions and total concentrations could quickly undergo significant changes in the few seconds lasting between the aerosol sampling and its measurement (CitationHüglin et al., 1997; CitationBurtscher, 2005; CitationHolmes, 2007). Aerosol thermoconditioning is of great concern in UFP characterization from incinerators where precursor gases are typically produced. In fact, CitationBuonanno et al. (2009a) observed a noteworthy correlation among particle number concentration and both NH3 and SO2 concentrations measured at the stack of an incinerator. In dilution factor and thermodilution temperature are also reported for every analyzed plant. In each plant the sampling was performed through a probe that is connected to the thermodilution unit where the aerosol was kept at controlled temperature and humidity. After the thermodilution process, the aerosol was flown to particle counters or particle classifiers depending on whether particle number concentrations or size distributions were measured. In order to reduce artifacts during the measurements, an ad hoc sampling system was also designed to control condensation and nucleation processes in the tract connecting the probe (sampling point) to the thermodilution unit. Since the path experienced by the aerosol before entering in the measurement devices is quite long, a diffusion loss correction was applied to estimate the particle losses onto the inner surface of the connecting tubes. These corrections were evaluated according to the method proposed in CitationGormley and Kennedy (1949); further details about diffusion loss correction evaluation are reported in CitationBuonanno et al. (2011).
Experimental campaigns of the six plants were carried out in sufficiently stable operating conditions. In operative mean conditions and corresponding standard deviations of the main parameters are reported showing nearly steady-state operative conditions for the analyzed plants.
Table 4. Operative mean condition and corresponding standard deviation for the main parameters of the analyzed plants
Results and Discussion
In this section results in terms of particle size distribution and total concentration measured at the plants analyzed through electrostatic classifiers and condensation particle counters are discussed.
Particle size distributions and total concentration values
In statistics of total particle concentrations measured at the stack of the analyzed plants through particle counters are reported. Average concentrations ranging from 0.4 to 6.0 × 10³ particles cm−3 were measured in each plant and also maximum values are very low when compared to other anthropogenic sources (CitationCass et al., 2000; CitationMorawska et al., 2008). Moreover, the significant difference between maximum and 3rd quartile values highlights that higher concentrations occasionally occurred.
Figure 1. Statistics of total particle concentrations measured through particle counters at the stack of the analyzed incineration plants: minimum, maximum, median, 1st quartile, 3rd quartile values.
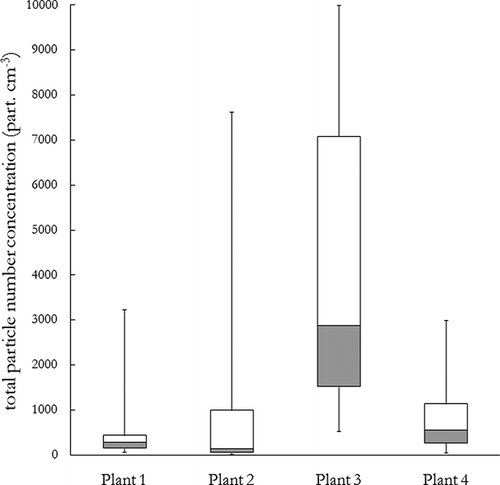
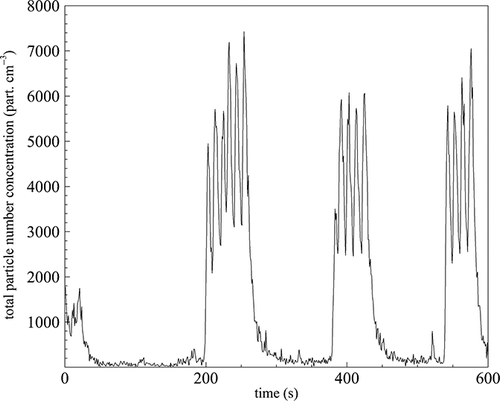
As the measurements were carried out in nearly steady-state conditions, the wide deviations of the data with respect to the average and median concentrations can be only due to the presence of the fabric filters which are cleaned through pulse-jet (compressed air cleaning operation). In particular, the compressed air is injected as the cakes on the bag lead to high-pressure drops (pressure sensors are provided both at the outlet and at the inlet section of the filter). As for example, in , a typical 10-min sample of total particle number concentration measured at the stack of Plant 2 is reported, it clearly shows an unsteady emission of the plant as every peak in concentration is due to a compressed-air pulse. Obviously, such dynamic behavior of emitted aerosol particles cannot be observed by the mass-integrated measurements required by law, since they are based on the gravimetric time-integrated measurement technique (CitationEuropean Committee for Standardization, 2001; CitationEuropean Committee for Standardization, 2005).
Figure 2. Example of a 10-min total particle number concentration measurement through CPC 3775 at the stack of Plant 2.
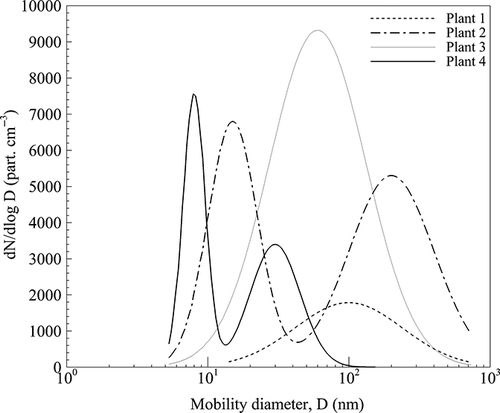
In particle number distributions (fitted by using log-normal distribution functions) measured through particle mobility spectrometers at the stack of the analyzed incineration plants are reported. The data represent the particle number distributions corresponding to the highest emission periods of the plants. Plants 1 and 3 show a unimodal distribution with peak values in the range 60–100 nm, as also found by CitationBuonanno et al. (2009a). Plants 2 and 4 show bimodal distributions, with one of the peaks in the nucleation range (about 10 nm). In particular, Plant 4 shows a second minor peak again in the nanoparticle range (about 30 nm) and no particles larger than 100 nm were measured. This behavior could be due to the presence of the double filtration approach by using two fabric filters.
Figure 3. Particle number distributions measured through mobility particle sizers in the analyzed incineration plants. The data represent the particle number distributions corresponding to the highest emission periods of the plants.
Fabric filter efficiency
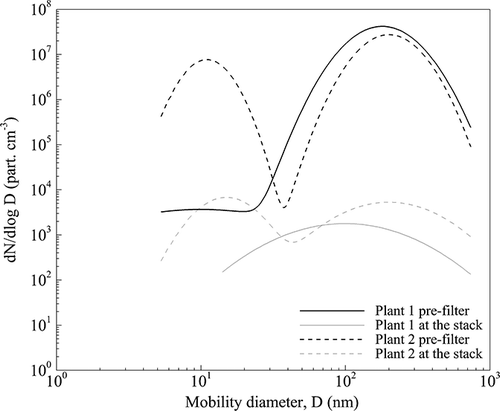
The importance of the fabric filter in the abatement of submicrometer particles was evaluated through the measurement of particle number distributions and total concentrations at a section before the fabric filter in two of the analyzed plants: Plants 1 and 2. In both of them the fabric filter represents the last device of the flue-gas treatment section (none of them uses SCR techniques to reduce NOx or wet processes to abate acid gases). This is an essential circumstance to properly compare measurement data performed at the stack and before the fabric filter. Average total particle number concentrations before the fabric filter were measured to be equal to 2.4 × 10⁷ ± 0.2 × 10⁷ and 1.4 × 10⁷ ± 0.1 × 10⁷ particles cm−3 at Plants 1 and 2, respectively. Standard deviations well below 10% give evidence of the steady-state conditions during the measurement periods; it is also a further confirmation that the large deviation of the data at the stack can be only due to the fabric filter cleaning operations. In the comparison amongst particle number distributions measured at the stack and before the fabric filter of the Plants 1 and 2 is reported. Logarithmic scale for dN/dlogD axes needs to be used, as the total particle concentrations before and after filtration differ by 5 orders of magnitude: it gives evidence of the important contribution in the submicrometer particle reduction of the fabric filter. In this figure, particle size distributions corresponding to the section before the fabric filter represent the average distribution of the sampling time, as the particle concentrations are quite steady, otherwise, particle size distributions related to the stack represent the maximum measured distributions as also referred in Particle number distributions measured in both of the plants before the fabric filter show a main mode around 180–200 nm; Plant 2 also show a minor second mode at 10 nm, which was also detected at the stack. Even considering the maximum measured distributions at the stack, the filtration efficiencies of both the fabric filters, over the entire measurement range of the SMPS 3936 (nearly up to 1 µm), is higher than 99.99%. Therefore, the shift of the modes toward lower diameters (clearly distinguishable in ) does not involve a reduction of the global efficiency of the fabric filter. As for example, the abatement efficiency of the fabric filter for Plant 2 in the range 5–40 nm (the first mode), which is expected to be the lowest one, was estimated to be equal to 99.88%.
Figure 4. Particle number distributions measured through SMPS 3936 at the stack and before the fabric filter (labeled “pre-filter”) of Plants 1 and 2.
The importance of the fabric filter can be also recognized from the measurement carried out at the stack of Plant 5. It is fed by biomass, hence it is not a waste incinerator, but it shows a worthy flue-gas treatment section, as it is made up of Best Available Techniques (BAT) to handle the exhausts; in particular, as regard the particulate reduction, it presents an electrostatic precipitator (ESP). The average particle number distribution measured during the experimental campaign at Plant 5 is a log-normal distribution function with a mode of 90 nm, typical of wood combustion (CitationBuonanno et al., 2010), and a standard deviation of 1.55. The corresponding average total particle number concentration was measured to be equal to 2.8 × 10⁵ particles cm−3. Even if a comparison with other plants (burning municipal waste or RDF) cannot be properly performed, the measurement results of Plant 5 roughly show that the ESP itself is not able to assure particle levels low as the ones measured in plants where a fabric filter is used.
Conclusions
An experimental analysis focused on ultrafine particle emission from incinerator plants was carried out. To this purpose, particle number distribution and total concentration measurements were performed at the stack and before the fabric filter of several incinerator plants through condensation particle counters and mobility particle sizer spectrometers.
The core finding of the work is the modest amount of UFPs emitted by the analyzed incinerators, since particle number concentrations at the stack are always lower than 1.0×10⁴ particles cm−3, in particular, average particle number concentrations at the stack range from 0.4 to 6.0×10³ particles cm−3.
On the contrary, average particle number concentrations before the fabric filter were measured to be equal to 1.4 and 2.4×10⁷ particles cm−3 at Plants 1 and 2, respectively, leading to average removal efficiency of the fabric filters higher than 99.99%. In addition, measurements of the particle number distributions before and after the fabric filters show that the removal efficiency is quite constant all over the measurement range. Therefore, even if fabric filters are usually present in incinerators to meet regulatory requirements in terms of total dust at the stack (which is a mass-based threshold limit value), they assure a great filtration also in terms of UFPs.
In conclusion, the authors point out that future works will be focused on chemical and morphological analyses of emitted aerosol particles in order to perform a whole characterization of UFPs emitted by incinerators.
References
- Airborne Particles Expert Group . 1999 . Source apportionment of airborne particulate matter in the United Kingdom , Northern Ireland : Report for the Department of the Environment, Transport and the Regions, the Welsh Office, the Scottish Office and the Department of the Environment . ISBN 0-7058-1771-7
- Buonanno , G. , Anastasi , P. , Di Iorio , F. and Viola , A. 2010a . Ultrafine particle apportionment and exposure assessment in respect of linear and point sources . Atmos. Pollut. Res , 1 : 36 – 43 .
- Buonanno , G. , Ficco , G. and Stabile , L. 2009a . Size distribution and number concentration of particles at the stack of a municipal waste incinerator . Waste Manage , 29 : 749 – 755 .
- Buonanno , G. , Lall , A.A. and Stabile , L. 2009b . Temporal size distribution and concentration of particles near a major highway . Atmos. Environ , 43 : 1100 – 1105 .
- Buonanno , G. , Morawska , L. , Stabile , L. and Viola , A. 2010 . Exposure to particle number, surface area and PM concentrations in pizzerias . Atmos. Environ , 44 : 3963 – 3969 .
- Buonanno , G. , Stabile , L. , Avino , P. and Belluso , E. 2011 . Chemical, dimensional and morphological ultrafine particle characterization from a waste-to-energy plant . Waste Manage , 31 : 2253 – 2262 .
- Buonanno , G. , Stabile , L. , Avino , P. and Vanoli , R. 2010b . Dimensional and chemical characterization of particles at a downwind receptor site of a waste-to-energy plant . Waste Manage , 30 : 1325 – 1333 .
- Burtscher , H . 2005 . Physical characterization of particulate emissions from diesel engines: a review . J. Aerosol Sci , 36 : 896 – 932 .
- Cass , G.R. , Hughes , L.A. , Bhave , P. , Kleeman , M.J. , Allen , J.O. and Salmon , L.G. 2000 . The chemical composition of atmospheric ultrafine particles. Philos . Trans. R. Soc. Lond. A , 358 : 2581 – 2592 .
- Eiguren-Fernandez , A. , Shinyashiki , M. , Schmitz , D.A. , Di Stefano , E. , Hinds , W. , Kumagai , Y. , Cho , A.K. and Froines , J.R. 2010 . Redox and electrophilic properties of vapor- and particle-phase components of ambient aerosols . Environ. Res , 10 : 207 – 212 .
- European Commission . 2006 . Reference Document on the Best Available Techniques for Waste Incineration , BAT Reference Document (BREF), Final Draft. Joint Research Center, Institute for Prospective Technological Studies .
- European Committee for Standardization . 2001 . EN 12341, 2001. Determination of the PM10 fraction of suspended particulate matter. Reference method and field test procedure to demonstrate reference equivalence of measurement methods. ICS 13.040.20, Ambient atmospheres
- European Committee for Standardization . 2005 . “ EN 14907, 2005 ” . In Ambient air quality—standard gravimetric measurement method for the determination of the PM2.5 mass fraction of suspended particulate matter. ICS 13.040.20, Ambient atmospheres
- European Parliament and Council . 2008 . EU Directive 2008/50/EC of the European Parliament and of the Council of 21 May 2008 on ambient air quality and cleaner air for Europe, 2008. Official Journal of the Europen Union
- European Commission . 2008 . Commission Regulation (EC) No 692/2008 of 18 July 2008 implementing and amending Regulation (EC) No 715/2007 of the European Parliament and of the Council on type-approval of motor vehicles with respect to emissions from light passenger and commercial vehicles (Euro 5 and Euro 6) and on access to vehicle repair and maintenance information
- European Parliament and Council . 2010 . Directive 2010/75/EU of the European Parliament and of the Council of 24 November 2010 on industrial emissions (integrated pollution prevention and control) , Official Journal of the Euro. Union .
- European Committee for Standardization . 2006 . BS EN 1948-1:2006. Stationary source emissions. Determination of the mass concentration of PCDDs/PCDFs and dioxin-like PCBs. Sampling of PCDDs/PCDFs. 13.040.40, Stationary source emissions
- Giechaskiel , B. , Alföldy , B. and Drossinos , Y. 2009 . A metric for health effects studies of diesel exhaust particles . J. Aerosol Sci , 40 : 639 – 651 .
- Gomez-Moreno , F.J. , Sanz-Rivera , D. , Martin-Espigares , M. , Papameletiou , D. , De Santi , G. and Kasper , G. 2003 . Characterization of particulate emissions during pyrolysis and incineration of refuse derived fuel . J. Aerosol Sci , 34 : 1267 – 1275 .
- Gormley , P.G. and Kennedy , M. 1949 . Diffusion from a stream flowing through a cylindrical tube . Proc. R. Irish Acad , 52A : 163 – 169 .
- Hauser , R. , Godleski , J.J. , Hatch , V. and Christiani , D.C. 2001 . Ultrafine particles in human lung macrophages . Arch. Environ. Health , 56 : 150 – 156 .
- Holmes , N.S . 2007 . A review of particle formation events and growth in the atmosphere in the various environments and discussion of mechanistic implications . Atmos. Environ , 41 : 2183 – 2201 .
- Hüglin , C. , Scherrer , L. and Burtscher , H. 1997 . An accurate, continuously adjustable dilution system (1:10 to 1:104) for submicron aerosols . J. Aerosol Sci , 28 : 1049 – 1055 .
- International Organization for Standardization . 2007 . “ ISO/TR 27628:2007 ” . In Workplace atmospheres; Ultrafine, nanoparticle and nano-structured aerosols; Inhalation exposure characterization and assessment, ICS 13.040.30, Workplace atmospheres
- Kreyling , W.G. , Semmler-Behnke , M. and Moller , W. 2006 . Health implications of nanoparticles . J. Nanopart. Res , 8 : 543 – 562 .
- Loomis , D . 2000 . Sizing up air pollution research . Epidemiology , 11 : 2 – 4 .
- Maghun , J. , Karg , E. , Kettrup , A. and Zimmermann , R. 2003 . On-line analysis of the size distribution of fine and ultrafine aerosol particles in flue and stack gas of a municipal waste incineration plant: effect of dynamic process control measures and emission reduction devices . Environ. Sci. Technol , 37 : 4761 – 4770 .
- Morawska , L. , Thomas , S. , Keogh , D.U. and Mengersen , K. 2008 . Modality in ambient particle size distributions and its potential as a basis for developing air quality regulation . Atmos. Environ , 42 : 1617 – 1628 .
- Pope , C.A . 2000 . What do epidemiologic findings tell us about health effects of environmental aerosols? J . Aerosol Med , 13 : 335 – 354 .
- Pope , C.A. and Dockery , D.W. 2006 . Health effects of fine particulate air pollution: lines that connect . J. Air Waste Manage. Assoc , 56 : 709 – 742 .
- Soto , K.F. , Garza , K.M. , Shi , Y. and Murr , L.E. 2008 . Direct contact cytotoxicity assays for filter-collected, carbonaceous (soot)nanoparticulate material and observations of lung cell response . Atmos. Environ , 42 : 1970 – 1982 .
- U.S. Environmental Protection Agency (EPA) . 1997 . “ Protection of Environment ” . In Code of Federal Regulations Part 50–51, Title 40, 1997
- U.S. Environmental Protection Agency . 2000 . Airborne EPA 2000 National Air Pollution Emission Trends 1900–1998, 1998 Emissions , Research Triangle Park , NC : EPA-454/R-00-002. Office of Air Quality Planning and Standards .