Abstract
The tapered element oscillating microbalance (TEOM) is one type of continuous ambient particulate matter (PM) monitor. Adsorption and desorption of moisture and semivolatile species may cause positive or negative artifacts in TEOM PM mass measurement. The objective of this field study was to investigate possible uncertainties associated with TEOM measurements in the poultry operation environment. For comparisons of TEOM with filter-based gravimetric method, four instruments (TEOM-PM10, low-volume PM10 sampler, TEOM-PM2.5, and PM2.5 speciation sampler) were collocated and tested inside a poultry house for PM2.5 and PM10 (PM with aerodynamic equivalent diameter ≤2.5 and ≤10 μm, respectively) measurements. Fifteen sets of 24-hr PM10 concentrations and 13 sets of 24-hr PM2.5 measurements were obtained. Results indicate that compared with filter-based gravimetric method, TEOM gave significantly lower values of both PM10 and PM2.5 mass concentrations. For PM10, the average ratio of TEOM to the gravimetric method was 0.936. For PM2.5, the average ratio of TEOM to the gravimetric method was 0.738. Particulate matter in the poultry houses possibly contains semivolatile compounds and moisture due to high levels of relative humidity (RH) and gas pollutants. The internal heating mechanism of the TEOM may cause losses in mass through volatilization. To investigate the effects of TEOM settings on concentration measurements, the heaters of two identical TEOMs were set at 50 °C, 30 °C, or no heating at all. They were collocated and tested for total suspended particle (TSP), PM10, and PM2.5 measurements in layer house for 6 weeks. For all TSP, PM10, and PM2.5 measurements, the internal TEOM temperature setting had a significant effect (P < 0.05). Significantly higher PM mass concentrations were measured at lower temperature settings. The effects of environmental (i.e., temperature, RH, NH3 and CO2 concentrations) and instrumental (i.e., filter loading and noise) parameters on PM measurements were also assessed using regression analysis.
Because of its potential health and environmental effects, particulate matter (PM) emissions from animal feeding operations (AFOs) have been a great concern to the public and to the regulatory agencies. The tapered element oscillating microbalance (TEOM) PM monitor has been was adapted for continuous PM measurements in some AFO air quality studies. This study investigated possible uncertainties associated with TEOM measurements in an egg production environment. It was discovered that there was a significant bias in TEOM measurements of PM10 as compared with federal reference method. Internal temperature settings of a TEOM have significant impact on its PM measurement.
Introduction
As a US Environmental Protection Agency (EPA) federal equivalent method (FEM) for particulate matter with aerodynamic equivalent diameter ≤10 μm (PM10) measurements (CitationUS Environmental Protection Agency, 1997), the tapered element oscillating microbalance (TEOM) is a continuous ambient PM monitor. The TEOM has been widely used in a variety of air quality studies and monitoring in recent years (CitationGilbert and Clark, 2001; CitationGreen and Fuller, 2006; CitationGrover et al., 2005; CitationRogers et al., 1998; CitationSchwab et al., 2004). The TEOM measures PM mass concentration continuously with a microbalance. The filter and the sampled air passing through filter are conditioned to a constant temperature (50 or 30 °C) to minimize interference of water condensation and temperature variations with mass measurement. The default value for this constant temperature setting is 50 °C, which was determined empirically by the manufacturer (CitationPatashnick and Rupprecht, 1991).
In 1997, CitationAllen et al. (1997) reported wide variations in the relationships between the traditional filter-based method and the TEOM. The extent of variations depended upon monitoring location, sampling time, and PM concentrations. Ammonium nitrate (NH4NO3) and semivolatile organics (SVOCs) were suspected to be the cause for the observed discrepancies. Immediately following this study, a series of articles, responses, and rebuttals were published to discuss and debate the pros and cons of the TEOM method for various applications (CitationAllen, 1998; CitationPatashnick, 1998a, Citation1998b). Since then, more studies reported that the TEOM gave lower PM mass concentration measurements as compared with filter-based PM samplers (CitationAyers et al., 1999; CitationCharrona et al., 2003; CitationJaques et al., 2004; CitationLee et al., 2005; CitationPrice et al., 2003; CitationRizzo et al., 2003; CitationVega et al., 2003). Two plausible reasons discussed extensively from these studies are (1) losses of particulate materials (semivolatile PM and particle-bound water) in the TEOM due to its internal heating mechanism; and (2) negative and positive artifacts associated with changes in air mass composition (CitationAllen et al., 1997) or thermal instability of the TEOM system (CitationPage et al., 2007; CitationPatashnick, 1998a).
To make TEOM measurements comparable with the regulatory PM federal reference method (FRM) samplers, several approaches, such as correction factors (CitationGreen, 2001; CitationGreen and Fuller, 2006; CitationGreen et al., 2001; CitationKing et al., 2000; CitationMuir, 2000; CitationPatashnick and Rupprecht, 1991; CitationRupprecht & Patashnick. Co., 2001), (NH4)2SO4 loss correction (CitationCharron et al., 2004; CitationPrice et al., 2003) instrument settings change (CitationRupprecht & Patashnick. Co., 2001), and use of the differential TEOM monitor (CitationJaques et al., 2004; CitationPatashnick et al., 2001), have been studied. Based upon field evaluations at several US and overseas sites (CitationPatashnick and Rupprecht, 1991), the manufacturer recommended the following correlation between TEOM monitors and the reference samplers:
where Y is the PM10 concentration measured by an FRM PM10 sampler and X is the PM10 concentration measured by a TEOM-PM10 monitor with default internal settings (μg/m3).
To use TEOM PM10 data for regulatory compliance with the European Air Quality Standard, Muir refined the correlation factors for different application scenarios (CitationMuir, 2000). However, Muir's study indicated that there was no universal correction factor for different applications. PM sampling location, sampling time and season, PM size, and instrumental settings all have different significant impacts on the correction factors. CitationCharron et al. (2004) found that both PM10 and PM2.5 TEOM data were significantly improved by adding the particulate NH4NO3 at a rural site. In 1993, a TEOM temperature setting of 30 °C was approved by EPA on a case-by-case basis (CitationRupprecht & Patashnick. Co., 2001). It was specified that if there is a significant portion of volatile organic compounds (VOCs) in PM10 and if the measurements are to be conducted in winter with outdoor temperature less than 25 °C, instead of using default setting of 50 °C, a lower temperature of 30 °C can be used. In 2001, CitationPatashnick et al. (2001) developed a differential TEOM system to overcome the bias of semivolatile PM mass loss. The preliminary data demonstrated its ability to track adsorption and desorption from sample filters (CitationJaques et al., 2004; CitationPatashnick et al., 2001).
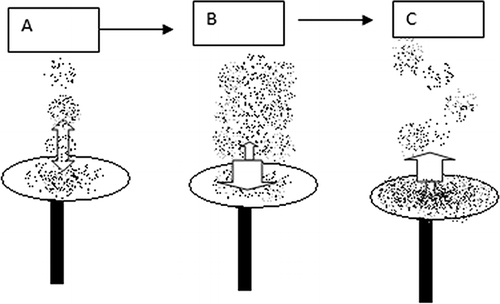
TEOM resonant frequency changes are not only influenced by the collected PM but also by air stream relative humidity (RH) and temperature, gaseous pollutants, and particle characteristics. The absorption of gaseous species and moisture in the sample stream onto the filter will result in positive measurement artifacts. The semivolatile and particle-bound water desorption from the filter will result in negative measurement artifacts. How these positive and negative artifacts are handled has significant impacts on TEOM measurements. The Division of Air Quality at North Carolina Department of Environment and Natural Resources recommended that negative values up to −10 μg/m3 should be kept and below −10 μg/m3 should be flagged (2007). But in its standard operating procedure (SOP), no detailed scientific basis was provided for this recommendation. The exact reasons for the positive and negative artifacts in TEOM mass concentration measurements are very complex and not fully understood. CitationGilbert and Clark (2001) and CitationJarrett et al. (2001) reported that moisture adsorption and desorption by the filter were the primary sources of negative and positive artifacts. The mechanism for moisture adsorption and desorption can also likewise apply to other semivolatile inorganic and organic compounds. Moisture adsorption and desorption are illustrated in three case scenarios in
Figure 1. Illustration of three case scenarios to explain positive and negative artifacts from moisture adsorption and desorption in TEOM mass measurement: (A) moisture adsorption and desorption from TEOM filter and collected PM are in equilibrium, the “true” mass concentration is measured; (B) during an increase RH, TEOM filter moisture absorption rate is faster than desorption rate, resulting in a higher TEOM mass concentration measurement (ΔM + absorbed moisture) than the “true” value (ΔM); (C) during decrease in RH, TEOM filter moisture absorption rate is slower than desorption rate, resulting in a lower mass concentration (ΔM − desorbed moisture) than the “true” mass (ΔM).
In recent years, animal feeding operations (AFOs) shifted to fewer farms with greater numbers of animals raised on each farm. PM concentration and emission at AFOs have been of increasing concern to the public and the EPA (CitationNational Research Council [NRC], 2003). The TEOM has been adapted for indoor PM concentration measurements in some AFO air quality studies (CitationHeber et al., 2006). However, only for PM10 in ambient air, TEOM was approved by US EPA as an equivalent method for 24-hr average concentration (CitationRupprecht & Patashnick. Co., 2001).
In poultry houses, air consists of a mixture of dry air mass, moisture (H2O), and several other gases such as carbon dioxide (CO2), ammonia (NH3), hydrogen sulfide (H2S), and VOCs and SVOCs. The gaseous pollutants may present with high concentrations. In-house moisture production includes water vapor evaporated from wet manure and exhaled by the birds. CO2 originates mainly from air exhaled by the birds, and can be used to assess the effectiveness of ventilation. NH3 originated mainly from bacteriological process in the manure, and it is easily bound with water to form NH3·H2O. In-house NH3 concentrations depend on ventilation, temperature, RH, bird stocking density, and manure conditions. Particle phase NH3·H2O may affect TEOM measurement. VOCs and SVOCs are produced from decomposition of amino acids and carbohydrates (CitationMackie et al., 1998; CitationMata-Alvarez et al., 2000). The reported top five VOCs or SVOCs include acetic acid, butanedione, methanol, acetone, and ethanol (CitationTrabuea et al., 2010). High PM concentrations were observed in poultry houses, and the influencing factors on PM concentrations in poultry houses include ventilation, bird activity, bird age and type, air temperature, RH, manure conditions, feeding system, hygiene, and manure management practices (CitationLi et al., 2011). Using TEOM for PM measurements in poultry houses faces some harsh environments, which the instrument was not originally designed to withstand.
For data quality assurance, there is an urgent need to investigate possible uncertainties, and limitations associated with TEOM measurements in AFO environments so that the measurements by TEOM and FRM methods can be comparable with each other. The objectives of this study were to (1) compare PM measurements by TEOMs and gravimetric filter-based PM samplers; (2) investigate the influence of TEOM internal temperature settings on PM measurements; and (3) assess the effects of instrumental and environmental variables on PM measurements in AFO-poultry environments.
Methodology
PM Monitors and Samplers: TEOM-PM2.5/PM10/TSP Monitors, Partisol 2300 PM2.5 Speciation Sampler, Low-Volume PM10 Sampler
The TEOM (1400A; Thermo Scientific, Franklin, MA, USA) is a “gravimetric” instrument that measures PM mass concentration using a tapered element oscillating microbalance. It draws air through a filter, continuously weighs the filter, and calculates mass concentrations. The fundamental measurement principle by the tapered oscillating element is based upon the following equation (CitationRupprecht & Patashnick. Co., 2001):
where M is the mass change in g, f0
is measured initial frequency in Hz, ft
is measured frequency at time t in Hz, and K
0 is the characteristic constant of each instrument. In this study, for PM2.5, PM10, or total suspended particle (TSP) measurements, the TEOM was operated with PM2.5, PM10, or TSP sampling inlets, respectively.
The Partisol 2300 PM2.5 speciation sampler (Thermo Scientific, Franklin, MA) is one type of filter-based PM2.5 sampler. This speciation sampler consists of four filter sample cartridges and a flow control system. These cartridges can hold quartz filters for organic carbon (OC) and element carbon (EC) analysis, nylon filters for ion (cation and anion) analysis, and Teflon filters for trace element and PM2.5 mass analysis, respectively. Each cartridge contained a sharp-cut PM2.5 impactor operating at a flow rate of 10.0 L/min (for nylon and quartz filters) or 16.7 L/min (for Teflon filters). In this study, 24-hr PM2.5 samples collected on the Teflon filters were analyzed for mass concentrations following EPA's standard operating procedures for the National Chemical Speciation Network (CSN) at RTI International (CitationRTI_International, 2003). The gravimetric analysis of PM2.5 samples was conducted in a temperature- and RH-controlled chamber. The temperature was controlled between 20 and 23 °C with a standard deviation less than 2 °C. The RH was controlled between 30% and 40% with a standard deviation less than 5%. The filters (46.2 mm diameter; Whatman 2-μm Polytetrafluoroethylene [PTFE]; Whatma Inc., Clifton, NJ) were conditioned in this chamber for a minimum of 48 hr prior to determining the pre- and post-weights of the filter using a microbalance with a minimum readability of ±1 μg and a repeatability of 1 μg. National Institute of Standards and Technology (NIST)-traceable standards were applied to determine the microbalance performance.
The filter-based low-volume PM10 sampler (LV-PM10) consisted of a FRM PM10 sampling head and flow control system (CitationWang et al., 2005). The LV-PM10 flow control system was designed and manufactured by Texas A&M University (CitationWang et al., 2005). The flow rate through the PM10 inlet was 1 m3/hr. This flow rate was maintained with less than 1% variation by monitoring pressure drop across a sharp-edge orifice meter. The PM10 sampling duration for the 46.2 mm diameter 2-μm PTFE was 24 hr. The total volume of air was calculated based on sampling time and air flow rate (CitationWang et al., 2005). The sample filters were kept in plastic Petri dishes and conditioned before and after testing in a weighing chamber for 24 hr at 20–23 °C and 30–40% RH for pre- and post-weights. Each filter sample was weighed three times, and the mean was used to calculate PM10 concentrations.
PM Samplers Placement and Settings
The field PM sampling and monitoring were conducted in a high-rise layer house at a commercial egg production farm in North Carolina. It was a typical tunnel-ventilated house in the Southeast United States with dimensions of 175 m (length) by 18 m (width). The house contained approximately 95,000 hens in six rows of 4-tier A-frame and curtain-backed cages on the upper floor. Manure fell onto the curtain-backed cages and then down into the first floor (pit), where it was stored for approximately one year.
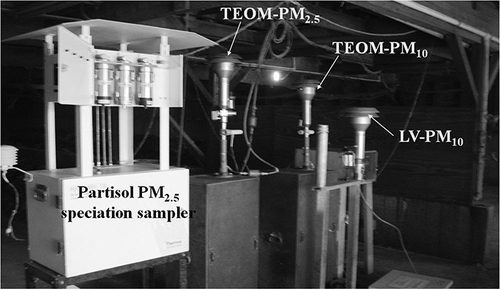
As illustrated in , for comparison of TEOM and filter-based samplers, the TEOM-PM10, TEOM-PM2.5, LV-PM10, and Partisol 2300 PM2.5 speciation samplers were placed immediately upstream of the primary representative exhaust fan on the first floor of the layer house. The sampler inlets were 2 m away from the fans, where airflow generated by the exhaust fans was observed to be low (less than 2 m/sec) and had insignificant impact on the samplers' performance. In this set of comparison studies, the internal temperatures of two TEOMs were set at 50 °C (the manufacturer default value). Fifteen filter-based 24-hr samples were taken for PM10, and 13 filter-based 24-hr samples were taken for PM2.5 during November 2009 to December 2009.
Figure 2. Collocated PM samplers on the first floor of the high-rise layer house (from left to right): Partisol PM2.5 speciation sampler, TEOM PM2.5, TEOM PM10, and LV-PM10.
To investigate the effect of TEOM operating temperature (internal temperature setting), the two side-by-side TEOMs () were tested with both units equipped with TSP, PM10, or PM2.5 sampling heads. One TEOM (labeled as TEOM 1) was set at the default temperature setting (50 °C). The other TEOM (labeled as TEOM 2) was set at either 30 °C or no internal heating. No internal heating means that the internal temperature control of this TEOM was turned off (in inactive mode). The continuous data collection occurred between October 2009 and December 2009.
Measurements of Environmental Parameters
In addition to PM mass concentration measurements, some environmental parameters were also measured to investigate their potential impacts on TEOM measurements. Surrounding air temperature and RH were measured by capacitance-type RH/T probes located in the house beside the TEOM units. Concentrations of NH3 and CO2 at this location were also measured with a photoacoustic infrared multigas monitor (INNOVA Model 1412; LumaSense Technologies A/S, Ballerup, Denmark). From December 2008 to December 2009, 66 PM2.5 nylon filter samples were taken using the Partisol 2300 speciation sampler for analysis of anion (, Cl−, and
) and cations (
, Na+, and K+). The ion analysis was conducted using ion chromatography (IC) by RTI International at Research Triangle Park (RTP), North Carolina.
TEOM Operation and Data Validation
The negative and positive artifacts/biases can be minimized when the average concentrations are calculated over longer periods of instantaneous monitoring data. The longer periods can smooth out short-term fluctuations and highlight longer-term trends. Meanwhile, the effects of moisture and volatile compounds could be minimized by limiting filter loading because accumulated PM results in more adsorption (CitationHeber et al., 2006). In this study, the TEOM filters were replaced when the loading reached 50%, and 30-min average data were recorded. Except for some ghost peaks, both positive and negative artifacts were kept in average mass concentration calculations. Deleting of negative values results in overestimating mass concentration and therefore should be avoided.
Statistical Analysis
All univariate data analyses, t tests, and linear models for this study were conducted using SAS/STAT software, version 9.2 (SAS Institute Inc., Cary, NC, USA).
Results and Discussion
TEOM versus Gravimetric Methods
Table 1 presents the means and medians of PM10 and PM2.5 mass concentrations from the filter-based samplers (LV and Partisol) and the TEOMs. During sampling period, the temperature ranged from 18.0 to 22.0 °C, with mean 20.2 °C and standard deviation 1.2 °C, and the relative humidity (RH) ranged from 56% to 79%, with mean 70% and standard deviation 5.6%. The TEOM reported lower PM10 and PM2.5 mass concentrations than the filter-based gravimetric method. Also robust estimators (medians) were calculated (), and they were influenced less by skewed data (occasional low/high-concentration data) than the TEOM means. The TEOM and LV sampler had similar median values of PM10, but significantly different medians of PM2.5.
Table 1. PM10 and PM2.5 concentration comparison
Both paired t test and nonparametric sign and signed rank tests were conducted to test the difference between these two methods (SCitationAS, 2009). The paired t test looks for a difference in means and assumes the observations are independent and identically normally distributed. Although the nonparametric signed and signed-rank tests look for a difference in medians, neither of these tests assume the data to be normally distributed. For PM10 comparisons, the P values for the paired t (0.029), signed (0.035), and signed-rank (0.021) tests were less than 0.05 (). Thus, there are significant differences between the PM10 means and medians of two methods. This observation agrees with other studies (CitationAllen et al., 1997; CitationPark et al., 2006; CitationRizzo et al., 2003; CitationVega et al., 2003). Also, for PM2.5, statistical tests show the two methods had significantly different means (P < 0.05).
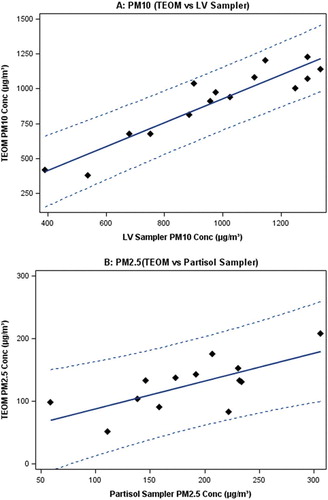
Reasonable strong correlation between PM10 concentrations determined by the TEOM and the LV sampler were obtained (), and is expressed by eq 3.
Figure 3. Comparisons of PM10 and PM2.5 measurements by the TEOMs and the filter-based samplers. Solid line = regression fit and dashed-line = 95% prediction limits.
where PM10TEOM is the PM10 mass concentrations measured by the TEOM μg/m3, and PM10LV is the PM10 mass concentrations measured by the LV-PM10 sampler μg/m3.
The linear fit between PM2.5 concentrations measured by the TEOM and Partisol samplers is shown in . PM2.5 data were more scattered than PM10, and the linear regression between those two methods is given in eq 4:
where PM2.5TEOM is the PM2.5 mass concentrations measured by the TEOM μg/m3, and PM2.5Par is the PM2.5 mass concentrations measured by the Partisol PM2.5 sampler μg/m3.
Intercepts close to 0 and slopes close to 1 indicate equivalency of the methods. In the two regression models (eqs 3 and 4), large intercepts (71.3 for PM10 and 43.8 for PM2.5) suggest a systematic bias between these two methods. In this study, the PM10 ratio (TEOM/gravimetric) averaged 0.936 (SD = 0.112), and varied between 0.704 and 1.148. The PM2.5 ratio (TEOM/gravimetric) averaged 0.738 (SD = 0.319) and varied between 0.373 and 1.672. The variability of the ratios further indicates the lack of agreement between TEOM and gravimetric methods.
The most frequently identified cause of difference in PM mass concentration measurements by filter-based and TEOM methods is the loss of semivolatile mass and PM-bound moisture due to heating of the TEOM sampling stream to 50 °C (CitationAllen et al., 1997; CitationGrover et al., 2005; CitationJerez et al., 2006; CitationVega et al., 2003). Therefore, to correct for possible loss of particulate NH4NO3 by heating, the concentration of particulate NH4NO3 was used to adjust TEOM measurements. The mean concentration of particulate NH4NO3 in the testing layer house was observed to be 0.843 μg/m3. Adding NH4NO3 to the TEOM-PM2.5 concentration did not make any significant improvement to the comparison between TEOM and filter-based methods. Compared with the PM2.5 mass concentration (mean = 195 μg/m3), the particulate NH4NO3 concentration (mean = 0.843 μg/m3) in the layer house was negligible. NH4NO3 was not the dominant compound, and did not contribute significantly to the overall PM mass. Therefore, a substantial portion of mass loss may have been from the volatilization of PM-bound moisture and VOCs/SVOCs. The National Air Emissions Monitor Study (NAEMS) at this research farm detected 20 most prevalent VOCs in canister samples taken at the same sampling location as it for this study. The top five VOCs were acetaldehyde, pentane, 2-butanone, isoporpanol, and dimethyl sulfide (CitationWang et al., 2010). Total VOC concentration ranged from 0.26 to 0.81 mg/m3 (CitationWang et al., 2010).
The results of this field study show that TEOM and filter-based methods are not interchangeable in determining PM concentrations in layer houses. Also, this field comparison results motivated a follow-up study on the effects of TEOM internal temperature settings on PM measurements.
Effects of Internal TEOM Temperature Settings
Lower PM with the TEOM as compared with filter-based sampling was hypothesized to be due to heating of the TEOM sampling stream (usually 50 °C). The PM lost in the sampling stream of the TEOM was assumed to be mainly SVOCs and PM-bound water. However, the amount of adsorption or desorption cannot be directly quantified. Temperature-dependent studies of the dynamics of adsorption and desorption may provide some insight on the impacts of adsorption or desorption. Therefore, two TEOM units were tested side by side (with internal temperature settings of 50 and 30 °C), and the mass concentrations measured by the units were compared.
Prior to the comparison test, two identical TEOM monitors (Model 1400A) were tested side by side for TSP and PM10 for a total 4 weeks to assess agreement.
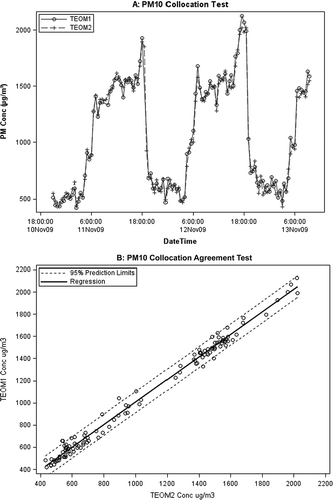
and show one example for each of TSP and PM10 collocation test results. The TEOM 1 and TEOM 2 had very similar mass concentration time series ( and ), and showing agreement of the two units. The TEOM 1 and TEOM 2 were highly correlated (R 2 > 0.9). Also the paired t test showed there were no significant differences between the TEOMs for TSP and PM10 (TSP: P = 0.139 and 95% confidence interval [CI] = [−5.39, 38.4]; PM10: P = 0.08 and 95% CI = [−16.8, 0.96]). Overall, the repeatability of the two instruments was very good, and both tracked well over the entire testing period.
Figure 4. TEOM collocation test results for TSP: (A) TSP collocation test time profile for TEOM 1 and TEOM 2 and (B) the agreement test of TEOM 1 and TEOM 2 (solid line = regression line and dashed lines = 95% prediction limits).
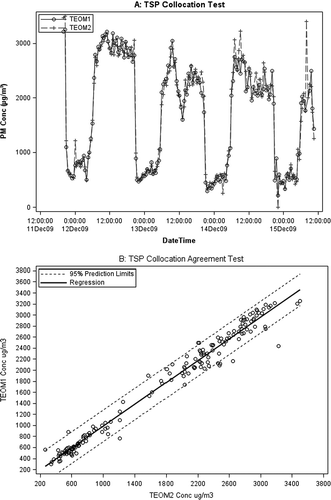
Figure 5. TEOM collocation test results for PM10: (A) PM10 collocation test time profile for TEOM 1 and TEOM 2 and (B) the agreement test of TEOM 1 and TEOM 2 (solid line = regression line and dashed lines = 95% prediction limits).
shows the comparison of PM2.5, PM10, and TSP measured by TEOM 1 at 50 °C and TEOM 2 at 30 °C. It is observed from that the TEOM operating at 50 °C measured much lower mass PM2.5 concentrations as compared with 30 °C. For PM10 () and TSP (), the magnitudes of the differences in mass concentrations from the TEOMs operated at 50 and 30 °C were smaller than for PM2.5. This lower magnitude of the differences in PM10 or TSP than in PM2.5 is consistent with the losses of SVOCs and bound moisture associated with the fine PM, because SVOCs and PM-bound moisture have larger proportions in the fine PM fraction than in larger particles (CitationFinlayson-Pitts and Pitts, 1999). Statistical analyses () showed significant differences between these two TEOMs for PM2.5 measurements (P < 0.0001). The mean difference was 59.3 μg/m3 (50 vs. 30 °C) and the relative difference percentage (RDiff) was 49.2%, which means almost half of PM2.5mass was lost when TEOM operation temperature setting changed from 30 to 50 °C. For PM10 measurements, the mean difference was 58.6 μg/m3 and RDiff was 5.72%. For TSP, the mean difference was 182 μg/m3 and RDiff was 11.0%. Higher errors in TSP than PM10 was possibly due to higher frequency noise error (TSP noise level of 0.46 vs. PM10 noise level of 0.16) and larger standard errors. The noise is an indicator of how well the mass transducer is performing, and it is considered to be normal if less than 0.10. The results show that TEOM internal temperature settings have significant impact on PM mass concentrations.
Figure 6. The effects of internal temperature setting on TEOM measurements: (A) PM2.5 50 °C versus 30 °C test; (B) PM10 50 °C versus 30 °C test; and (C) TSP 50 °C versus 30 °C test.
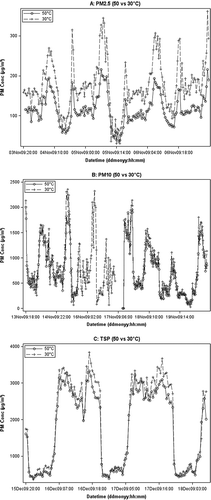
Table 2. Effects of TEOM internal temperature settings (30 vs. 50 °C) on PM measurements and the statistical test results
shows the comparison of PM2.5, PM10, and TSP concentrations measured by TEOM 1 (50 °C) and TEOM 2 (temperature control was inactive). It was observed that in-house temperature variation had big effect on the resonant frequency of the tapered element. This is apparently the reason for the negative and positive artifacts in the TEOM signals (). For TEOM 2, there were 16% negative mass signal for PM2.5, 7.8% for PM10, and 36.1% for TSP. When TEOM temperature control is inactive, air mass composition changes and thermal instability cause negative/positive artifacts (CitationAllen, 1998; CitationAllen et al., 1997; CitationPatashnick, 1998a, Citation1998b). Also as shown in , both positive and negative amplitudes of the response increased when TEOM's temperature control was inactive. Moreover, when the temperature control was inactive, there were higher noise levels. When TEOM operated at 50 °C, the noise values were normally in the range of 0.1 to 2.0 (higher than ambient measurement noise level). However, when TEOM operated at ambient conditions (temperature control was inactive), the noise values varied from 0.5 to 20. Such high noise level interfered with the signal.
Figure 7. TEOM temperature settings tests: 50 °C versus inactive; (A) PM2.5 (B) PM10, and (C) TSP.
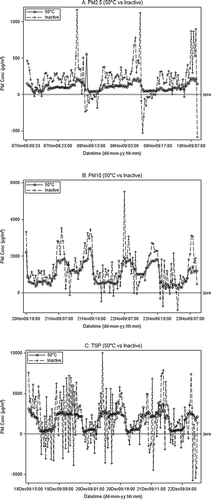
Statistical analysis () showed there were significant differences between the TEOMs for PM2.5 measurements (P < 0.0001). The mean difference was 100 μg/m3 (50 °C vs. inactive) and the relative difference percentage (RDiff) was 55.9%. For PM10 measurements, the mean difference was 271 μg/m3 and RDiff was 27.0%. For TSP, the mean difference was −552 μg/m3 and RDiff was −21.6%. The significant disagreement of TEOM 1 and TEOM 2 for TSP may have been due to high noise level from TEOM 2.
Table 3. Effects of TEOM internal temperature settings (inactive vs. 50 °C) on PM measurements and the statistical test results
The TEOM measurement is based upon the change in the tapered element's natural resonance frequency and spring constant of K 0. The “Young's modulus” (a measure of the stiffness) of the tapered element changes with the temperature. Therefore, the spring constant of the tapered element (K 0) will change as the temperature changes, thus induces thermal bias for TEOM measurement. The inactive mode reflects environmental temperatures, and therefore will be more subject to the surrounding air temperature fluctuation effects. The inactive model was used in this study for comparison purpose only. It is not recommended in the actual operations. Maintaining a constant sample temperature is critical. In the future, some advanced computer algorithms can be applied to analyze and transform the signal while suppressing the effects of noise, so useful information contained in the raw signal can be obtained. These experimental results indicate that the TEOM monitor could not operate correctly when the internal heating was turned off.
Effects of Environmental and Instrumental Parameters
The preceding results motivated a further analysis of the data to assess the effects of environmental and instrumental factors (called predictor variables) on TEOM measurements (called the response). The environmental factors included RH, in-house temperature (Temp), and NH3 and CO2 concentrations. NH3 and CO2 were used in this study as practical substitutes to assess the VOC effect on PM measurements. VOCs are produced from the degradation of amino acids and carbohydrates in birds and from incomplete anaerobic digestion of manure (CitationMackie et al., 1998; CitationMata-Alvarez et al., 2000). It is very difficult to quantify VOCs accurately in AFOs at present. On the other hand, CO2 are produced mainly from air exhaled by the birds, and NH3 are produced mainly from bacteriological process in the manure. The NH3 and CO2 may reflect the variation of VOC emission intensity in AFOs. The instrumental factors include (1) the difference of noise, which is an indicator of how well the mass transducer is performing; and (2) the difference in filter loading, which is an indicator of the filter's total capacity. The descriptive statistics of the environmental and instrumental factors are listed in The PM10 and TSP instrument noises were higher than the defined normal value of 0.1. Also, the layer house had high levels of RH (61% in the layer house vs. 50% annual average ambient RH in North Carolina), NH3 (60 ppm in the layer house vs. several ppb in the background ambient locations), and CO2 (2000 ppm in the poultry house vs. 300–400 ppm in the background ambient locations).
Table 4. Descriptive statistics of the environmental and instrumental factors
The relationship between the environmental and instrumental factors on the difference of PM mass concentrations between two TEOMs is shown in From this figure, it appears that there are some relationships between the predictor variables and the response. By using regression analysis (CitationJohnson and Wichern, 2008), the effects of the predictor variables on the response were estimated () for PM2.5, PM10, and TSP. Variance inflation factors (VIFs) were used to diagnose independent variable multicollinearity because multicollinearity of the independent variables provides redundant information and it affects the parameter estimates (CitationTao and Walsh, 2005). The VIFs () are not quite large for all six independent variables, and they do not indicate the presence of strong collinearity. The estimate P values associated with the slopes for six independent variables indicate () (a) for PM2.5, the slopes of noise diff, RH, and CO2 were significantly different from zero at α = 0.1; (b) for PM10, the slopes of noise diff, and RH were significantly different from zero at α = 0.1; and (c) for TSP, only the slope of CO2 was significantly different from zero at α = 0.1.
Figure 8. The relationships between the PM mass difference (Diff Conc = MC_30 °C − MC_50 °C) and the environmental and instrumental parameters (Diff Filter loading = filter loading difference, Diff Noise = noise difference, RH = relative humidity of surrounding air, temperature = in-house air temperature, NH3 and CO2) (shaded area = 95% CI).
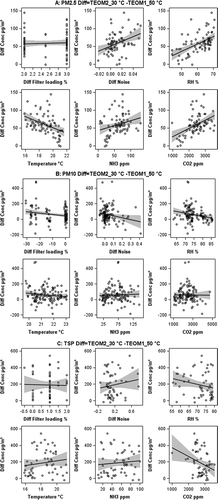
Table 5. Parameter estimates for PM2.5, PM10, and TSP measurementsFootnote*
Based upon Least absolute shrinkage and selection operator (LASSO) method of CitationTibshirani (1996), the best general linear models are
PM2.5:
PM10:
TSP:
where Diff Conc is the difference of mass concentrations measured by two TEOMs (concentrations at 30 °C minus concentrations at 50 °C), Diff Noise is the difference of noises from two TEOMs (noise at 30 °C minus noise at 50 °C), Diff filter loading is the difference of filter loading from two TEOM, RH is in-house relative humidity, and CO2 is in-house carbon dioxides concentrations in ppm.
The percentages of the variability in mass difference (Diff Conc) explained by these models are approximately 35%, 13%, and 13% for PM2.5, PM10, and TSP, respectively. It is obvious that these environmental and instrumental factors did not explain well the mass differences. Perhaps some unknown important factors existed but were not included in the models. In addition to these additive models (eqs 5–7), models with interactions between variables were also tested, and the interactions among these variables were not significant.
Although there was some evidence showing impacts of environmental and instrumental parameters on TEOM measurement (especially for PM2.5), it is very difficult to quantify and to minimize their impacts. How to reduce errors and increase the accuracy remains a great challenge for TEOM and FRM data comparison.
Conclusions
In this study, a field evaluation of TEOM PM measurements in a high-rise layer house was conducted to investigate possible uncertainties and limitations associated with TEOM measurements in poultry operation environment. It was observed that TEOM gave lower readings of both PM10 and PM2.5 mass concentrations as compared with measurements by the filter-based gravimetric method in a poultry house. The inclusion of particulate NH4NO3 did not significantly improve the comparison of TEOM-PM2.5 measurement and filter-based PM2.5 measurement. The most likely explanations for the difference between these two methods are the TEOM internal heating, moisture, and VOC adsorption and desorption.
For TSP, PM10, and PM2.5 measurements, TEOM internal temperature setting has significant effect. Higher PM mass concentrations were measured at lower instrumental temperature setting. The influences of environmental and instrumental parameters were also assessed, and their significances varied case by case. The impacts of the environmental and instrumental parameters on TEOM measurement were very difficult to quantify. For AFO-related air quality study, making TEOM and FRM measurements comparable remains to be a great challenge.
Acknowledgments
This project was supported in part by USDA NRI grant 2008–35112–18757 and NSF CAREER Award CBET-0954673.
The PM2.5 ion analysis was conducted by Dr. Jayanty's group at RTI International, Research Triangle Park, North Carolina. The NH3 and CO2 concentrations were measured under the National Air Emission Monitoring Study (NAEMS)—Southeast Layer Site, which was funded by the American Egg Board. The authors would also like to thank the egg production farm for the gracious support.
Dr. John T. Walker from EPA, and Drs. Sanjay Shah, Ratna Sharma, and Wayne Robarge from North Carolina State University reviewed the manuscript and provided valuable technical advices. The authors also are grateful for the peer review comments.
References
- Allen , G . 1998 . Author's responses (Letter to the . Journal of the Air and Waste Management Association , 48 : 197 – 199 .
- Allen , G. , Sioutas , C. , Koutrakis , P. , Reiss , R. , Lurmann , F.W. and Roberts , P.T. 1997 . Evaluation of the TEOM method for measurement of ambient particulate mass in urban areas . Journal of the Air and Waste Management Association , 47 : 682 – 689 .
- Ayers , G.P. , Keywood , M.D. and Gras , J.L. 1999 . TEOM vs. manual gravimetric methods for determination of PM2.5 aerosol mass concentration . Atmospheric Environment , 33 : 3717 – 3721 .
- Charron , A. , Harrison , R.M. , Moorcroft , S. and Bookerb , J. 2003 . Quantitative interpretation of divergence between PM10 and PM2.5 mass measurement by TEOM and gravimetric (Partisol) instruments . Atmospheric Environment , 38 : 415 – 423 .
- Charron , A. , Harrison , R.M. , Moorcroft , S. and Booker , J. 2004 . Quantitative interpretation of divergence between PM10 and PM2.5 mass measurement by TEOM and gravimetric (Partisol) instruments . Atmospheric Environment , 38 : 415 – 423 .
- Finlayson-Pitts , B. and Pitts , J.J. 1999 . Chemistry of the Upper and Lower Atmosphere: Theory, Experiments, and Applications , London : Academic Press .
- Gilbert , M. and Clark , N.N. 2001 . Measurement of particulate matter from diesel engine exhaust using a tapered element oscillating microbalance . International Journal of Engine Research , 2 : 2041 – 3149 .
- Green , D. 2001 . Evaluation of TEOMTM ‘correction factors’ for assessing the EU Stage 1 limit values for PM10 . Atmospheric Environment , 35 : 2589 – 2593 .
- Green , D. and Fuller , G.W. 2006 . The implications of tapered element oscillating microbalance (TEOM) software configuration on particulate matter measurements in the UK and Europe . Atmospheric Environment , 40 : 5608 – 5616 .
- Green , D. , Fuller , G. and Barratt , B. 2001 . Evaluation of TEOM (TM) ‘correction factors’ for assessing the EU Stage 1 limit values for PM10 . Atmospheric Environment , 35 : 2589 – 2593 .
- Grover , B.D. , Kleinman , M. , Eatough , N.L. , Eatough , D.J. , Hopke , P.K. , Long , R.W. , Wilson , W.E. , Meyer , M.B. and Ambs , J.L. 2005 . Measurement of total PM2.5 mass (nonvolatile plus semivolatile) with the filter dynamicmeasurement system tapered element oscillating microbalance monitor: particulate matter supersites . Journal of Geophysical Research-Atmospheres , 110 (D7):D07S03.1–D07S03.9 )
- Heber , A.J. , Lim , T.T. , Ni , J.Q. , Tao , P.C. , Schmidt , A.M. , Koziel , J.A. , Hoff , S.J. , Jacobson , L.D. , Zhang , Y.H. and Baughman , G.B. 2006 . Quality-assured measurements of animal building emissions: particulate matter concentrations . Journal of the Air and Waste Management Association , 56 : 1642 – 1648 .
- Jaques , P.A. , Ambs , J.L. , Grant , W.L. and Sioutas , C. 2004 . Field evaluation of the differential TEOM monitor for continuous PM2.5 mass concentrations . Aerosol Science and Technology , 38 : 49 – 59 .
- Jarrett , R.P. , Clark , N.N. , Gilbert , M. and Ramamurthy , R. 2001 . Evaluation and correction of moisture adsorption and desorption from a tapered element oscillating microbalance . Powder Technology , 119 : 215 – 228 .
- Jerez , S.B. , Zhang , Y.H. , McClure , J.W. , Jacobson , L. , Heber , A. , Hoff , S. , Koziel , J. and Beasley , D. 2006 . Comparison of measured total suspended particulate matter concentrations using tapered element oscillating microbalance and a total suspended particulate sampler . Journal of the Air and Waste Management Association , 56 : 261 – 270 .
- Johnson , R.A. and Wichern , D.W. 2008 . Applied Multivariate Statistical Analysis , Upper Saddle River , NJ : Pearson .
- King , A.M. , Pless-Mulloli , T. , Merefield , J. and Stone , I. 2000 . New directions: TEOMs and the volatility of UK non-urban PM10: a regulatory dilemma? . Atmospheric Environment , 34 : 3211 – 3212 .
- Lee , J.H. , Hopke , P.K. , Holsen , T.M. and Polissar , A.V. 2005 . Evaluation of continuous and filter-based methods for measuring PM2.5 mass concentration . Aerosol Science and Technology , 39 : 290 – 303 .
- Li , Q.-F. , Wang-Li , L. , Shah , S.B. , Jayanty , R.K.M. and Bloomfield , P. 2011 . Fine particulate matter in a commercial egg production facility and its vicinity . Transactions of the ASABE. , 54 ( 6 ) : 2299 – 2310 .
- Mackie , R.I. , Stroot , P.G. and Varel , V.H. 1998 . Biochemical idenfication and biological origin of key odor components in livestock waste . Journal of Animal Science , 76 : 1331 – 1342 .
- Mata-Alvarez , J. , Mace , S. and Llabres , P. 2000 . Anaerobic digestion of organic solid wastes: an overview of research achievements and perspectives . Bioresource Technology. , 74 : 3 – 16 .
- Muir , D. 2000 . New directions: the suitability of tapered element oscillating microbalances (TEOMs) for PM10 monitoring in Europe. The use of PM10 data as measured by TEOM for compliance with the European Air Quality Standard . Atmospheric Environment , 34 : 3209 – 3211 .
- National Research Council (NRC) . 2003 . Air Emissions from Animal Feeding Operations: Current Knowledge, Future Needs , Washington, DC : The National Academies Press .
- North Carolina Department of Environment and Natural Resources . 2007 . Tapered Element Oscillating MicroBalance (TEOM) Site Operator's Standard Operating Procedure and Quality Assurance Plan (QAP/SOP) Raleigh, NC: Division of Air Quality
- Page , S.J. , Tuchman , D.P. and Vinson , R.P. 2007 . Thermally induced filter bias in TEOM mass measurement . Journal of Environmental Monitoring , 9 : 760 – 767 .
- Park , K. , Chow , J.C. , Watson , J.G. , Trimble , D.L. , Doraiswamy , P. , Arnott , W.P. , Stroud , K.R. , Bowers , K. , Bode , R. , Petzold , A. and Hansen , A.D.A. 2006 . Comparison of continuous and filter-based carbon measurements at the Fresno Supersite . Journal of the Air and Waste Management Association , 56 : 474 – 491 .
- Patashnick , H. 1998a . Letters to the . Journal of the Air and Waste Management Association , 48 : 195 – 197 .
- Patashnick , H. 1998b . Rebuttal (Letters to the Editor) . Journal of the Air and Waste Management Association , 48 : 199 – 200 .
- Patashnick , H. and Rupprecht , E.G. 1991 . Continuous PM-10 Measurements using the tapered element oscillating microbalance . Journal of the Air and Waste Management Association , 41 : 1079 – 1083 .
- Patashnick , H. , Rupprecht , G. , Ambs , J.L. and Meyer , M.B. 2001 . Development of a reference standard for particulate matter mass in ambient air . Aerosol Science and Technology , 34 : 42 – 45 .
- Price , M. , Bulpitt , S. and Meyer , M.B. 2003 . A comparison of PM10 monitors at a Kerbside site in the northeast of England . Atmospheric Environment , 37 : 4425 – 4434 .
- Rizzo , M. , Scheff , P.A. and Kaldy , W. 2003 . Adjusting tapered element oscillating microbalance data for comparison with Federal Reference Method PM2.5 measurements in Region 5 . Journal of the Air and Waste Management Association , 53 : 596 – 607 .
- Rogers , C.F. , Watson , J.G. , Day , D. and Oraltay , R.G. 1998 . Real-time liquid water mass measurement for airborne particulates . Aerosol Science and Technology , 29 : 557 – 562 .
- RTI_Internatinal . 2003 . Standard Operating Procedure for PM2.5 Gravimetric Analysis , Research Triangle Park, NC : RTI_Internatinal .
- Rupprecht & Patashnick. Co . 2001 . Operating Manual TEOM Series 1400a , Albany, NY : Rupprecht & Patashnick. Co .
- SAS . 2009 . SAS/STAT 9.2 User's Guide , 2nd , Cary, NC : SAS Institute Inc .
- Schwab , J.J. , Spicer , J. , Demerjian , K.L. , Ambs , J.L. and Felton , H.D. 2004 . Long-term field characterization of tapered element oscillating microbalance and modified tapered element oscillating microbalance samplers in urban and rural New York State locations . Journal of the Air and Waste Management Association , 54 : 1264 – 1280 .
- Tao , J. and Walsh , S. 2005 . Statistics II: ANOVA and Regression Course Notes , Cary, NC : SAS Institute Inc .
- Tibshirani , R. 1996 . Regression shrinkage and selection via the Lasso . Journal of the Royal Statistical Society Series B , 58 : 267 – 288 .
- Trabuea , S. , Scoggina , K. , Li , H. , Burns , R. , Xin , H. and Hatfielda , J. 2010 . Speciation of volatile organic compounds from poultry production . Atmospheric Environment , 44 : 3538 – 3546 .
- US Environmental Protection Agency . 1997 . Ambient air monitoring reference and equivalent methods designation . Federal Register , 55 : 43406 – 43407 .
- Vega , E. , Reyes , E. , Wellens , A. , Sanchez , G. , Chow , J.C. and Watson , J.G. 2003 . Comparison of continuous and filter based mass measurements in Mexico City . Atmospheric Environment , 37 : 2783 – 2793 .
- Wang , K. , Kilic , I. , Li , Q. , Wang , L. , Bogan , W.L. and Heber , A.J. 2010 . National Air Emissions Monitoring Study: Emissions Data from Two Tunnel-Ventilated Layer Houses—Site NC2B , West Lafayette , IN : Purdue University .
- Wang , L.J. , Wanjura , J.D. , Parnell , B.W. , Lacey , R.E. and Shaw , B.W. 2005 . Performance characteristics of low-volume PM10 sampler . Transaction of the ASAE , 48 : 739 – 748 .