
Abstract
The purpose of this study was to evaluate the neuroprotective effect of leptin on a non-human primate model of cerebral ischemia. A total of 39 Guangxi macaques were used to establish the primate cerebral-ischemia model. HE staining was used to evaluated the pathological changes. Moreover, magnetic resonance imaging was used for the detection of embolic area. The measurements of behavior observation and cerebral infarction area were also performed. They all received autologous thrombus operation. Furthermore, western blot and RT-PCR were also used to detect the protein and mRNA expression levels of apoptosis-related factors. Our results showed that leptin could reduce the volume of cerebral infarction by about 35%. Behavioral defects can be significantly improved. In addition, mid-term and long-term behavioral deficiencies had been significantly improved by leptin. Moreover, leptin significantly decreased the expression levels of caspase-3 and Bax, and increased the expression levels of Bcl-2. In conclusion, leptin has neuroprotective effects on cerebral ischemia by effectively reducing the volume of cerebral infarction.
Introduction
Cerebral ischemia is a serious threat to human health with high incidence rate, disability, and mortality.Citation1 Cerebral ischemia refers to a series of symptoms caused by insufficient blood supply to the brain, which is difficult to meet the metabolic needs of brain tissue. Clinical manifestations include dizziness, headache, numbness of limbs or transient loss of consciousness. In severe cases, irreversible brain damage or even death may occur. It is difficult to perform clinical treatment for cerebral ischemia because neurons are poorly tolerant to ischemia and hypoxia. The principle of treatment is to restore the blood flow of the ischemic tissue as soon as possible, deliver nutrients such as sugar and oxygen, and reduce ischemia-reperfusion injury and cell apoptosis.Citation2
Leptin is a polypeptide hormone encoded by an obesity (OB) gene with a molecular weight of 16 kDa. Leptin is mainly synthesized and released by fat cells. It can also be secreted by tissues and organs such as the heart, brain, gastric mucosa, skeletal muscle, and cartilage. In recent years, some studies have shown that leptin has neuroprotective effects on cerebral ischemia.Citation3–6 However, these studies have been limited to cell culture and mouse models. Nonhuman primates are very close to humans in phylogeny. The structure of the brain, the ratio of gray to white matter and the grade of its microvascular network, especially the distribution area of the middle cerebral artery, are similar to those of human beings. In addition, macaques are similar to humans in behavior, movement, sensation and non-bony meninges, which are often used to prepare encephalopathy models. In the present study, the neuroprotective effect of leptin on cerebral ischemia was assessed on a non-human primate model of cerebral ischemia.
Materials and methods
Experimental animals. This study was performed in our experimental center and approved by the animal ethnic committee of our unit (approval number: GLMU1A2017025). A total of 39 Guangxi macaques were used in the present study and purchased from Guilin Yongfu Animal Experimental Base. All included macaques were male, weighed 5–8 kg, and aged 5–7 years old. Those macaques were divided into leptin-treatment group and PBS-treatment group according to the numerical randomization method. There were 18 macaques in each group. Among them, 9 were used for behavioral-defect scores, 3 for assessing the mRNA and protein expression of apoptotic genes, and 6 for cerebral-infarction-volume measurements. There were 36 macaques who underwent surgery.
Establishment of the primate cerebral-ischemia model
The model was established as previous described.Citation7,Citation8 The procedure of modeling is shown in . After general anesthesia through injection of propofol (2 mg/kg) via saphenous vein, animals were placed on an interventional operating table. The right-inguinal area was prepared. The skin was cut after routine disinfection. The muscles were exposed to the femoral artery by blunt dissection. Punctures were made under direct vision. The 4 F-catheter sheath was placed into the femoral artery, and the 4 F-cobra catheter was used for angiography of the aortic arch, as well as the common carotid artery or internal carotid artery. A 1.7 F nerve-intervention micro catheter (echelon10 ev3) was intubated into the middle cerebral artery (MCA) M1 segment by a coaxial-catheter technique and was then imaged. The autologous thrombus was injected through the micro catheter (the 20-cm-long silicone tube was cut), and the embolization time was recorded. After 5 min, the angiography was reviewed, and the catheter was withdrawn. The incision was removed, and the arterial sheath was removed and compressed for 20 min. An MRI scan was performed 2 h after the operation. After resuscitation, macaques were returned to the animal room. Neurological changes of the macaques were monitored postoperatively, and the records were analyzed. MR scans were reviewed 24 h later.
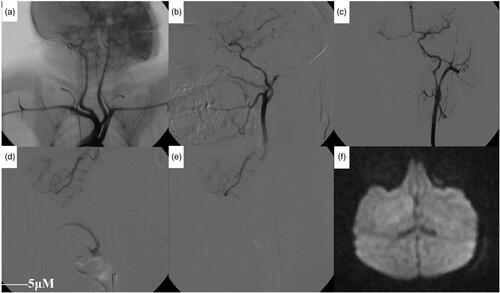
Figure 1. Angiographic analysis of the artery after modeling. (a) The left-common carotid artery and the right-brachiocephalic artery had a common stem and were open to the aortic arch (black arrow). Both sides of the vertebral artery were emitted by the subclavian artery (white arrow). (b) The internal carotid artery was thinner and longer than the external carotid artery, and the distal part of the internal carotid artery was divided into the ocular artery (white arrow) and the posterior communicating artery (black arrow). (c) After one side of the internal-carotid-artery angiography, the contralateral cerebral artery could be seen through the anterior communicating artery. (d) Angiography showing middle cerebral artery and branches before embolization. (e) Angiography showing a decrease in the middle-cerebral-artery branch after embolization. (f) DWI showing patchy high-signal area 2 h after embolization.
Macaque-head MRI-scanning
The macaques were transported to the MRI room under anesthesia. A 3.0-T MR scanner and head coils were used to scan the head axis. The scanning sequence was T1WI, T2WI, and DWI. The layer thickness was 3 mm. The main parameters were as follows: T1WI: SE sequence was TE 11.0 ms and TR 500 ms; T2WI: TSE sequence was TR 4100 ms and TE 96 ms; DWI: EPI sequence was TR 3000 ms and TE 81 ms; b = 0, 1000.
Autologous thrombus operation
The macaques were fasted for 24 h before surgery and were provided a moderate amount of water. Each macaque received an intramuscular injection of compound anesthetic (ketamine 1 mL + diazepam 1 mL + scopolamine 1 mL). After successful anesthesia, a CT scan was performed before surgery to exclude intracranial lesions.
After anesthesia, 5 mL of autologous venous blood was collected into and heparin-anticoagulated tube. After high-speed centrifugation, the upper serum was collected and plasma coagulase was injected into an epidural anesthesia tube (Henan Xinxiang Camel Medical Device Company) with a diameter of 1 mm to make an autologous thrombus.
The technique of middle-cerebral-artery intubation was based on previous studies.Citation9,Citation10 After animal anesthesia, oxygen was delivered through a nasal apparatus. A conventional electrocardiogram (ECG)-monitoring system was used to monitor ECG, respiratory pressure and blood pressure. A micro-pump intravenous injection of propofol was administered to maintain anesthesia. After skin incision, the Seldinger technique was used to intubate the 1.7-F micro catheter into the beginning of the middle cerebral artery (M1 segment). Subsequently, the middle-cerebral-artery angiography was performed with the total amount of 1.8 mL and the speed of 0.8 mL/s to monitor the right-middle cerebral artery blood-flow status (all guidewire catheters were products of Cordis).
The prepared thrombus of 20 cm (1 mm in diameter) was injected into the middle cerebral artery through the micro catheter. A middle-cerebral-artery angiography was performed again to confirm successful embolization.
Medical treatment
30 min after embolization, animals in treatment group were intraperitoneal injected with 1 mg/kg of recombinant human leptin (Shanghai Yubo Biotechnology Co., Ltd., Shanghai, China) in 5 mL PBS solution, and those in the control group were intraperitoneal injected with 5 mL of PBS solution.
MRI
MRI DWI-sequence scan re-confirmed embolization using a Siemens Verio 3.0 T MRI scanner 60 min after embolization. The embolization area was measured by an MRI T2WI scan 24 h after embolization, and the embolization volume was calculated. All scans were axial scans, and the DWI and T2WI scanning parameters were shown in .
Table 1. The DWI and T2WI scanning parameters
Cerebral-infarct-volume measurement
T24 h after embolization, 6 animals in each group were sacrificed through injection of 50 mg propofol via saphenous vein to isolate brain tissue and 10 brain sections (each section was 4 mm) were cut. Subsequently, 4 g of TTC powder was dissolved in 200 ml of dd-H2O (Sigma Aldrich Shanghai Trading Co., Ltd.). Brain sections were dried for 15 min and then turned over and dried for another 10–15 min. After fixing the tissues with formaldehyde, the infarct size was measured to calculate the infarct volume.
Western-blotting analysis
2 h after embolization, three animals in each group were killed to obtain brain tissues. The brain tissues in treatment group were taken from the infarct area, the infarct edge area, and the ipsilateral and contralateral normal-brain tissues. The same regional brain tissue was collected from the control group. An appropriate amount of RIPA lysate (containing 1% PMSF) was added and then tissue was lysed on ice for 30 min and ultrasonically homogenized three times on ice (10 s each time) followed by centrifuging at 12,000 rpm for 20 min at 4 °C to collect the supernatant. The protein was quantified by the Biyuntian Protein Quantitation Kit. After that, loading buffer was added to protein and boiled for 10 min. Then, protein was electrophoresed on a 12% SDS-polyacrylamide gel, transferred to a PVDF membrane, blocked with TBS solution (containing 5% skim milk powder) for 1 h at room temperature. The membrane was incubated with the following corresponding primary antibodies overnight at 4 °C, including rabbit anti-human caspase-3 polyclonal antibody (1:300), rabbit anti-human Bcl-2 polyclonal antibody (1:400), rabbit anti-human Bax polyclonal antibody (1:400), and rabbit anti-human β-actin polyclonal antibody (1:500). After that, horseradish peroxidase-labeled IgG (goat anti-rabbit, 1:5000) was added and incubated for 90 min at room temperature. The membrane was then washed three times in TBST buffer for 10 min each time. A chemiluminescence detection system was added for membrane development and exposure.
RT-PCR analysis
After the animal was sacrificed, the brain tissues of the ischemic area were isolated to extract total RNA using Trizol reagent. The cDNA was synthesized using Oligo(dT)15 primer according to the method provided by the RT-PCR kit in a 20 µL system according to the instructions. Then, PCR amplification was performed using the corresponding primers provided by the kit with conditions as follows: pre-denaturation at 95 °C for 5 min, 94 °C for 30 s, 60 °C for 30 s with 40 cycles, and 72 °C extension for 7 min. Next, 10 µL of PCR product was electrophoresed on a 15 g/L agarose gel. A Gel-Pro Imager Kit imaging-system scanner was used for semi-quantitative analysis. Gene expression levels were assessed by comparing the relative optical density values (relative IOD) of samples to that of the loading control (β-actin).
Behavioral scoring
Animals’ behavioral performance was monitored daily for 30 days after surgery. The behavioral-scoring standard was performed according to a previous study by Roitberg et al..Citation9 All 11 observations contained 41 points, with 0 points indicating no behavioral deficits and 41 points indicating the most serious neurological deficits. Behavioral observations were performed 24 h after embolization and stopped on the 29th day after surgery.
HE staining
The remaining 9 animals in each group were sacrificed on the 29th day after surgery to isolate the brain tissues for routine HE staining to observe pathological changes.
Statistical analysis
The statistical analysis was performed using SPSS 20.0 software. All data were shown as mean ± standard deviation (SD) and compared by student t test. p < 0.05 was considered statistically significant.
Results
Successful establishment of cerebral ischemia model
All experimental animals were successfully punctured and intubated. The micro catheter was successfully inserted into the initial segment of the middle cerebral artery of the monkey and injected into the prepared autologous thrombus. 10 animals were embolized with the right-middle cerebral artery and 3 animals were embolized with the left-middle cerebral artery. The intubation time (perspective time) was 1.5–10 min with an average of 4.7 min. There were no abnormalities in the animals during the operation and all animals recovered smoothly after 2 h of embolization. After waking, the experimental animals showed varying degrees of limb neurological dysfunction. 1 experimental animal died 18 h after surgery. A total of 5 animals died during anesthesia and surgery, with a mortality rate of 13.9% (5/36). 3 animals died 48 h after surgery, the postoperative mortality rate was 9.7% (3/31), and the total mortality rate was 22.2% (8/36). A total of 28 animals were successfully modeled. 6 animals were used for Western blotting and RT-PCR (3 animals in each group) analysis. 12 animals were used for cerebral infarction volume measurements (six animals in each group). 10 animals were used for behavioral-defect scoring (five animals in each group).
Imaging performance before and after embolization
The vascular anatomy of the monkey brain is similar to that of the human brain. Our previous studies showed that monkeys, as high-grade primates, have similar cerebral-vascular anatomy to that of humans.7,8 The brain angiographies from our experimental monkeys confirmed again that their cerebral vascular anatomy was consistent with that of humans. Hence, their vascular branches can be named after human cerebral-vascular branches. Aortic-arch angiographies showed a high proportion of left common carotid artery and the right brachiocephalic artery originating from the same blood vessel, and 9 monkeys showed that the left-common carotid artery and the right brachiocephalic artery had a common stem and were open to the aortic arch (i.e., the aortic arch showed a two-branched structure; ). The other 4 monkey aortic arches had a three-branched structure (i.e., the aortic arch separated the innominate artery, left-common carotid artery, and the left-subclavian artery). The internal carotid artery was smaller and more curved than the external carotid artery, and the distal segment was more constricted. The internal-carotid-artery siphon of monkeys is similar to that of humans. The internal-carotid-artery siphon of the monkey during the ascending process forms a thicker ophthalmic artery and posterior communicating artery (). After one side of the internal-carotid-artery angiography was complete, the contralateral cerebral artery could be seen through the anterior communicating artery ().
In terms of comparing the digital substraction angiography (DSA) performance before and after embolization, it showed a decrease in the middle-cerebral-artery branch () and partial-branch occlusion. A 2-h MR examination showed a patchy hyper intensity on the DWI (). Additionally, the animals showed different degrees of neurological dysfunction after waking. One severe embolization showed occlusion of the middle cerebral artery, and its branches were widely reduced. The 2-h MR examination showed a wide range of high signals on both DWI and T2WI. After awoke, this animal’s response was poor and there was severe claudication, unilateral limb weakness, difficulties in moving/walking, and this animal died 18 h after embolization. High signal formation was observed in DWI at 30 min and 60 min after embolization in 8 experimental animals without abnormalities in T2WI. The cerebral-infarction-signal zone (T1WI low signal, T2WI high signal, and DWI high signal) could be seen at 24 h. Cerebral infarction areas were displayed at 1 week, 2 weeks, 3 weeks, and 4 weeks after embolization. The ADC values in the central and marginal areas of the infarct were significantly reduced at 30 min and 1 h after embolization and decreased to a minimum at 24 h, followed by a subsequent gradual increase. The ADC value in the central region was significantly higher than that in the marginal region. At 1 week, the ADC value of the infarct area was close to the normal ADC value on the opposite side ().
Table 2. ADC value at different times after embolization (unit ×10−4 mm2/s) and DWI signal (b = 1000)
Embolization significantly increased systolic blood pressure
The physiological indicators included blood pressure, heart rate, body temperature, and arterial blood gas analysis. The systolic blood pressure of control group and treatment group after embolization was significantly higher than that before embolization (p < 0.05). There was no significant difference in other physiological indexes between control group and treatment group (p > 0.05) ().
Table 3. Physiological-indicator monitoring
Leptin reduced the area of cerebral infarction
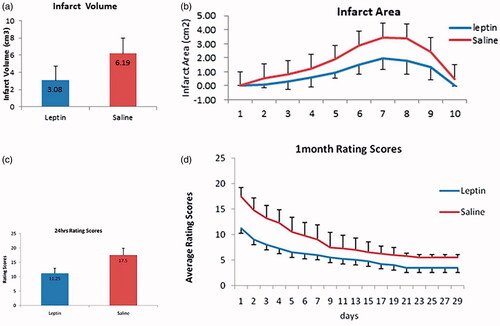
Before and after embolization, DSA showed partial branch embolization of the middle cerebral artery. After embolization, the blood flow of the middle cerebral artery slowed down, and the contrast agent flowed back to the anterior cerebral artery to develop it (). DWI can show an infarct range 60 min after embolization and an infarct range can be seen in both DWI and T2WI 24 h after embolization. 24 h after embolization, the infarct ranges observed by TTC and MRI were consistent (). TTC staining showed that the infarct volume in treatment group was significantly reduced compared with that of control group (). The total infarct volume was 6.19 cm3 in control group and 3.08 cm3 in treatment group with a statistically significant difference between the two groups (p < 0.05, t = 9.783) (). The infarct volume of each layer was also smaller in treatment group compared to that in control group (). HE staining showed that the boundary of the infarct area was clear in the brain parenchyma (, HEX100). There were liquefaction and necrosis of brain tissue in the infarct area (, HEX200). High magnification showed cell necrosis in the infarct area, such as mesh, nuclear fragmentation, and dissolution (, HEX400). Immunohistochemistry analysis showed the expression of Bcl-2 (), Bax (), and caspase-3 () in the infarct-border zone.
Figure 2. Angiography analysis of the embolization of the middle cerebral artery. (a) Posterior-anterior angiography showing middle cerebral artery and branches before embolization (thick black arrow). (b) Posterior-anterior angiography showing partial disruption of the middle cerebral artery after embolization (thin balck arrow). Partial contrast agent reflux leads to anterior cerebral artery could be seen (white arrow). (c) Lateral film angiography showing middle cerebral artery and branches before embolization (thick black arrow). (d) Lateral film angiography showing partial disruption of the middle cerebral artery after embolization (thin balck arrow). Partial contrast agent reflux leads to anterior cerebral artery could be seen (white arrow). (e) DWI show an infarct range 60 min after embolization (white arrow). (f) DWI show an infarct range 24 h after embolization (white arrow). (g) T2WI show an infarct range 24 h after embolization (white arrow). (h) TTC show an infarct range 24 h after embolization (white arrow). (i) TTC staining showed that the infarct volume in the control group. (g) TTC staining showed that the infarct volume in the treatment group. (k) The boundary of the infarct area was clear in the brain parenchyma. (l) There were liquefaction and necrosis of brain tissue in the infarct area. (m) High magnification showed cell necrosis in the infarct area, such as mesh, nuclear fragmentation, and dissolution. (n) Cells in the infarct-border zone expressed Bcl-2. (o) Cells in the infarct-border zone expressed Bax. (p) Cells in the infarct-border zone expressed caspase-3.
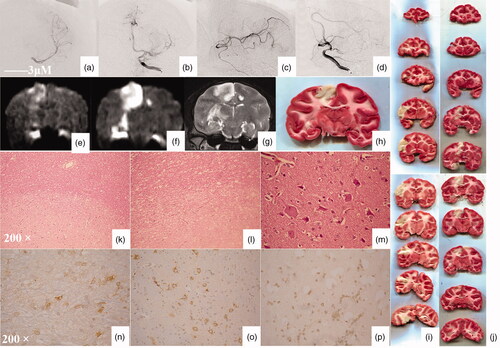
Figure 3. Infarct volume measurement. (a) The infarct volume, p < 0.05 compared with PBS group. (b) The infarct volume of each layer, p < 0.05 compared with PBS group. (c) 24 h Rating scores. p < 0.05 compared with PBS group. (d) 1-month Rating scores. p < 0.05 compared with PBS group.
Leptin increased the Bcl-2 expression and decreased the levels of Bax and caspase 3
There was no significant difference in Bax protein expression in the infarct-core zone between leptin group and PBS group (p > 0.05). The Bax protein expression in leptin group was significantly lower than that of PBS group (p < 0.05). The Bax protein expression in infarct-margin zone and ipsilateral normal-brain tissue of operation group was significantly higher than that of the sham-operation group (p < 0.05) (). There was no significant difference in Bcl-2 protein expression in the infarct-core zone or ipsilateral normal-brain tissue between leptin group and PBS group (p > 0.05). The Bcl-2 protein expression in leptin group was significantly higher than that in PBS group (p < 0.05). The Bcl-2 protein expression in the infarct-margin zone of operation group was significantly higher than that of sham-operation group (p < 0.05) (). There was no significant difference in the caspase-3 protein expression of the infarct zone between leptin group and PBS group (p > 0.05). The caspase-3 protein expression in infarct-margin zone in operation group was significantly higher than that in sham-operation group (p < 0.05) ().
Figure 4. The expression of Bax and Bcl-2 protein and mRNA. (a) The expression of Bax compared with that of the PBS group (p < 0.05). These are representative data from three independent experiments. (b) The expression of Bcl-2 compared with that of the PBS group (p < 0.05). These are representative data from three independent experiments. (c) The expression of caspase-3 compared with that of the PBS group (p < 0.05). These are representative data from three independent experiments. *The difference was statistically significant. (d) RT-PCR test results. (e) Bax mRNA expression. *The difference was statistically significant. (f) Bcl-2 mRNA expression. *The difference was statistically significant. (g) caspase3 mRNA expression. *The difference was statistically significant.
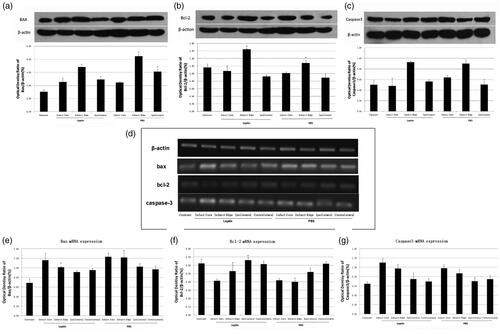
RT-PCR () showed that there was no significant difference in the Bax mRNA expression in the infarct-core zone, or ipsilateral and contralateral normal brain tissue between leptin group and PBS group (p > 0.05). The Bax mRNA expression of the infarct-margin zone in leptin group was significantly lower than that in PBS group (p < 0.05). The Bax mRNA expression of operation group was significantly higher than that of sham-operation group (p < 0.05) (). There was no significant difference in Bcl-2 mRNA expression of infarct-core zone and contralateral normal brain between leptin group and PBS group (p > 0.05). The Bcl-2 mRNA expression of infarct marginal zone and ipsilateral brain tissue in leptin group was significantly higher than that in PBS group (p < 0.05). The Bcl-2 mRNA expression of the operation group was significantly higher than that of the sham-operation group (p < 0.05) (). There was no significant difference in caspase-3 mRNA expression between Leptin group and PBS group (p > 0.05). The caspase-3 mRNA expression in the infarct-core area zone and marginal area was significantly higher than that in normal brain tissue and normal control group (p < 0.05) ().
Postoperative behavioral-performance score
The scores of behavioral defects at 24 h after surgery were significantly higher in the PBS group compared to those in treatment group (p < 0.05, ). The scores of 29-day behavioral defects were observed continuously, and the scores of the control group were significantly higher than those of the treatment group (p < 0.05, ).
Discussion
The International Cerebrovascular Disease Committee (ICDC) strongly advocates that the study of cerebral ischemia should be based on a model of regional cerebral ischemia.Citation4 Rodent models are widely used for establishing the cerebral ischemia model, but the brains of rodents are significantly different from those of humans. Non-human primates are evolutionarily more similar to humans. Therefore, we used macaque monkeys as experimental animals and found that the experiment procedures induced less trauma to animals and circumvented bleeding, infection, and postoperative-care problems caused by surgery. A total of 13 experimental animals had a success rate of 100% intubation and a fluoroscopy time (catheter operation) of 1.5-10 min, with an average of 4.7 min. None of the experimental animals died due to intubation. Moreover, the operation process was consistent with human cerebrovascular interventional therapy, and cerebrovascular interventional devices can be selected without using special equipment.
Embolization of the middle cerebral artery of monkeys can lead to acute cerebral ischemia. For the detection of acute cerebral ischemia or infarction, CT perfusion and magnetic resonance DWI are generally considered to be sufficiently sensitive.Citation11,Citation12 In the present study, MR was selected as a method for detecting cerebral ischemia. For acute cerebral infarction with MRI, DWI is generally considered to be important for the detection of hyperacute cerebral infarction. DWI is more sensitive to cerebral infarction than conventional T2WI.Citation13 In this group of experiments, all monkeys with middle-cerebral-artery embolization showed a cerebral-infarction signal on DWI after 2 h of embolization. One of the severely embolized monkeys showed abnormal signals on T2WI after 2 h of embolization, and the other 12 monkeys showed abnormal signals on T2WI after 24 h of embolization, indicating that the establishment of a primate model of transfemoral - artery micro catheter - superselective middle - cerebral - arteryth romboembolism has the advantages of accuracy, stability, minimal trauma, good reproducibility, and low mortality.
Leptin is a multifunctional hormone produced by the obesity (OB) gene and is secreted by adipocytes that regulate food intake and energy metabolism. Leptin is highly hydrophilic and mainly cleared by kidney.Citation12,Citation14 It is currently believed that leptin is closely related to cerebral ischemia. Studies on ischemia and hypoxia in nerve cells have shown that the protective effect of leptin is through activating second-messenger pathways of neuronsCitation5,Citation6 and Leptin has protective effects on energy-deficient neurons.Citation15,Citation16 Research by Si et al.Citation6 showed that leptin is involved in the repair of ischemia and hypoxic injury in glial cells. Leptin maintains neuroprotective effects by increasing the tolerance and survival of glial cells against ischemia and hypoxia and inhibiting glial apoptosis. It has also been reported that leptin can regulate the activity of astrocyte gap-junction linker Cx43 by reducing Cx43 expression, and the gap junction of glial cells, blocking signal transmission, reducing cell damage in the penumbra, and thereby ameliorating the degree of cerebral infarction.Citation3,Citation17
Apoptosis is an important evolutionary process of neuronal cell death after cerebral ischemia. After focal cerebral ischemia, a penumbra is formed and cells gradually undergo apoptosis.Citation18,Citation19 Leptin has obvious anti-apoptotic effects, which may act through activation of Janus kinase signal transducer and activator of transcription (JAK2-STAT3), mitogen extracellular signal regulated kinases/extracellular regulated protein kinases (MEK/ERK), and phosphoinositide 3-kinase/serine threonine kinase (PI3-K/AKT) signaling pathways, which can up-regulate Bcl-2 and down-regulate Bax and caspase-3, thereby reducing neuronal apoptosis and improving the prognosis of stroke.Citation13,Citation20,Citation21 Studies have shown that the protective effect of leptin on neuronal ischemia is mainly through ERK 1/2 signaling pathway and that cAMP and STAT3 signaling pathways also play a role i. Additionally, the neuroprotective effects of leptin are dose- and time-dependent and can still exert effects 90 min after cerebral ischemia.Citation22
In order to explore the anti-apoptotic mechanism in cerebral ischemia-reperfusion injury, the expression levels of apoptosis related genes Bax, Bcl-2 and Caspase3 were detected under the intervention of leptin. The mechanism of Bcl-2 is mainly through the formation of heterodimer on the mitochondrial membrane to inhibit the process of apoptosis.Citation23 On the other hand, through the down-regulation of cytochrome c, the downstream caspase pathway is not activated to protect cells and inhibit their apoptosis.Citation24 Bax inhibits mitochondrial synthesis and destroys its structure and function by interacting with other apoptotic proteins. A variety of Pro apoptotic factors can interact with each other, oligomerize to form homologous oligomers, form cytochrome c channels on the membrane, and release a large amount of cytochrome c to destroy the structure and function of mitochondrial membrane, thus inducing apoptosis. Our results showed that in leptin group, the Bax expression was significantly lower than that in PBS group, and the Bcl-2 expression was significantly higher than that in PBS group. The caspase 3 expression was higher in leptin group than that in normal brain tissue. The results of immunohistochemistry were consistent with the mRNA expression level, suggesting that leptin can inhibit the apoptotic response induced by cerebral ischemic injury and promote the survival of neural cells by inhibiting the expression levels of Bax and Caspase3 and inducing the expression of Bcl-2.
The results of this study are similar to those in the rat model.Citation5,Citation25,Citation26 These results indicate that the anti-apoptotic mechanism of leptin in cerebral ischemia-reperfusion injury is similar in rodent and non-human primate models. In addition, the results of this study showed that the most significant difference of apoptosis related genes between leptin group and PBS group was in the infarct border area, suggesting that leptin mainly regulates apoptosis related genes in the ischemic penumbra area. This is related to the different forms of neuronal death after cerebral ischemia. There are mainly two forms of neuronal death: necrosis and apoptosis. It is generally believed that necrosis is an irreversible lesion in the acute stage, and apoptosis is a delayed reaction, which is reversible under certain conditions. During the process of cerebral ischemia, the cells in the ischemic center rapidly necrosis, while the cells in the ischemic penumbra mainly apoptosis, which is a delayed reaction Jing Yuan died. Therefore, a large number of studies believe that apoptosis may determine the final infarct volume of ischemic brain tissue, and the intervention of apoptosis is the key to reduce the degree of ischemia-reperfusion injury and improve the prognosis of stroke.Citation27–29
However, the role of leptin in cerebral ischemia models of advanced animals, especially primates, has not been reported. The results of our present study showed that intraperitoneal administration of leptin after 30 min of cerebral ischemia could reduce the volume of cerebral infarction by about 35% and behavioral defects can be significantly improved 24 h after surgery. In addition, 30 days of continuous observation showed that mid- and long-term behavioral deficiencies have been significantly improved. It is thus shown that leptin has obvious neuroprotective effects in the treatment of cerebral ischemia of primate animals, which can effectively reduce the volume of cerebral infarction. Due to the close relationship between primates and humans, drug trials based on this animal model will provide guidance for new drug discovery, which is more conducive to preclinical screening and testing of various drugs.
In conclusion, leptin has neuroprotective effects on cerebral ischemia and can effectively reduce the volume of cerebral infarction.
Ethical approval
This study was approved by the animal ethnic committee of Affiliated Hospital of Guilin Medical University.
Author contribution
Ge Cheng, Zhipeng Zhou was the guarantor of integrity of the entire study and contributed to manuscript preparation and editing; Zhipeng Zhou contributed to study concepts, study design, definition of intellectual content and help with manuscript review; Ge Cheng, Xianfeng Wan, Xiaotian Li contributed to literature research; Ge Cheng,Yanxian Deng, Zhipeng Zhou, JunXiong Yu, Huiyang Zhang, Xianfeng Wan, Xiaotian Li contributed to clinical studies and experimental studies; Ge Cheng, Xianfeng Wan, Xiaotian Li contributed to data acquisition and analysis, statistical analysis
Supplemental Material
Download TIFF Image (356.7 KB)Acknowledgments
We thank LetPub (www.letpub.com) for its linguistic assistance during the preparation of this manuscript.
Disclosure statement
The authors declare that there is no conflict of interest.
Additional information
Funding
Related Research Data
References
- Choi BR, Kim DH, Back DB, et al. Characterization of white matter injury in a rat model of chronic cerebral hypoperfusion. Stroke. 2016;47(2):542–547.
- Pu Y. Comparison of different types of endovascular mechanical embolectomy in acute ischemic stroke. Rev Assoc Med Bras. 2019;65(3):342–347.
- Deng ZH, Liao J, Zhang JY, et al. Inhibition of the connexin 43 elevation may be involved in the neuroprotective activity of leptin against brain ischemic injury. Cell Mol Neurobiol. 2014;34(6):871–879.
- Avraham Y, Dayan M, Lassri V, et al. Delayed leptin administration after stroke induces neurogenesis and angiogenesis. J Neurosci Res. 2013;91(2):187–195.
- Zhang JY, Deng ZH, Liao J, et al. Leptin attenuates cerebral ischemia injury through the promotion of energy metabolism via the PI3K/Akt pathway. J Cereb Blood Flow Metab. 2013;33(4):567–574.
- Zhang WF, Jin YC, Li XM, Yang Z, Wang D, Cui JJ. Protective effects of leptin against cerebral ischemia/reperfusion injury. Exp Ther Med. 2019;17(5):3282–3290.
- Li M, Zhou Z-P, Sun M, et al. Reduced nicotinamide adenine dinucleotide phosphate, a pentose phosphate pathway produce, might be a novel drug candidate for ischemic stroke. Stroke. 2016;47(1):187–195.
- Longa EZ, Weinstein PR, Carlson S, et al. Reversible middle cerebral artery occlusion without craniotomy in rats. Stroke. 1989;20(1):84–91.
- Zhao B, Shang GW, Chen J, et al. A more consistent intraluminal rhesus monkey model of ischemic stroke. Neural Regener Res. 2014;9(23):2087–2094.
- Sasaki M, Honmou O, Radtke C, Kocsis JD. Development of a middle cerebral artery occlusion model in the nonhuman primate and a safety study of i.v. infusion of human mesenchymal stem cells. PLoS One. 2011;6(10):e26577.
- Roitberg B, Khan N, Tuccar E, et al. Chronic ischemic stroke model in cynomolgus monkeys: behavioral, neuroimaging and anatomical study. Neurol Res. 2003;25(1):68–78.
- Tavil B, Balta G, Ergun EL, et al. Leptin promoter G-2548A genotypes and associated serum leptin levels in childhood acute leukemia at diagnosis and under high-dose steroid therapy. Leuk Lymphoma. 2012;53(4):648–653.
- Zhang JY, Si YL, Liao J, Yan GT, et al. Leptin administration alleviates ischemic brain injury in mice by reducing oxidative stress and subsequent neuronal apoptosis. J Trauma Acute Care Surg. 2012;72(4):982–991.
- Abdu Allah AM, El-Hefnway SM, Alhanafy AM, Zahran AM, Kasem HE. Leptin receptor gene (A/G) polymorphism rs1137101 and renal cell carcinoma. Mol Cell Biochem. 2018;448(1–2):137–144.
- Paz G, Wong ML, Licinio J. The procognitive effects of leptin in the brain and their clinical implications. Int J Clin Pract. 2010;64(13):1808–1812.
- Morrison CD. Leptin signaling in brain: a link between nutrition and cognition? Biochim Biophys Acta. 2009;1792(5):401–408.
- Wu QY, Zhang JY, Deng ZH, Yan GT. [The effect of leptin on Cx43 expression in protecting mice cerebral ischemia/reperfusion injury. Sichuan Da Xue Xue Bao Yi Xue Ban. 2012;43(3):314–318.
- Venketasubramanian N, Chan BPL, Chang HM, et al. Brain attack: needing resuscitation. Singapore Med J. 2011;52(8):620–630.
- Lapi D, Vagnani S, Sapio D, et al. Long-term remodeling of rat pial microcirculation after transient middle cerebral artery occlusion and reperfusion. J Vasc Res. 2013;50(4):332–345.
- Macrea MM, Misra H, Zagrean L. The neuroprotective effect of intranasally applied leptin against hypoxic neuronal injury. Med Hypotheses. 2010;74(6):1036–1037.
- Amantea D, Tassorelli C, Russo R, et al. Neuroprotection by leptin in a rat model of permanent cerebral ischemia: effects on STAT3 phosphorylation in discrete cells of the brain. Cell Death Dis. 2011;2(12):e238.
- Zhang F, Wang SP, Signore AP, Chen J. Neuroprotective effects of leptin against ischemic injury induced by oxygen-glucose deprivation and transient cerebral ischemia. Stroke. 2007;38(8):2329–2336.
- Hirata H, Lopes GS, Jurkiewicz A, et al. Bcl-2 modulates endoplasmic reticulum and mitochondrial calcium stores in PC12 cells. Neurochem Res. 2012;37(2):238–243.
- Kumari A, Kakkar P. Lupeol prevents acetaminophen-induced in vivo hepatotoxicity by altering the Bax/Bcl-2 and oxidative stress-mediated mitochondrial signaling cascade. Life Sci. 2012;90(15–16):561–570.
- Yiling S, Jinying Z, Zihui D, et al. Effect of leptin on neuronal apoptosis in mice with cerebral ischemia/reperfusion injury. Chin J Appl Physiol. 2016;32 (4):305–309.
- Sawe N, Steinberg G, Zhao H. Dual roles of the MAPK/ERK1/2 cell signaling pathway after stroke. J Neurosci Res. 2008;86(8):1659–1669.
- Marzban H, Del Bigio MR, Alizadeh J, et al. Cellular commitment in the developing cerebellum. J Neurosci. 2015;35(9):3794–3805.
- Mattson MP, Culmsee C, Yu ZF. Apoptotic and anti-apoptotic mechanisms in stroke. Cell Tissue Res. 2000;301(1):173–187.
- Kaur C, Ling EA. Antioxidants and neuroprotection in the adult and developing central nervous system. Curr Med Chem. 2008;15(29):3068–3080.