
Abstract
In this study, we examined the effects of Heat Shock Protein 90 (HSP90) on adipocyte proliferation and differentiation in chickens. To achieve this, we constructed RNA interference (RNAi) vectors to target HSP90 and transfected the vectors into primary adipocytes. After transfection, oil red O staining was performed to determine the status of triglyceride accumulation in the cells, whereas the CCK-8 cell kit and 5-Ethynyl-2'-Deoxyuridine (EdU) assays were used to determine cell proliferation. Thereafter, the mRNA and protein expression levels of PPARγ, FAS, SREBP-1c, and HSP90 were determined, and the results showed that after the interference of HSP90, the mRNA and protein expression levels of HSP90 in the chicken adipocytes decreased significantly compared to the control and blank groups (p < 0.05). The decreased mRNA and protein expression of PPARγ, FAS, and SREBP-1c was related to adipocyte differentiation (p < 0.05). However, HSP90 interference had no effect on adipocyte proliferation (p > 0.05). Taken together, the results of this study showed that HSP90 influenced the expression of PPARγ and adipose-differentiation-related genes, thereby regulating triglyceride accumulation and adipocyte differentiation in chickens.
Introduction
Cells under stress due to environmental changes, require a specific class of proteins to maintain homeostasis. Heat Shock Proteins (HSPs) maintain cellular homeostasis and proteostasis during stress conditions. HSPs have molecular chaperone activity to assist proteins in folding to prevent stress-induced misfolding and aggregation and participate in immune resistance, cell apoptosis, and cell repair.Citation1–3 HSPs are highly conserved during the evolutionary process, indicating their importance in physiological functions.Citation4 Heat shock protein 90 kDa (HSP90) is one of the most abundant heat shock proteins, and is a characteristic molecular chaperone that binds various downstream proteins.Citation5 Studies have reported that HSP90 play inhibitory role in cancer cells,Citation6,Citation7 as well as participate in lipid metabolism. An in vivo study showed a reduction in subcutaneous fat accumulation with decreased HSP90 expression in ruminants fed low protein diet.Citation8 Another study reported the regulatory role of HSP90 in mammalian body fat production.Citation9 HSP90 binding peroxisome proliferator activated receptor (PPAR) protein complex is involved in many biological functions, including reducing misfolding of peroxisome proliferator activated receptor gamma (PPARγ) protein, stabilizing PPARγ protein structure to regulate the expression of PPARγ protein and AKT, controlling downstream genes, and promoting adipocyte differentiation and activity.Citation10 Sterol Regulatory Element Binding Protein (SREBP-1c) is a decisive factor in the fat formation process is highly expressed in adipocytes, and has comprehensive functions in multiple stages of fat development. It was found to activate Fatty Acid Synthase (FAS) synthesis and bind HSP90 in mouse liver cells.Citation11
Studies have further indicated that HSP90 plays an active role in adipocyte proliferation and differentiation in mammals.Citation12 In mouse 3T3L-1 preadipocytes added with HSP90 inhibitors were found to have similar cell cycle compared with those that were subjected to growth arrest,Citation13 inhibited adipocyte differentiation except for proliferation activity, whereas the activity of PPARγ is reduced. HSP90, a molecular chaperone of PPARγ, regulates the activity of PPARγ and adipocyte differentiation.Citation14 A study on ground squirrels, a hibernating animal, indicated that at its initial dormancy, the expression of the HSP90 gene in brown adipose tissue is higher than that in deep dormancy.Citation10 This indicated that HSP90 is closely related to lipid metabolism.
Broilers tend to deposit a large amount of abdominal fat and subcutaneous fat at the grower stage, whereas chicken consumers prefer low lipid intake and chicken breeders aim to promote feed conversion efficiency. There are complex mechanisms for lipid metabolism in chickens. Based on previous studies, we hypothesized that HSP90 participates in preadipocyte maturation in chickens. We interfered with the HSP90 gene in chicken preadipocytes, observed cell morphological changes and proliferation status after oleic acid induction, and determined the expression levels of fat-related genes and proteins to explore the function of HSP90 in chickens.
Materials and methods
Sample collection procedures were approved by the Institutional Animal Care and Use Committee of Sichuan Agricultural University, with the permission number DKY-S20123129.
Experiment design and animal management
Two hundred eggs of Daheng chickens (a meat-type chicken from Sichuan Daheng Poultry Breeding Co., Ltd., China) were incubated at the Poultry Breeding Farm of Sichuan Agricultural University. On day 5 and 18, the survivability of the cells was determined. On day 5 of the embryonic developmental period, with the help of torchlight, healthy embryos showed black eye spots and blood vessels. However, on day 18 of embryonic development, large visible blood vessels were observed. After hatching, sex of each chicken was determined. The anus was then pushed aside. Males have a reproductive protrusion on the edge of the cloaca, whereas females have no reproductive protrusion. Healthy female chicks were randomly selected and divided into 4 groups of 20 chickens per group using a completely randomized design (CRD). The animals were vaccinated with Avian Influenza H5 on day 13, and were granted free access to feed and water ad libitum during the entire experimental period.
Culture and differentiation of preadipocytes
We adopted 12-day-old chicks and took their abdominal adipose tissue under aseptic conditions. Primary preadipocytes were obtained following the procedures described by Song et al., 2020Citation15 and inoculated into cell culture plates according to the appropriate density for subculture. After 24 h of cell inoculation, heterozygous cells were moved out with the culture medium change, and the culturing process was continued in a CO2 incubator at 37 °C with 5% concentration. When the confluence of primary preadipocytes reached 70% after subculture, the medium was replaced with oleic acid induction medium (300 μm) to induce cell differentiation, and cells were collected at the time point 0, 24, 48, and 72 h after induction, respectively. RT-PCR was used to detect the expression levels of HSP90 and to determine the optimal interference time point.
Plasmid extraction, transfection, and construction
RNA interference (RNAi) vectors were synthesized by Sangon Bioengineering Co., Ltd based on the HSP90 gene (Gene ID 396188). Pairs of siRNA sequences (HSP90-chicken-419) and negative control sequences (pENTR/U6/GFP) were used for transfection (). Furthermore, cells were divided into three groups: the interference (HSP90-siRNA, siRNA) group, control (Negative control, NC) group, and blank (Non-transfected, Non) group. Each group consisted of three replicates.
Table 1. The primer sequences of siRNA.
Extraction and content determination of total cell protein
Total protein was extracted according to the instructions of the Techniques in Cell and Molecular Biology.Citation15 Firstly, the cells were rinsed at 0, 24, 48, and 72 h after being transfected with PBS (pre-cooled) three times to remove residual media, and then 110 µL RIPA Lysis Buffer cell lysate (pre-cooled, containing protease and phosphatase) was added, placed on ice for 10 min, centrifuged at 12000 g/min, and then kept at 4 °C for 20 min. The supernatant was aspirated into a 1.5 mL EP tube, and stored at −80 °C. The levels of HSP90, PPARγ, SREBP-1c, and FAS were determined from the total protein using enzyme-linked immunosorbent assay (ELISA) according to the manufacturer’s instructions (Jiangsu Baolai Biotechnology Co., Ltd, China). Finally, the concentration of the standard substance was taken as the x-coordinate and the OD as the y-coordinate to calculate the concentration of the sample.
Cell differentiation and proliferation detection
Cellular differentiation was analyzed using the oil red O method. The status of cell differentiation was compared and analyzed every 12 h after transfection among the interference, control, and blank groups (four replicates each). We used the CCK-8 (Jrdun Biotechnology, Co., Ltd, Shanghai, China) kit and the 5-Ethynyl-2′-Deoxyuridine (EdU) assay kit (RiboBio, Guangzhou, China) to detect cell proliferation. For the CCK-8 assay, cells were seeded in a 96-hole plate, induced, and transfected. Proliferation of the interference, control, and blank groups was determined every 12 h after transfection at the beginning of oleic acid induction. Six repetitions were performed in each group at each time point. The CCK-8 assay was performed as described in our previous study.Citation16 For the EdU assay, the proliferation state of preadipocytes was determined using an EdU kit according to the manufacturer's instructions. The number of EdU-positive cells was counted under a fluorescence microscope (Nikon Eclipse E100, Japan).
Total RNA extraction and qRT-PCR
Total RNA was extracted using RNAiso Plus (Baobio Engineering Co., Ltd, Dalian, China). The quality of RNA was analyzed by 1.5% agarose gel electrophoresis. Thereafter, the purity and concentration of the RNA were determined using a nucleic acid protein spectrophotometer (IMPLEN), and subsequently reverse transcribed into cDNA with PrimeScript® RTase (Baobio Engineering Co., Ltd, Dalian, China). PCR primers for HSP90, PPARγ, SREBP-1c, FAS, and glyceraldehyde-3-phosphate dehydrogenase(GAPDH) genes were designed using primer premier 5 () and synthesized by Sangon Bioengineering Co., Ltd. Then qRT-PCR amplification reactions were performed under to the following conditions: 95 °C for 5 min, (95 °C, 10 s; certain annealing temperature, 15 s; 72 °C, 20 s) × 40 cycles, 95 °C for 10 s, 65 °C for 5 s, and 95 °C for 5 s. Relative gene expression levels were calculated using CFX96 according to the formula 2^-ΔΔCt. The relative abundance of each transcript was normalized to that of GAPDH (an internal reference gene).
Table 2. Primer sequences for PCR.
Statistical analysis
Statistical significance among groups was evaluated using Tukey’s HSD Test with JMP 13 (SAS Institute Inc., USA). Differences were considered statistically significant at p < 0.05. Data are represented as the mean ± standard error of the mean. GraphPad Prism 6 software (GraphPad Software, USA) was used to generate the Graphs. We found that PPARγ expression data after being disturbed by siRNA did not fit a normal distribution, thus, we transformed them into common logarithms before ANOVA analysis.
Results
Identification of preadipocytes
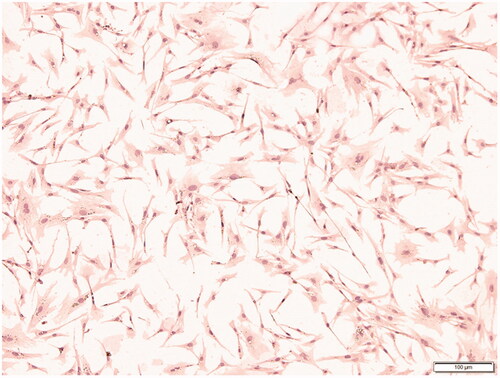
To confirm that the collected primary cells were preadipocytes, the marker protein CD44 was used for immunohistochemical identification. The results are shown in . It can be seen from the figure that the cell morphology is spindle-shape, hematoxylin dyes the nucleus purple, and the cytoplasm presents different shades of brown, indicating that the CD44 protein is positively expressed, and the cells obtained in the test are pre-adipocytes.
Figure 1. Immunohistochemistry of CD44 protein in preadipocytes (100×).
Preadipocytes differentiation and HSP90 expression
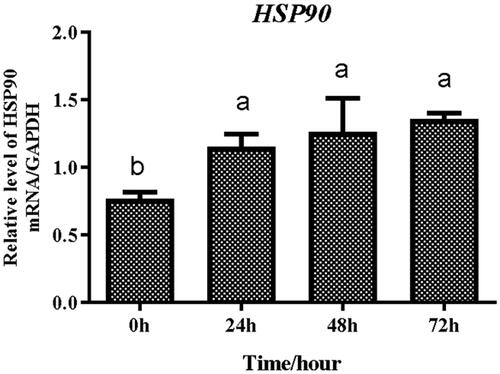
In this study, we found that with an increase in culture time, the cells proliferated and grew rapidly. When most cells shaped as long fusiform and their confluence was approximately 80% (), they were cultured in oleic acid induction medium, and the cells started to differentiate and small fat droplets were observed in the cytoplasm (). Following cell differentiation, small lipid droplets gradually merged into large ones, indicating that preadipocytes became mature adipocytes (). All lipid droplets appeared orange-red after staining with oil red O. The cells were collected at 0, 24, 48, and 72 h after induction by oleic acid, among which the gene expression levels of HSP90 at 24 h was significantly higher than that at 0 h. Thus, we selected 24 h as the transfection time point ( and ).
Figure 2. The morphological characteristics of primary chicken adipocytes (10×). (A) The confluence of the pre-adipocytes is about 80%. (B) Cells began to differentiate with lots of small lipid droplets. (C) At the end of cell differentiation, large lipid droplets appeared.
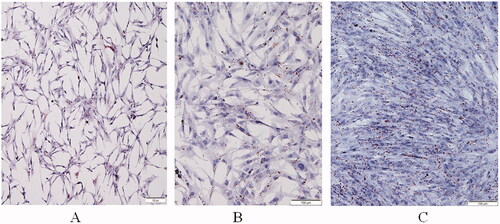
Figure 3. Expression abundances of HSP90 gene during differentiation of preadipocytes. Different lowercases indicated that means differed significantly (p < 0.05).
Transfection of adipocytes with HSP90 siRNA
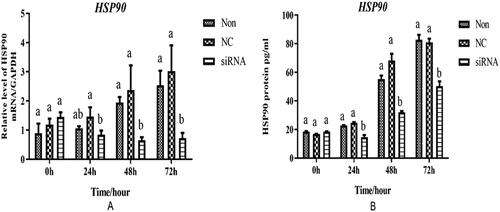
The expression fbundances of HSP90 in the cells were detected using qRT-PCR, and their protein levels were determined using ELISA kits. The quantitative results indicated that HSP90-siRNA significantly decreased the expression of HSP90 in adipocytes (). The expression of HSP90 in the interference group at 24, 48 and 72 h after transfection was significantly lower than that in the Control group (p < 0.05). The ELISA results showed that the protein level of HSP90 in the interference group was significantly lower than that in the control group at 24, 48, and 72 h after transfection (p < 0.05) (). There were no significant differences between the control and blank groups (p < 0.05).
Figure 4. mRNA and protein expression levels of HSP90 in the transfected adipocytes. (A) The mRNA expressions of HSP90 in the adipocytes at 0, 24, 48, and 72h after transfection. (B) The protein level of in the chicken adipocytes at 0, 24, 48, and 72 h after transfection. Non, NC, and siRNA mean non-transfected, negative-control, and HSP90-siRNA, respectively. Different lowercases indicated that means differed significantly (p< 0.05).
Adipocyte differentiation and proliferation after transfection by HSP90 siRNA
CCK8 kits were used to detect the proliferation of chicken adipocytes after transfection with HSP90. We observed that the trends in the blank, control, and interference groups were similar in . No significant differences were observed among the groups (p > 0.05). In addition, the results obtained for 5-Ethynyl-2′-deoxyuridine (EdU)‐staining positive cell rate indicated that there were no significant differences among the groups after HSP90 gene interference (). Moreover, the triglyceride (TG) content of the adipocytes after interference was determined by oil red O staining extraction colorimetry (). The TG content in the interference group was maintained at a low level throughout the experiment, and was significantly lower than that in the blank and control groups from 24 to 72 h (p < 0.05). The orange lipid droplets in the interference group were obviously less than that in the blank and control groups during the entire period ().
Figure 5. Lipid accumulation in chicken adipocyte transfected with HSP90 siRNA. (A) Adipocytes proliferation after HSP90-siRNA transfection was measured via the quantification at A450 with CCK-8. (B) 5-Ethynyl-2'-Deoxyuridine (EdU) assays for adipocytes with HSP90-siRNA transfection after 48 h. Column and bar represent mean ± standard error mean for each group. (C) Content of the triglyceride of the adipocytes transfected with HSP90-siRNA via quantification at A500 after isopropyl alcohol destained oil red O.
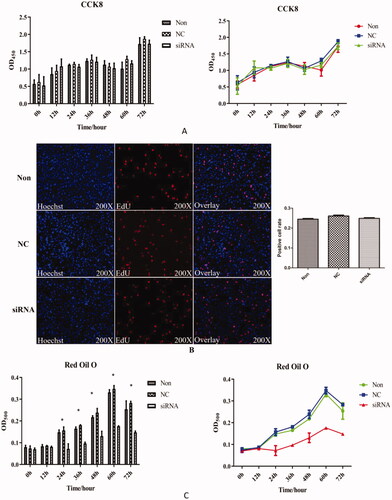
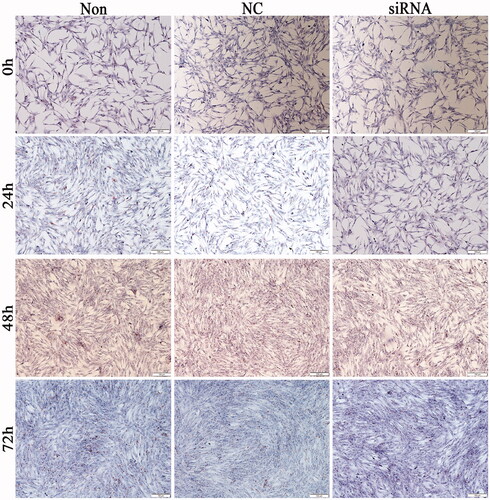
Figure 6. Morphology and lipid aggregation of chicken adipocytes after HSP90-siRNA (10×) transfection. siRNA, NC, and Non represent the HSP90-siRNA (siRNA), negative control (NC), and non-transfected (Non) groups, respectively.
Gene expression of adipogenesis-related genes
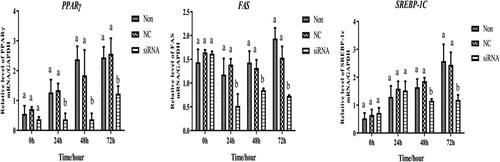
PPARγ expression in the blank and control groups increased over time (). However, its expression was significantly lower in the interference group than in the control and blank groups at 24, 48, and 72 h (p < 0.05), respectively. A similar trend was observed in the expression of FAS after 24 h of interference, whereas the expression in the interference group was significantly lower than that in the control and blank groups (p < 0.05). Interestingly, at 48 and 72 h, the expression of SREBP-1c in the interference group was significantly lower than that in the control and blank groups (p < 0.05).
Figure 7. Expression abundance of adipocytes differentiation-related genes after transfection with HSP90-siRNA. siRNA, NC, and Non represent the HSP90-siRNA (siRNA), negative control (NC), and non-transfected (Non) groups, respectively. Different lowercase indicated that means differed significantly (p < 0.05).
Expression abundances of adipogenesis-related protein
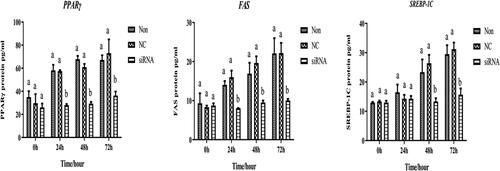
The expression levels of PPARγ, FAS, and SREBP-1c were increased in both the control and blank groups, whereas, the protein level of PPARγ in the interference group was significantly lower than that in the control and blank groups at 24, 48 and 72 h (p < 0.05, ). Moreover, FAS protein expression levels remained low in the interference group over time. The expression of SREBP-1c in the interference group was significantly lower than that in the control and blank groups at 48 and 72 h (p < 0.05), respectively.
Figure 8. Levels of expression of adipocytes differentiation-related protein after transfection with HSP90-siRNA. siRNA, NC, and Non represent the HSP90-siRNA (siRNA), negative control (NC), and non-transfected (Non) groups, respectively. Different lowercase indicated that means differed significantly (p < 0.05).
Discussion
Regulatory transcription factors such as PPARs, SREBP-1c, and IGF-1 are involved in preadipocyte differentiation. Studies have indicated that at the beginning of cell differentiation, the expression of PPARγ increases rapidly, and its regulation of cell differentiation is accomplished by the expression of downstream genes.Citation17,Citation18 In the present study, small lipid droplets were observed during the early stages of preadipocyte development in chickens. It was also observed in this study that during adipocyte differentiation, small lipid droplets increased in size and fused into large lipid droplets. Simultaneously, the mRNA expression levels of PPARγ, FAS, and SREBP-1c also increased, indicating the typical characteristics of adipocyte differentiation. Similar to the expression patterns of PPARγ and SREBP-1, HSP90 expression increased with adipocyte differentiation. Therefore, we deduced that HSP90 plays an important role in chicken preadipocyte differentiation.
As a molecular chaperone, HSP90 is widely found in animal cells, and binds tightly to downstream proteins to protect the integrity of the downstream structure.Citation19 Here, we inhibited the expression of HSP90 in chicken adipocytes and found that adipocyte differentiation was inhibited. However, there were no significant differences in adipocyte proliferation among the NC, Non and siRNA groups, which indicated that the HSP90 had no effect on adipocyte proliferation. Other studies have shown that HSP90 can inhibit the proliferation of cancer cells;Citation20,Citation21 however, in healthy chicken adipocytes, HSP90 lacks this function.
After interference with the HSP90, the mRNA and protein expression levels of fat metabolism-related genes were determined. Compared to the control group, the mRNA and protein expression levels of PPARγ (at 24, 48, and 72 h), FAS (at 24, 48, and 72 h), and SREBP-1c (at 48 and 72 h) decreased significantly in the interference groups. We observed that the mRNA and protein levels of PPARγ and HSP90 showed similar expression trends. Logically, PPARγ can directly bind to HSP90 and is regulated by HSP90. In this study, it was evident that HSP90 affected the mRNA expression of PPARγ and regulated preadipocyte differentiation in chickens.
SREBP-1c is an important determinant factor that play active role in adipogenesis. It is highly expressed in adipocytes and plays key roles in several stages of adipogenesis. The main function of SREBP-1c is to activate FAS synthesis. It is highly expressed in the liver, where rapid synthesis and decomposition of lipids occur.Citation22 Moon et al. reported that SREBP-1c gene knockout affected fat synthesis in the liver of mice.Citation23 Whereas, FAS synthesis and TG content in the liver of mice with SREBP-1c gene knockout significantly decreased to the level of 50% in the control. In mouse hepatocytes, inhibition of HSP90 results in the degradation of SCAP/SREBP proteasome, down-regulation of SREBP target genes, and reduction of intracellular triglyceride and cholesterol levels. In the present study, our results showed that after interference with HSP90, the expression of SREBP-1c was inhibited, hence, we observed a down-regulation of both mRNA and protein expression of SREBP-1c. As a downstream gene of SREBP-1c, FAS also plays an important role as a downstream target of adipocyte differentiation. FAS is involved in catalyzing the synthesis of chain fatty acids with acetyl CoA and reduced coenzyme II which is the substrate and a key enzyme in the synthesis of fatty acids. Therefore, FAS may regulate fatty acid synthesis. There is a strong correlation between FAS activity and abdominal fat deposition in poultry. Studies have indicated that the abdominal fat content of layers from d90 to d470 show a similar increasing trend in FAS activity.Citation24 In this study that down-regulation of HSP90 significantly decreased the expression of FAS.
Conclusion
Taken together, this study showed that after HSP90 siRNA was transfected into chicken adipocytes, a decreased expression of HSP90 was observed which decreased the expression of PPARγ and SREBP-1c. The decrease in the expression of SREBP-1c inhibited the cascades of lipid synthesis related genes, including FAS, which eventually blocked fatty acid synthesis in the cytoplasm of adipocytes. Hence, HSP90 is a candidate gene that affects chicken adipocyte differentiation.
Author contributions
Xincheng Kang: data collection, Methodology, Software. Chenglin Zhong: data collection, Writing-Original Draft. Xiaxia Du: EDU-experiment. Felix Kwame Amevor: Review & Editing. Ali Mujtaba Shah: Review & Editing. Qing Zhu: Review & Editing. Yaofu Tian: Review & Editing. Gang Shu: Animal Management. Yan Wang: Review & Editing. Xiaoling Zhao: Conceptualization and Supervision.
Acknowledgment
The authors thank Taotao Gui, Zhifu Cui, and Liang Li for feeding the experimental animals.
Disclosure statement
No potential conflict of interest was reported by the author(s).
Data availability statement
The data used to support the findings of this study are included within the article.
Additional information
Funding
References
- Kim YE, Hipp MS, Bracher A, et al. Molecular chaperone functions in protein folding and proteostasis. Annu Rev Biochem. 2013;82(1):323–355.
- Saibil HR. Chaperone machines for protein folding, unfolding and disaggregation. Nat Rev Mol Cell Biol. 2013;14(10):630–642.
- Hartl FU, Bracher A, Hayer-Hartl M. Molecular chaperones in protein folding and proteostasis. Nature. 2011;475(7356):324–332.
- Passarino G, Cavalleri GL, Stecconi R, et al. Molecular variation of human HSP90alpha and HSP90beta genes in Caucasians. Hum Mutat. 2003;21(5):554–555.
- Taipale M, Jarosz DF, Lindquist S, et al. HSP90 at the hub of protein homeostasis: emerging mechanistic insights. Nat Rev Mol Cell Biol. 2010;11(7):515–528.
- Zavareh RB, Spangenberg SH, Woods A, et al. HSP90 inhibition enhances cancer immunotherapy by modulating the surface expression of multiple immune checkpoint proteins. Cell Chem Biol. 2021;28(2):158–168.e5.
- Chen X-L, Liu P, Zhu W-L, et al. DCZ5248, a novel dual inhibitor of Hsp90 and autophagy, exerts antitumor activity against colon cancer. Acta Pharmacol Sin. 2021;42(1):132–141.
- Eitam H, Agmon R, Asher A, et al. Protein deprivation attenuates Hsp expression in fat tissue. Cell Stress Chaperones. 2012;17(3):339–347.
- Toneatto J, Charó NL, Galigniana NM, et al. Adipogenesis is under surveillance of Hsp90 and the high molecular weight Immunophilin FKBP51. Adipocyte. 2015;4(4):239–247.
- Rouble AN, Tessier SN, Storey KB. Characterization of adipocyte stress response pathways during hibernation in thirteen-lined ground squirrels. Mol Cell Biochem. 2014;393(1–2):271–282.
- Kuan YC, Hashidume T, Shibata T, et al. Heat shock protein 90 modulates lipid homeostasis by regulating the stability and function of sterol regulatory element-binding protein (SREBP) and SREBP cleavage-activating protein. J Biol Chem. 2017;292(7):3016–3028.
- Li Y, Zhang T, Schwartz SJ, et al. New developments in Hsp90 inhibitors as anti-cancer therapeutics: mechanisms, clinical perspective and more potential. Drug Resist Updat. 2009;12(1–2):17–27.
- He Y, Ying L, Zhang S, et al. Radicicol, a heat shock protein 90 inhibitor, inhibits differentiation and adipogenesis in 3T3-L1 preadipocytes. Biochem Biophys Res Commun. 2013;2(436):169–174.
- Nguyen MT, Csermely P, Sőti C. Hsp90 chaperones PPARγ and regulates differentiation and survival of 3T3-L1 adipocytes. Cell Death Differ. 2013;20(12):1654–1663.
- Song W, Zhong C, Yuan Y, et al. Peroxisome proliferator-activated receptor-coactivator 1-beta (PGC-1beta) modulates the expression of genes involved in adipogenesis during preadipocyte differentiation in chicken. Gene. 2020;741:144516.
- Michels CA. Techniques in Cell and Molecular Biology. John Wiley & Sons, Ltd; 2002.
- Rosen ED, Hsu CH, Wang X, et al. C/EBPalpha induces adipogenesis through PPARgamma: a unified pathway. Genes Dev. 2002;16(1):22–26.
- Rosen ED, Macdougald OA. Adipocyte differentiation from the inside out. Nat Rev Mol Cell Biol. 2006;7(12):885–896.
- Sreedhar AS, Söti C, Csermely P. Inhibition of HSP90: a new strategy for inhibiting protein kinases. Biochim Biophys Acta. 2004;1697(1–2):233–242.
- Chiosis G, Lucas B, Shtil A, et al. Development of a purine-scaffold novel class of Hsp90 binders that inhibit the proliferation of cancer cells and induce the degradation of Her2 tyrosine kinase. Bioorg Med Chem. 2002;10(11):3555–3564.
- Kanugovi Vijayavittal A, Amere Subbarao S. The conformation-specific Hsp90 inhibition interferes with the oncogenic RAF kinase adaptation and triggers premature cellular senescence, hence, acts as a tumor suppressor mechanism. Biochim Biophys Acta Mol Cell Res. 2021;1868(3):118943.
- Chunming C, Peng R, Feng G, et al. Glucose-mediated N-glycosylation of SCAP is essential for SREBP-1 activation and tumor growth. Cancer Cell. 2015;28(5):569–581.
- Moon YA, Liang G, Xie X, et al. The Scap/SREBP pathway is essential for developing diabetic fatty liver and carbohydrate-induced hypertriglyceridemia in animals. Cell Metab. 2012;15(2):240–246.
- Tian WX, Yan D, Hui Q, et al. The dependence of fat level of hen on activity of fatty acid synthase in liver on different ages. Chinese Biochem J. 1996;12(2):234–236.