
Abstract
Mitochondrial DNA (mtDNA) variations and associated effects on economic traits have been widely reported in farm animals, as these genetic polymorphisms can affect the efficiency of energy production and cell metabolism. In studies related to metabolism, the deposition of fat was highly correlated with mitochondria. However, the effect of mtDNA polymorphisms on porcine backfat thickness (BFT) remained unclear. In this study, 243 pigs were collected to analyse the relationship between BFT and mtDNA polymorphisms. There were considerable differences in BFT, ranging from 5 mm to 18 mm. MtDNA D-loop sequencing discovered 48 polymorphic sites. Association analysis revealed that 30 variations were associated with BFT (P < 0.05). The polymorphism m.794A > G showed the maximum difference in BFT between A and G carriers, which differed at ∼2.5 mm (P < 0.001). The 48 polymorphic sites generated 22 haplotypes (H1-H22), which clustered into 4 haplogroups (HG1-HG4). HG1 had a lower BFT value than other three haplogroups (P < 0.01), whereas H4 in HG1 exhibited the lowest BFT of all haplotypes analyzed (P < 0.01). The results of this study highlight an association between mtDNA polymorphisms and BFT, and suggest the potential application of mtDNA in pig molecular breeding practices.
Introduction
Mitochondria are organelles found in most eukaryotic cells, including those of plants and animals, which are commonly referred to as powerhouses.Citation1 Mitochondrial function is crucial for many biological processes, including calcium homoeostasis, hormone synthesis, regulation of reactive oxygen species, metabolism, cell signalling, autophagy and apoptosis,Citation2 while dysfunctional mitochondria are implicated in diseases, such as diabetes.Citation3 In addition, mitochondria are primary organelles for fatty acid oxidation and provide precursor molecules for lipid metabolism, suggesting that being associated with fat deposition.Citation4,Citation5 MtDNA is the genetic material found in mitochondria, which encodes proteins involved in mitochondrial respiratory chain complexes. Accordingly, mutations in mtDNA have been correlated with economic traits closely related to energy in farm animals, including bovine stress resistance,Citation6 milk yield,Citation7 beef marbling score and longissimus muscle area,Citation8 chicken chest dept,Citation9 ovine prolificacy,Citation10,Citation11 and porcine intramuscular fat,Citation12 litter size,Citation13 muscle depth, lifetime daily gain and teat quality.Citation14
Adipose tissue is a specialized type of connective tissue that plays a crucial role in energy storage and metabolism in animals.Citation15,Citation16 In adipocytes, the process of lipogenesis refers to the synthesis or production of fatty acids and triglycerides, which plays a vital role in regulating metabolic homoeostasis, energy balance, and body composition.Citation17,Citation18 It mainly involves the conversion of excess glucose, dietary carbohydrates, and other substrates into fatty acids, which are then stored as triglycerides in adipose tissue. In pigs, BFT is a crucial indicator that reflects the content of adipose tissue present. BFT is a measure of the amount of fat located between the skin and muscle tissue on the back of an animal, typically pigs or cattle, which is an important quantitative trait and varies significantly among different breeds.Citation19–21 It is an important indicator for grading beef qualityCitation22,Citation23 and selecting pigs with high lean meat percentages. Besides, BFT is related to reproductive performance, lactation capacity, feed utilization rate, carcass grading, and meat quality.Citation24–26 Evidence suggests that mtDNA polymorphisms can play a role in fat deposition and obesity in animals. Studies have shown that mtDNA mutations are associated with mitochondrial dysfunction, which leads to a decrease in energy production and an imbalance in energy intake and expenditure, resulting in obesity.Citation27–29 One study has shown that Qatari individuals with mitochondrial haplogroup J have an increased risk of obesity, whereas individuals with haplogroup X own a lower risk for obesity.Citation30 Overall, although the exact mechanisms by which mtDNA influences fat deposition are not fully understood, there is evidence to suggest that variations in mtDNA can play an important role in the regulation of fat accumulation in animals.
Currently, with the development of molecular biology technology, many candidate genes related to backfat thickness and their molecular markers have been identified.Citation31,Citation32 Yet, as the important genetic material inherited through the maternal line, mitochondrial genome contributions to the dynamics of live BFT in pigs remain unknown. Thus, the present study explored the relationship between mtDNA polymorphisms and live BFT in pigs, aimed to provide useful markers for pig molecular breeding.
Materials and methods
Ethics statement
The guidelines of the experimental animal management of China Agricultural University (CAU) were followed throughout the study, and the experimental protocols were approved by the Experimental Animal Care and Use Committee of CAU.
Animal and sample collection
A total of 243 six-month-old sows (Landrace × Large White breed background), nearly 100 kg (± 5 kg) weight, were collected from Jining Anxin Breeding Co., Ltd in Shandong for evaluating BFT and collecting ear tissue samples. Pigs collected in this study were unrelated and in good health. All pigs were raised under consistent conditions, including farm, feeding, and management, etc. Ear tissue samples were collected and stored in 1.5 mL centrifuge tubes with 75% ethanol at −20 °C.
Backfat thickness measurement
Pig BFT was measured with a live backfat instrument (RENCO, USA) according to the user’s guide. Briefly, each pig was fixed in a crate, and the measurement position was selected at a point 50 mm from the midline of the back between the penultimate third and fourth ribs. Before the detection, the pig hair at the measured position was cut off and applied an appropriate amount of coupling agent. Then, the pig BFT information was detected by attaching the probe coated with the coupling agent vertically and tightly to the measurement position.
Genome extraction and mtDNA sequencing
Genomic DNA was extracted using Tissue/Cell Genome DNA Extraction Kits (Aidlab, DN08) according to the manufacturer’s instruction. The primer pair, forward primer 5′-CAAGACTCAAGGAAGGAGACT-3′ from nucleotide (nt) 16543 to nt 16563 and reverse primer 5′-AACCTGTGTGTTTATGGAGC-3′ from nt 1234 to nt 1253, was used to amplify the mtDNA D-loop region, which was designed in our previous report.Citation33 The polymerase chain reaction (PCR) amplification was performed in a 30 µL reaction buffer containing 15 µL of 2 × A9 LongHiFi PCR MasterMix (Aidlab, PC84), 1 µL of each forward and reverse primers (10 µM), 1 µL extracted DNA and 12 µL double-distilled H2O. The PCR program was pre-denatured at 95 °C for 3 min, followed by 30 circles of 95 °C for 10 s, 56 °C for 15 s and 72 °C for 20 s with a final 72 °C for 2 min. After electrophoresis, PCR products were sequenced through Sanger sequencing method by Beijing Qingke Technology Co., Ltd. The complete porcine mitochondrial genome sequence (GenBank Accession no. NC_000845.1) was used as the reference sequence for sequence alignment. The mtDNA polymorphisms in the D-loop region were identified through sequence alignments of 243 samples using the software MEGA7 (version 7.0.26).
Statistical analysis
Mitochondrial genome haplotypes were classified and sorted by DnaSP (version 5.10.01) and FaBox online software (http://users-birc.au.dk/biopv/php/fabox/). The Median-joining method in the Network 5 software was used to perform cluster analysis on haplotypes, and haplotype groups were classified according to mutated positions among haplotypes. The association between mtDNA polymorphism/haplotype/haplogroup and pig BFT was analysed by the analysis of variance (ANOVA), followed by Duncan’s multiple-range test using the general linear model procedure of software SAS (version 8.2). Results were given as the mean ± standard error of the mean (SEM) and two-sided P < 0.05 or 0.01 was considered significant or extremely significant, respectively.
Result
Morphological observations on backfat thickness
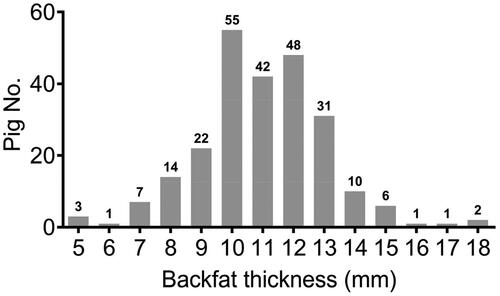
As shown in , the average level of BFT per pig was approximately 11 mm, whereas the value of BFT varied considerably, ranging from 5 mm to 18 mm per pig. Among these pigs, 55 of which exhibited 10 mm BFT, followed by 48 pigs owned 12 mm BFT and 42 pigs contained 11 mm BFT, which showed that pigs with 11 to 12 mm BFT accounted for 60% of the total ().
Figure 1. The distribution plot of the backfat thickness of 243 pigs.
Association analysis of mtDNA polymorphisms and backfat thickness
To investigate the great differences in BFT among pigs, we detected mutations in the mtDNA D-loop region of pigs and analysed the potential effect on BFT through association analysis. A total of 48 polymorphic sites were found in the mtDNA D-loop region among 243 sows (Table S1), 30 of which were associated with BFT (). Among them, the m.794A > G mutation had the largest difference value, with differences of more than 2.5 mm in the BFT between A and G carriers (P < 0.001).
Table 1. Mitochondrial DNA polymorphic sites associated with porcine backfat thickness.
Association analysis of mtDNA haplotype/haplogroup and backfat thickness
Based on 48 polymorphic sites in mtDNA D-loop region, 22 haplotypes were identified, which were named H1-H22 ( and Table S1). The sequence information of every haplotype (H1-H22) was uploaded to the GenBank of NCBI, and accession numbers were as follows: MT407548-MT407569. Association analysis presented that the BFT in pigs with H4 was significantly lower than that in pigs with other haplotypes (P < 0.01), and specimens H4 (∼8.5 mm) and H14 (∼11.7 mm) contained the minimum and maximum BFT of pigs, respectively, which existed a 3.20 mm difference on BFT between them ( and Table S2).
Figure 2. Cluster analysis of mtDNA haplotypes and their correlation with backfat thickness. (a) Cluster analysis of mtDNA haplotypes (H): the 22 haplotypes were clustered into four haplogroups (HG), HG1-HG4. The size of yellow circles indicated the number of pigs belonged to each haplotype. (b) Association analysis of haplotype and backfat thickness. Only haplotypes that were found in more than three individuals were analysed. (c) Association analysis of haplogroup and backfat thickness. Data were shown as mean ± SEM. Different capital letters above columns indicated extremely significant differences, P < 0.01.
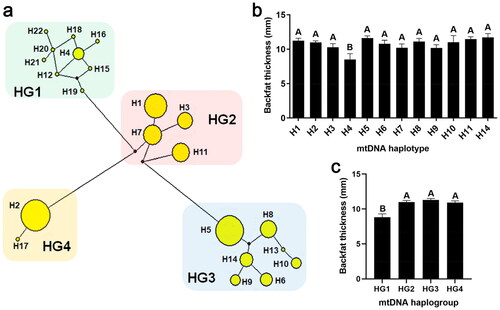
The 22 haplotypes were grouped into four diverse haplogroups (named HG1-HG4, ) according to mutated positions among haplotypes (Table S1). Notably, haplotypes H4, H12, H15, H16, H18, H19, H20, H21 and H22 were clustered into HG1, whereas haplotypes H1, H3, H9, H7 and H11 were in HG2, haplotypes H5, H6, H8, H9, H10, H13 and H14 were in HG3, haplotypes H2 and H17 were in HG4 (). As shown in and Table S2, pigs with HG2, HG3 or HG4 exhibited higher BFT than pigs with HG1 (P < 0.01), and the difference of BFT between HG1 and HG3 was the highest, reaching nearly 2.48 mm (P < 0.01).
By examining the frequencies of the thirty mtDNA polymorphic sites correlated with BFT, the imbalanced distribution among the four haplogroups were revealed (). The frequencies of thirteen mtDNA mutations (m.714A > G, m.722A > G, m.734A > G, m.742A > G, m.752A > G, m.762A > G, m.772A > G, m.782A > G, m.794A > G, m.802A > G, m.812A > G, m.822A > G and m.834A > G) with lower BFT () were all very high in HG1, and ranged from 0.69 to 1.00, whereas the reverse results were found in other three haplogroups (HG2-HG4) (). Among the thirteen mutations, eight of which (m.714A > G, m.722A > G, m.734A > G, m.742A > G, m.752A > G, m.762A > G, m.772A > G and m.782A > G) were completely linked and formed the basic distinction between HG1 and other three haplogroups (HG2-HG4).
Table 2. Frequency of mitochondrial DNA polymorphic sites in haplogroups.
Discussion
The backfat serves as a reliable indicator of fat deposition ability, animal condition and overall health.Citation34–36 It is closely associated with both productive and reproductive traits, such as lean percentage,Citation37,Citation38 inflammation and litter size,Citation39–42 and regarded as a significant parameter in pig breeding programmes. BFT is an important quantitative trait that varies among pig breeds. As a carcass trait, it has high heritability and is mainly regulated by multiple factors, mainly including genetics, environment, and nutrition.Citation31,Citation43–45 One common approach for BFT selection process is to conduct regular measurements of BFT using ultrasound or other precise measuring tools.Citation46 This accurate assessment of BFT at different growth stages provides a rough evaluation of an individual’s genetic potential. As genetics progresses, newer methods like marker-assisted selection (MAS) and genomic selection (GS) have been introduced for selection and breeding.Citation47–49 These methods enable the identification of pigs with superior genetic potential for fat deposition, facilitating more targeted and efficient breeding decisions. However, it is important to note that these projects primarily focus on analyzing nuclear genome and overlook the significant contributions made by mtDNA.
Mitochondria are closely related to metabolism, energy generation and cellular homeostasis, affecting animal developments, such as skeletal muscle growth, fat metabolism and deposition, maturation of germ cells, and even disease resistance.Citation13,Citation50,Citation51 As the important extrachromosomal genetic material, mtDNA exists in mitochondria and codes peptides that involved in respiratory chain complexes. MtDNA polymorphisms are one of the main factors affecting mitochondrial function through affecting mtDNA replication and expression, and the function of mitochondrial complexes.Citation13,Citation52,Citation53 In the mitochondrial genome, the D-loop region is the core domain for regulating mtDNA replication, transcription and stability through combining various effectors.Citation54 Mutations in mtDNA D-loop may disturb these biological processes and lead to mitochondrial dysfunction.Citation53 Therefore, the correlation between polymorphisms of the mtDNA D-loop and pig BFT was analyzed in the present study, which would like to fill the gap in extranuclear genetic effect on BFT. The results found 48 mutations in 243 pig samples, including eight sites (m.714A > G, m.722A > G, m.734A > G, m.742A > G, m.752A > G, m.762A > G, m.772A > G and m.782A > G) that were completely linked and formed the basic differentiation of the haplogroup HG1 with another three haplogroups (HG2, HG3 and HG4) ( and ). The H4, belonged to HG1, exhibited the lowest BFT among haplotypes (). And the point mutation m.794A > G showed the largest BFT difference: the BFT in m.794A carriers was over 2.5 mm less than that in m.794G sows (). As we can see in , the frequency of A at the m.794 site was very high in HG1, which reached 0.75; however, no A mutation was detected in the other three haplogroups. These data suggested that the mutation m.794A > G or haplotype H4 probably acted prominently in backfat deposition. The results of the present study revealed that mtDNA polymorphic sites, haplotypes and haplogroups were associated with live BFT of pigs, allowing us to suggest that mtDNA molecular could be used as candidate gene markers for animal breeding, reflecting BFT. Our previous study has identified that thirteen mtDNA polymorphic sites are significantly associated with the number of oocytes in pigs with Landrace × Large White breed background.Citation33 Among these mutations, 11 of which (m.109C > T, m.131A > G, m.145C > T, m.153C > T, m.158A > G, m.241C > T, m.294A > G, m.306C > T, m.390C > T, m.704A > G and m.706A > G) were identified their associations with BFT in this study (). Notably, these mutations exhibited opposing effects between BFT and oocyte number, indicating that mtDNA mutations associated with higher oocyte number were correlated with lower BFT. This observation suggested that reducing BFT within a certain range could be beneficial for improving the reproductive performance of pigs, which was consistent with previous studies.Citation40,Citation42
The function of mitochondria is regulated by the collaboration of proteins encoded by nuclear and mitochondrial genes. In this study, the Landrace × Large White breed pigs were selected for analysis, which provided a relative high similarity in nuclear genome among pigs; but they cannot be completely identical, which might have slight interferences to identify mtDNA effects on BFT. Therefore, in the next study, we will construct cybrids cells, mtDNA point mutation cells and transmitochondrial pigs to provide more rigorous evidence for revealing the effect of mtDNA mutations/haplotypes on pig traits.
Conclusion
Specific mtDNA mutations, haplotypes and haplogroups were characterized and linked with the porcine BFT trait. As the BFT is a quantitative trait with high heritability, mtDNA polymorphisms could be useful in marker-assisted selection for greater predictability of carcass traits. For further study, these mtDNA polymorphisms or haplotypes should be put into post-association validation and might be used as genetic markers in porcine selection and breeding projects.
Authors’ contributions
Xingbo Zhao and Hao Liu conceived and designed the study. Hao Liu and Xing Zhang collected the samples and performed experiments. Xing Zhang and Yaning Hu analyzed the data. Xingbo Zhao and Hao Liu interpreted the data and drafted the manuscript. All authors read and approved the final manuscript.
Supplemental Material
Download MS Word (16 KB)Supplemental Material
Download MS Word (18.9 KB)Supplementary material
Table S1. MtDNA mutations among twenty-two haplotypes.
Table S2. Backfat thickness values for each mtDNA haplotype/haplogroup.
Disclosure statement
No potential conflict of interest was reported by the authors.
Availability of data
Sequences of mtDNA haplotypes were submitted and deposited in the GenBank database.
Additional information
Funding
References
- Trigo D, Avelar C, Fernandes M, Sá J, da Cruz ESO. Mitochondria, energy, and metabolism in neuronal health and disease. FEBS Lett. 2022;596(9):1095–1110.
- Abate M, Festa A, Falco M, et al. Mitochondria as playmakers of apoptosis, autophagy and senescence. Semin Cell Dev Biol. 2020;98:139–153.
- Krako Jakovljevic N, Pavlovic K, Jotic A, et al. Targeting mitochondria in diabetes. Int J Mol Sci. 2021;22(12):6642.
- Bradley J, Swann K. Mitochondria and lipid metabolism in mammalian oocytes and early embryos. Int J Dev Biol. 2019;63(3-4-5):93–103.
- Srivastava A, Srivastava P, Mathur S, et al. Lipid metabolism and mitochondria: cross talk in cancer. Curr Drug Targets. 2022;23(6):606–627.
- Macedo AA, Bittar JF, Bassi PB, et al. Influence of endogamy and mitochondrial DNA on immunological parameters in cattle. BMC Vet Res. 2014;10(1):79.
- Qin YH, Chen SY, Lai SJ. Polymorphisms of mitochondrial ATPase 8/6 genes and association with milk production traits in Holstein cows. Anim Biotechnol. 2012;23(3):204–212.
- Mannen H, Kojima T, Oyama K, Mukai F, Ishida T, Tsuji S. Effect of mitochondrial DNA variation on carcass traits of Japanese Black cattle. J Anim Sci. 1998;76(1):36–41.
- Wang D, Teng J, Ning C, et al. Mitogenome-wide association study on body measurement traits of Wenshang barred chickens. Anim Biotechnol, 2023;34(7):3154–3161.
- Chen X, Wang D, Xiang H, et al. Mitochondrial DNA T7719G in tRNA-Lys gene affects litter size in small-tailed Han sheep. J Anim Sci Biotechnol. 2017;8:31.
- Reicher S, Seroussi E, Weller JI, Rosov A, Gootwine E. Ovine mitochondrial DNA sequence variation and its association with production and reproduction traits within an Afec-Assaf flock. J Anim Sci. 2012;90(7):2084–2091.
- Fernández AI, Alves E, Fernández A, et al. Mitochondrial genome polymorphisms associated with longissimus muscle composition in Iberian pigs. J Anim Sci. 2008;86(6):1283–1290.
- Liu H, Wang J, Wang D, et al. Cybrid model supports mitochondrial genetic effect on pig litter size. Front Genet. 2020;11:579382.
- St John JC, Tsai TS. The association of mitochondrial DNA haplotypes and phenotypic traits in pigs. BMC Genet. 2018;19(1):41.
- Chouchani ET, Kajimura S. Metabolic adaptation and maladaptation in adipose tissue. Nat Metab. 2019;1(2):189–200.
- Frigolet ME, Gutiérrez-Aguilar R. The colors of adipose tissue. Gac Med Mex. 2020;156(2):142–149.
- Ameer F, Scandiuzzi L, Hasnain S, Kalbacher H, Zaidi N. De novo lipogenesis in health and disease. Metabolism. 2014;63(7):895–902.
- Song Z, Xiaoli AM, Yang F. Regulation and metabolic significance of de novo lipogenesis in adipose tissues. Nutrients. 2018;10(10):1383.
- Nakajima I, Kojima M, Oe M, Ojima K, Muroya S, Chikuni K. Comparing pig breeds with genetically low and high backfat thickness: differences in expression of adiponectin, its receptor, and blood metabolites. Domest Anim Endocrinol. 2019;68:54–63.
- Raza SHA, Liu GY, Zhou L, et al. Detection of polymorphisms in the bovine leptin receptor gene affects fat deposition in two Chinese beef cattle breeds. Gene. 2020;758:144957.
- Warriss PD, Brown SN, Franklin JG, Kestin SC. The thickness and quality of backfat in various pig breeds and their relationship to intramuscular fat and the setting of joints from the carcasses. Meat Sci. 1990;28(1):21–29.
- Bresolin T, Passafaro TL, Braz CU, et al. Investigating potential causal relationships among carcass and meat quality traits using structural equation model in Nellore cattle. Meat Sci. 2022;187:108771.
- Detweiler RA, Pringle TD, Rekaya R, Wells JB, Segers JR. The impact of selection using residual average daily gain and marbling EPDs on growth, performance, and carcass traits in Angus steers1. J Anim Sci. 2019;97(6):2450–2459.
- de Koning DJ, Janss LL, Rattink AP, et al. Detection of quantitative trait loci for backfat thickness and intramuscular fat content in pigs (Sus scrofa). Genetics. 1999;152(4):1679–1690.
- Decaluwé R, Maes D, Declerck I, et al. Changes in back fat thickness during late gestation predict colostrum yield in sows. Animal. 2013;7(12):1999–2007.
- Kim GW, Kim HY. Effects of carcass weight and back-fat thickness on carcass properties of Korean native pigs. Korean J Food Sci Anim Resour. 2017;37(3):385–391.
- Aon MA, Cortassa S, Juhaszova M, Sollott SJ. Mitochondrial health, the epigenome and healthspan. Clin Sci (Lond). 2016;130(15):1285–1305.
- Pinti MV, Fink GK, Hathaway QA, Durr AJ, Kunovac A, Hollander JM. Mitochondrial dysfunction in type 2 diabetes mellitus: an organ-based analysis. Am J Physiol Endocrinol Metab. 2019;316(2):E268–e85.
- Trifunovic A, Wredenberg A, Falkenberg M, et al. Premature ageing in mice expressing defective mitochondrial DNA polymerase. Nature. 2004;429(6990):417–423.
- Dashti M, Alsaleh H, Rodriguez-Flores JL, Eaaswarkhanth M, Al-Mulla F, Thanaraj TA. Mitochondrial haplogroup J associated with higher risk of obesity in the Qatari population. Sci Rep. 2021;11(1):1091.
- Gozalo-Marcilla M, Buntjer J, Johnsson M, et al. Genetic architecture and major genes for backfat thickness in pig lines of diverse genetic backgrounds. Genet Sel Evol. 2021;53(1):76.
- Qiao R, Zhang M, Zhang B, et al. Population genetic structure analysis and identification of backfat thickness loci of Chinese synthetic Yunan pigs. Front Genet. 2022;13:1039838.
- Liu H, Shi W, Wang D, Zhao X. Association analysis of mitochondrial DNA polymorphisms with oocyte number in pigs. Reprod Fertil Dev. 2019;31(4):805–809.
- Cassisa A. Pathophysiology of subcutaneous fat. G Ital Dermatol Venereol. 2013;148(4):315–323.
- Ibrahim MM. Subcutaneous and visceral adipose tissue: structural and functional differences. Obes Rev. 2010;11(1):11–18.
- Patel P, Abate N. Body fat distribution and insulin resistance. Nutrients. 2013;5(6):2019–2027.
- Hoque MR, Kim IH. Effect of non-starch polysaccharide enzyme supplementation with gradually reduced energy diet on growth performance, nutrient digestibility, lean meat percentage and backfat thickness of growing pigs. J Anim Physiol Anim Nutr (Berl). 2023;107(2):574–580.
- Song B, Zheng C, Zheng J, et al. Comparisons of carcass traits, meat quality, and serum metabolome between Shaziling and Yorkshire pigs. Anim Nutr. 2022;8(1):125–134.
- Brameld JM, Parr T. Improving efficiency in meat production. Proc Nutr Soc. 2016;75(3):242–246.
- De Rensis F, Gherpelli M, Superchi P, Kirkwood RN. Relationships between backfat depth and plasma leptin during lactation and sow reproductive performance after weaning. Anim Reprod Sci. 2005;90(1-2):95–100.
- Hu J, Yan P. Effects of backfat thickness on oxidative stress and inflammation of placenta in large white pigs. Vet Sci. 2022;9(6):302.
- Thiengpimol P, Koonawootrittriron S, Suwanasopee T. Genetic and phenotypic correlations between backfat thickness and weight at 28 weeks of age, and reproductive performance in primiparous Landrace sows raised under tropical conditions. Trop Anim Health Prod. 2022;54(1):43.
- Gilbert H, Billon Y, Brossard L, et al. Review: divergent selection for residual feed intake in the growing pig. Animal. 2017;11(9):1427–1439.
- Gourdine JL, Riquet J, Rosé R, et al. Genotype by environment interactions for performance and thermoregulation responses in growing pigs1,2. J Anim Sci. 2019;97(9):3699–3713.
- Zhang Y, Zhang J, Gong H, et al. Genetic correlation of fatty acid composition with growth, carcass, fat deposition and meat quality traits based on GWAS data in six pig populations. Meat Sci. 2019;150:47–55.
- Esquivelzeta C, Casellas J, Fina M, Piedrafita J. Backfat thickness and longissimus dorsi real-time ultrasound measurements in light lambs. J Anim Sci. 2012;90(13):5047–5055.
- Barroso LMA, Nascimento M, Nascimento ACC, et al. Regularized quantile regression for SNP marker estimation of pig growth curves. J Anim Sci Biotechnol. 2017;8(1):59.
- Dekkers JC. Marker-assisted selection for commercial crossbred performance. J Anim Sci. 2007;85(9):2104–2114.
- Yang AQ, Chen B, Ran ML, Yang GM, Zeng C. The application of genomic selection in pig cross breeding. Yi Chuan. 2020;42(2):145–152.
- Quadrilatero J. Mitochondria: key modulators of skeletal muscle remodeling. Semin Cell Dev Biol. 2023;143:1–2.
- Valadas JS, Vos M, Verstreken P. Therapeutic strategies in Parkinson’s disease: what we have learned from animal models. Ann N Y Acad Sci. 2015;1338(1):16–37.
- Wang J, Xiang H, Liu L, Kong M, Yin T, Zhao X. Mitochondrial haplotypes influence metabolic traits across bovine inter- and intra-species cybrids. Sci Rep. 2017;7(1):4179.
- Yu G, Xiang H, Tian J, et al. Mitochondrial Haplotypes Influence Metabolic Traits in Porcine Transmitochondrial Cybrids. Sci Rep. 2015;5(1):13118.
- Vakifahmetoglu-Norberg H, Ouchida AT, Norberg E. The role of mitochondria in metabolism and cell death. Biochem Biophys Res Commun. 2017;482(3):426–431.
- Yeung KY, Dickinson A, Donoghue JF, et al. The identification of mitochondrial DNA variants in glioblastoma multiforme. Acta Neuropathol Commun. 2014;2(1):1.