
Abstract
The objective of this study was to assess the genetic diversity, phylogenetic relationship and population structure of five goat breeds in Shanxi, China. High genetic diversities were found in the five populations, among which, Licheng big green goat (LCBG) has the highest genetic diversity, while Jinlan cashmere goat (JLCG) population has the lowest genetic diversity. Bottleneck analysis showed the absence of recent genetic bottlenecks in the five goat populations. Genetic differentiation analysis shows that the closest genetic relationship between LCBG and LLBG (Lvliang black goat) was found, and the genetic distance between JLCG and the other four populations is the largest. The population structure of JLCG is different from the other four populations with K = 2, while LCBG and LLBG have high similarity population structure as the K value changes. Knowledge about genetic diversity and population structure of indigenous goats is essential for genetic improvement, understanding of environmental adaptation as well as utilization and conservation of goat breeds.
Introduction
Goats (Capra hircus) are economically important domestic animals worldwide. They have long been used for their milk, meat, hair (including cashmere), and skins throughout much of the world.Citation1 China has rich local goat breeds and also has one of the largest goat populations in the world.Citation2 Shanxi province is located in the middle northern region of China. It has a large area of mountainous and hilly, and the regions of artificial grassland are developing rapidly. Animal husbandry developed well in the province and the number of goats is also increasing year by year. There are totally six local goat breeds in Shanxi, namely Licheng big green goat (LCBG), Lvliang black goat (LLBG), Yangcheng white goat (YCWG), Lingqiu green back goat (LQGB), Jinlan cashmere goat (JLCG) and Hongdong milk goat (HDMG). Information about genetic diversity and population structure among goat breeds is essential for genetic improvement, understanding of environmental adaptation as well as utilization and conservation of goat breeds.Citation3
The evaluation methods for animal genetic diversity are gradually improving with the development of biology. Genetic marker technology has transited from morphological, cytogenetic and biochemical markers to DNA molecular markers, the essence of genetic material. At present, commonly used DNA molecular markers include restriction fragment length polymorphism (RFLP), randomly amplified polymorphic DNA (RAPD), amplified fragment length polymorphism (AFLP), single-stranded conformational polymorphism (SSCP), microsatellite markers (SSR) and single-nucleotide polymorphism (SNP).Citation4–7
Microsatellites are also known as short tandem repeats (STR) or simple sequence repeats (SSR), and they are typically composed of 1–6 nucleotide repeats.Citation8 As early as 1974, Skinner et al.Citation9 found the simple tandem repeat sequence of TAGG in the genome of hermit crabs. Later, in 1980, Singh et al.Citation10 also found repeat sequences of GATA/GAGA in the W sex chromosome of Bungarus fasciatus. However, it was not until 1982 in which Hamada et al.Citation11 found a huge number of stretches of dT-dG alternating sequences in eukaryotic genomes that microsatellites attracted attention. Microsatellites are abundant, distributed throughout the genome and also highly polymorphic compared with other genetic markers, as well as being species-specific and co-dominant.Citation12 Microsatellites are suitable for genetic diversity analysis and studies have also been carried out in the past few years for goats.Citation13–15
In this experiment, we explored 15 microsatellite loci with capillary electrophoresis for five local goats in Shanxi, China, and they are Licheng big green goat (LCBG), Lvliang black goat (LLBG), Yangcheng white goat (YCWG), Lingqiu green back goat (LQGB) and Jinlan cashmere goat (JLCG). The diversity and population structure would provide the basis for a genetic resource conservation strategy for native goats in this area.
Material and methods
Animals and DNA extraction
This study analyzed the genetic diversity of five populations, which were the Licheng big green goat (LCBG), Lvliang black goat (LLBG), Yangcheng white goat (YCWG), Lingqiu green back goat (LQGB) and Jinlan cashmere goat (JLCG). A total 5 mL of jugular vein blood was collected from individuals in each population. Samples of 60 were collected from both populations LCBG and LLBG, and 65 and 63 blood samples were obtained from YCWG and LQGB, respectively. The highest number of blood samples collected from the JLCG breed was 146. Then genomic DNA was extracted according to the Ezup Column Blood Genomic DNA Purification Kit (Sangon Biotech, Shanghai, China). Finally, they were dissolved with DEPC treated water and stored at −80 °C for subsequent experiments.
PCR amplification and sequencing
A total of 15 microsatellite loci distributed in different chromosomes were detected in each population and all the primer sequences are shown in . These primers are synthesized and fluorescently labeled with HEX or FAM by Sangon Biotech (Shanghai, China). The 25 μL PCR reaction system includes Primer F (10 μM), 0.5 μL; Primer R (10 μM), 0.5 μL; dNTP (10 mM), 0.5 μL; 10X PCR Buffer with MgCl2, 2.5 μL; Taq DNA polymerase (5 U/ul), 0.2 μL; template DNA (20–50 ng/μl), 1 μL; ddH2O, 19.8 μl. Then the touchdown PCR (TD PCR) was performed and the reaction program is as follows: pre-denaturation 95 °C for 5 min; denaturation 94 °C for 30 s, annealing at 60 °C for 30 s, 72 °C extension for 30 s, 10 cycles (annealing temperature reduced 0.5 °C per cycle); denaturation 94 °C for 30 s, 55 °C annealing for 30 s, 72 °C extension for 30 s, 30 cycles; extension at 72 °C for 10 min. Finally, instrument ABI 3730XL (Thermo Fisher Scientific, USA) was used for capillary electrophoresis of PCR products.
Table 1. Primer sequence information of 15 microsatellite loci.
Statistical analysis
Statistical analysis of the observed heterozygosity (HO), expected heterozygosity (HE), observed number of alleles (NA) and effective number of alleles (NE) was performed with the PopGen32. Estimated null allele frequency (F(Null)), polymorphism information content (PIC) and Hardy–Weinberg equilibrium (HWE) were estimated using Cervus (3.0.6) software.
Bottleneck analysis of populations was performed with software BOTTLENECK (1.2.02), in which two method Wilcoxon sign rank test and a qualitative test of mode shift were used. Wilcoxon sign rank test based on three different mutation models with 1000 iterations, including infinite alleles model (IAM), stepwise mutation model (SMM), and two-phase model (TPM). The proportion of SMM in TPM was set to 95% and the variance for TPM was set to 12.Citation16
The inbreeding coefficient (FIS) and pairwise differences between the populations (FST) were calculated by GenAlEx 6.5.Citation17 Significant difference analysis of FST between populations was assessed with Arlequin software version 3.5.2.2.Citation18 Gene flow (Nm), genetic identity (GI) and genetic distance (DA) were obtained with PopGen32, and the phylogenetic tree with the UPGMA method was performed using MEGA-X.
Structure 2.3.4Citation19 was utilized to assess the population structure with Bayesian clustering and an admixture model from K = 2 to K = 10 in 10 runs. Assignment clusters were made with a burn‐in of 50,000, and 100,000 Markov Chain Monte Carlo iterations (MCMC). Finally, Structure Harvester (Web v0.6.94) is used to analyze the results to obtain delta K.
Results
Genetic variation analysis
In this study, the genetic diversity of 15 microsatellite loci was first analyzed (). A total of 230 alleles (NA) were found across five goat populations for all the SSR and an average of 15.3 alleles per maker was observed, ranging from 7 (INRA063) to 25 (MAF065). The highest effective number of alleles (NE) was observed at locus BM3412 (9.5210) and the lowest value at OarHH35 (3.1417). The observed heterozygosity (HO) and expected heterozygosity (HE) varied from 0.5612 to 0.9109 and 0.6826 to 0.8961, respectively. The average value of polymorphic information content (PIC) is 0.793, which ranged from 0.655 (OarAE54) to 0.886 (BM3412). Hardy-Weinberg equilibrium test (HWE) found 9 loci with no significant differences (NS), and 6 sites with significant (**) or extremely significant differences (***). However, the null allele frequencies of all 15 loci are very low and the loci can thus be used for subsequent analysis.
Table 2. Genetic diversity of 15 microsatellite locus across five the goat populations in Shanxi province.
Across markers (), the mean number of alleles (NA) within the population ranged from 9.93 ± 3.33 in YCWG to 11.27 ± 3.9 in LLBG. The highest effective number of alleles (NE) was observed at locus LLBG (5.87 ± 1.88) and the lowest value was found at JLCG (4.93 ± 1.65). The HO and HE values were 0.76-0.83 and 0.78-0.82, respectively. The highest PIC was observed in LLBG (0.79 ± 0.07), and the lowest value was observed in JLCG (0.74 ± 0.09).
Table 3. Genetic diversity of the five goat populations.
Bottleneck analysis
The results of the one-tailed Wilcoxon sign rank test for heterozygosity under three different mutation models (IAM, SMM and TPM) are presented in . Under the IAM model, all the five goat breeds showed significant heterozygosity excess and deviations from the mutation drift (p < .05). However, such a heterozygosity excess was not observed in these populations when assumed under the SMM and TPM models.
Table 4. Wilcoxon sign rank test to evaluate five populations for mutation drift equilibrium under different models.
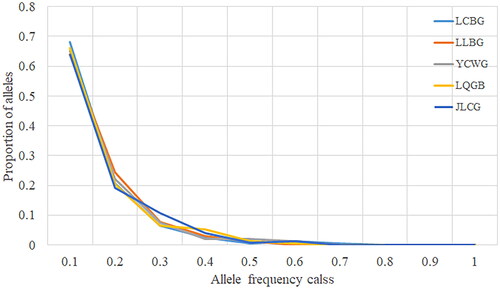
With genetic bottleneck events expected to result in the loss of rare alleles, a qualitative graphical test plotting the allele frequency distribution will show a characteristic mode shift distortion from the normal L-shaped distribution. In the present study, all the five goat breeds presented a normal L-shaped distribution of allele frequencies (), suggesting a lack of evidence for recent genetic bottlenecks in any of the populations.
Figure 1. Allele frequency distribution of the 15 microsatellite loci.
Genetic differentiation within and between goat populations
To analyze the degree of differentiation within and between populations, F statistics were calculated. The FIS value of the 15 microsatellite loci varied between −0.1295 (OarHH35) and 0.1215 (OarAE54). The lowest (0.0178) and the highest (0.0498) FST values were detected in BM6526 and MAF065, respectively. The mean of FST in the five populations is 0.0303, which indicated that the genetic variation between these populations reached 3.03%. Gene flow (Nm) shows the migration of genes between populations. The greater the Nm value, the more similarity between populations. The average Nm value of 15 loci is 8.6038, indicating a small genetic differentiation between the five populations ().
Table 5. Genetic diversity of the five goat populations.
In the pairwise-population FST analysis, the greatest divergence (0.048) was observed between LCBG and JLCG (). The significance test at 0.05 level of FST found that all populations showed significant divergence from each other ().
Table 6. Pairwise differences of FST in the five goat populations.
Phylogenetic relationship and population structure of five populations
Nei’s unbiased measures of genetic distance (DA) were performed and are shown in , ranging from 0.1092 to 0.2267. According to the genetic distance (DA), an un-weighted pair-group method (UPGMA) phylogenetic tree of five goat populations was constructed (). The results indicated that five goat populations can be divided into two groups. JLCG was alone in one group. The other four populations were classed into another group. In the second group, LCBG and LLBG are first clustered together, followed by LQGB, and finally by YCWG.
Figure 2. UPGMA phylogenetic tree of five sheep populations based on nei’s genetic distance (DA).
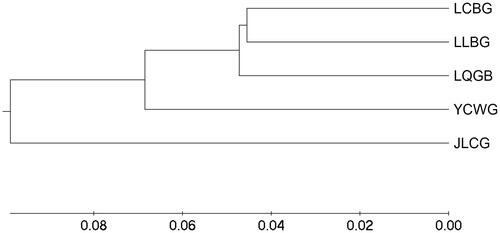
Table 7. Nei’s unbiased measures (1978) of genetic identity and genetic distance.
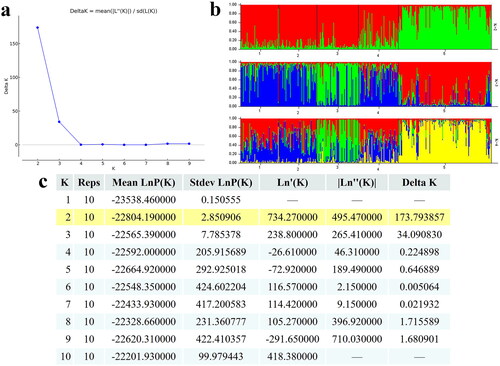
STRUCTURE software was used for clustering individuals into 2 ≤ K ≤ 10 (). The best K value is 2 according to ΔK = mean (| L″(K)|)/sd (L(K)). The JLCG population exhibits significant genetic differentiation compared to the other four populations, and most of the genetic information of LCBG, LLBG, YCWG and LQGB shows similar ancestral sources. The clustering results were highly consistent with the UPGMA phylogenetic tree.
Figure 3. Population structure analysis of five goat populations using model-based clustering method. the abscissa value 1, 2, 3, 4 and 5 in represent LCBG, LLBG, YCWG, LQGB, and JLCG, respectively.
Discussion
Shanxi Province of China is rich in genetic resources and it has a long history of raising sheep. Licheng big green goat (LCBG), Lvliang black goat (LLBG), Yangcheng white goat (YCWG), Lingqiu green back goat (LQGB) and Jinlan cashmere goat (JLCG) are all local goat breeds in Shanxi, China. They generally have the advantages of strong adaptability, tolerance to rough feeding, disease and stress resistance. In addition, they also possess certain excellent production performance, such as meat, skin or cashmere. Lacking of systematic comprehensive and understanding of the genetic diversity and characteristics of these local goat breeds has led to a sharp decline in population size and the loss of excellent trait genes. Therefore, it is particularly important to evaluate and protect the local goat breed resources in Shanxi reasonably and effectively.
In the study, we first estimated the diversity of 394 goats from five indigenous populations using 15 microsatellite markers. NA showed the number of alleles, reflecting their polymorphism, while NE indicates population genetic variation. Hines et al.Citation20 pointed out that the closer the values of NE and NA are, the more evenly distributed the alleles in the population. There is a deviation between NA and NE values for all loci. This result indicates that the distribution of alleles in the population is uneven, which may be caused by artificial breeding. Heterozygosity (HO and HE) in the 15 loci also showed a high value. According to Botstein et al,Citation21 microsatellite loci are highly polymorphic with PIC > 0.5, followed by moderate polymorphic loci (0.25 < PIC < 0.5) and low polymorphic loci (PIC < 0.25). The PIC values observed for all loci in the study are all more than 0.5. All the above results showed a high diversity of microsatellite loci across the five goat populations, suggesting that these markers were adequate for assessing the diversity of these populations. In addition, several markers (OarHH35, OarAE54, MAF065, TGLA53, INRA023 and OarFCB48) showed a deviation from HWE, which could have been due to the small sample size or the potential occurrence of recent population genetic events.Citation13
In the five populations, we found a high degree of genetic diversity, which could be due to the greater genetic diversity of the animals’ ancestors.Citation22 Among them, LLBG has the highest values of NA, NE, HO, HE and PIC, while the lowest value of genetic parameters HO, HE and PIC in population JLCG were found. Berihulay et al.Citation3 measured the genetic diversity of six Chinese goat populations and found all the breeds showed sustained high levels of genetic variability; Zhao et al.Citation23 also proved to be extremely diverse in 33 Chinese domestic goats. In addition, Dixit et al.Citation24 and Hussain et al.Citation25 also revealed a high genetic diversity of goat breeds in Indian and Pakistani, two neighboring countries with China. These findings were consistent with the results of our study on local goat breeds in China. Genetic diversity is the fundamental source of population evolution and adaptation,Citation26 and excellent germplasm resources are generally easier to obtain from populations with high genetic diversity.
Drastic reductions in the effective size of a population may result in demographic bottlenecks and can affect within-breed genetic variability—particularly allelic diversity.Citation27 Hence, the occurrence of demographic bottleneck needs to be monitored genetically from a conservation stand point as well and bottleneck analysis needs to be performed. BOTTLENECK is written in the Delphi 4 computer language. The performance of BOTTLENECK has been thoroughly evaluated using simulated datasetsCitation28,Citation29 and allozyme and microsatellite datasets.Citation30 The IAM model is recommended for allozyme data, and the SMM is generally more appropriate when testing microsatellite loci.Citation30 For most microsatellites, the TPM is apparently even more appropriate than the SMM.Citation31,Citation32 On the other hand, it has been reported that the Wilcoxon test has high statistical confidence even in bottleneck analysis studies using a limited number of loci (<20).Citation30 The result of the Wilcoxon sign rank test in our study showed all the five goat breeds exhibit heterozygosity excess under the IAM model, while it was not found under the models of SMM and TPM. Considering the research findings of Di Rienzo et al.,Citation31 Luikart et al.Citation32 and Luikart and Cornuet Citation30 mentioned above, we believe that the studied five goat populations did not experienced bottlenecks in the past with the TPM Wilcoxon test method. Moreover, the qualitative test for mode-shift distortion revealed a normal L-shaped distribution of allele frequencies for all five breeds. All the above results indicate the absence of recent genetic bottlenecks in five goat populations.
Defined by Sewall Wright,Citation33 FST measures population genetic differentiation with low (FST < 0.05), moderate (0.05–0.15), high (0.15–0.25) and extremely high (FST > 0.25) genetic differentiation. The average FST value of all loci is 0.0303, indicating that approximately 3.03% of the microsatellite variations in the five breeds come from inter-variety differentiation. It is different from the research on goats in Southwest China (0.129),Citation22 East Asian populations (0.13)Citation34 and European breeds (0.07),Citation35 and significant population differentiation were found in their research. FIS (−0.0159) in our study shows no loss of heterozygosity overall, while single site analysis revealed that BMS1788, OarAE54, SRCRSP5, MAF065, TGLA53 and INRA023 were all heterozygous deletions (FIS > 0). In the study of Liu et al.,Citation36 FIS had a positive value in all thirty microsatellite markers across 26 Chinese indigenous goat breeds. Another study on local goats in China also found that FIS > 0 in 30 microsatellites.Citation22 The main reasons for the positive values of the FIS are the existence of inbreeding and excess homozygosity. The average Gene flow (Nm) is 8.6038. The five goat breeds are all located in Shanxi province and do not have obvious geographical isolation. Long term natural and artificial selection did not result in significant genetic differentiation among them.
Pairwise genetic differentiation indexes (FST) were not more than 0.05 among all the five populations in the study, which showed a low state of genetic differentiation. The lowest FST value was found between LCBG and LLBG, while the highest value occurs between LCBG and JLCG. In addition, we found that the FST values between JLCG and the other three groups were also high, indicating a deviation of JLCG from the other breeds. Combining genetic distance (DA), it is found that JLCG has the largest DA value with the other four populations. UPGMA phylogenetic tree shows that JLCG is clustered separately in a group and structure analysis also reveals that the population structure of JLCG is significantly different from the other four breeds. All the above information collectively indicates that breed JLCG deviates from the other four groups.
Nei’s unbiased measures of genetic distance (DA) and genetic identity (GI) showed that the lowest DA (0.0910) value and the highest GI (0.913) were found between LLBG and LCBG. The higher the GI values are between populations, the closer the genetic relationship is, while the meaning of DA is the opposite. Therefore, LLBG and LCBG have the closest genetic relationship. In addition, population structure analysis reveals that LLBG and LCBG exhibit the most similar changes with K values. The above results indicate that LLBG and LCBG have the closest genetic relationship in these five groups.
Conclusion
In the study, we estimated the diversity and population of 394 goats in five populations across 15 microsatellite loci. The results show that all populations have high genetic diversity and recent genetic bottlenecks didn’t occur in the five goat populations. LLBG and LCBG have the closest genetic relationship and their population structure is also very similar. JLCG has the longest Genetic distance from other breeds, and its population structure is quite different. The results of the study are helpful for the understanding of the local goat diversity and population structure in Shanxi and could be used to support the formulation of new development and protection strategies.
Authors contributions
Conceptualization, P.Z. and L.Z; methodology, P.Z., L.Z. and Z.W.; validation, Y.L., H.G., J.L. and S.W.; formal analysis, L.Z.; investigation, H.G., S.W., Z.G. and H. Y.; resources, Y.L., H.G., J.L., S.W. and Z.G.; writing—original draft prepa-ration, P.Z. and L.Z.; writing—review and editing, L.Z. All authors have read and agreed to the published version of the manuscript.
Institutional review board statement
All experiments involving animals were authorized by the Animal Ethics Committee of Shanxi Agricultural University.
Disclosure statement
No potential conflict of interest was reported by the author(s).
Additional information
Funding
References
- Li ZJ, Lan XY, Guo WJ, et al. Comparative transcriptome profiling of dairy goat microRNAs from dry period and peak lactation mammary gland tissues. PLOS One. 2012;7(12):e52388.
- Li WC, Wang K, Gu Y. Occurrence of Blastocystis sp. and Pentatrichomonas hominis in sheep and goats in China. Parasit Vectors. 2018;11(1):93.
- Berihulay H, Li Y, Liu X, et al. Genetic diversity and population structure in multiple Chinese goat populations using a SNP panel. Anim Genet. 2019;50(3):242–249.
- Ahmed M, Singh MN, Bera AK, et al. Molecular basis for identification of species/isolates of gastrointestinal nematode parasites. Asian Pac J Trop Med. 2011;4(8):589–593.
- Na R, Ni W, E G, et al. SNP screening of the MSTN gene and correlation analysis between genetic polymorphisms and growth traits in Dazu black goat. Anim Biotechnol. 2021;32(5):558–565.
- Menezes MPC, Martinez AM, Filho ECP, et al. Diversity analysis and genetic relationships among local Brazilian goat breeds using SSR markers. Animals. 2020;10(10):1842.
- Marikar FMMT, Musthafa MM. Usefulness of short sequence repeat markers in goat genetic diversity studies on the Asian and African continents. Turk J Vet Anim Sci. 2014;38(6):606–611.
- Agarwal M, Shrivastava N, Padh H. Advances in molecular marker techniques and their applications in plant sciences. Plant Cell Rep. 2008;27(4):617–631.
- Skinner DM, Beattie WG, Blattner FR, et al. The repeat sequence of a hermit crab satellite deoxyribonucleic acid is (-T-A-G-G-)n-(-A-T-C-C-)n. Biochemistry. 1974;13(19):3930–3937.
- Singh L, Purdom IF, Jones KW. Sex chromosome associated satellite DNA: evolution and conservation. Chromosoma. 1980;79(2):137–157.
- Hamada H, Petrino MG, Kakunaga T. A novel repeated element with Z-DNA-forming potential is widely found in evolutionarily diverse eukaryotic genomes. Proc Natl Acad Sci U S A. 1982;79(21):6465–6469.
- Miah G, Rafii MY, Ismail MR, et al. A review of microsatellite markers and their applications in rice breeding programs to improve blast disease resistance. Int J Mol Sci. 2013;14(11):22499–22528.
- E G-X, Zhao Y-J, Chen L-P, et al. Genetic diversity of the Chinese goat in the littoral zone of the Yangtze River as assessed by microsatellite and mtDNA. Ecol Evol. 2018;8(10):5111–5123.
- E G-X, Hong Q-H, Zhao Y-J, et al. Genetic diversity estimation of Yunnan indigenous goat breeds using microsatellite markers. Ecol Evol. 2019;9(10):5916–5924.
- Ceccobelli S, Lasagna E, Demir E, et al. Molecular identification of the “Facciuta Della Valnerina” local goat population reared in the Umbria Region, Italy. Animals. 2020;10(4)
- Piry S, Luikart G, Cornuet JM. Bottleneck: a computer program for detecting recent reductions in the effective population size using allele frequency data. Proceedings of the Aps Meeting; 2001.
- Peakall R, Smouse PE. GenAlEx 6.5: genetic analysis in Excel. Population genetic software for teaching and research–an update. Bioinformatics. 2012;28(19):2537–2539.
- Excoffier L, Lischer HE. Arlequin suite ver 3.5: a new series of programs to perform population genetics analyses under Linux and Windows. Mol Ecol Resour. 2010;10(3):564–567.
- Pritchard JK, Stephens M, Donnelly P. Inference of population structure using multilocus genotype data. Genetics. 2000;155(2):945–959.
- Hines HC, Zikakis JP, Haenlein GF, et al. Linkage relationships among loci of polymorphisms in blood and milk of cattle. J Dairy Sci. 1981;64(1):71–76.
- Botstein D, White RL, Skolnick M, et al. Construction of a genetic linkage map in man using restriction fragment length polymorphisms. Am J Hum Genet. 1980;32(3):314–331.
- Wei C, Lu J, Xu L, et al. Genetic structure of Chinese indigenous goats and the special geographical structure in the Southwest China as a geographic barrier driving the fragmentation of a large population. PLOS One. 2014;9(4):e94435.
- Zhao Y, Zhao R, Zhao Z, et al. Genetic diversity and molecular phylogeography of Chinese domestic goats by large-scale mitochondrial DNA analysis. Mol Biol Rep. 2014;41(6):3695–3704.
- Dixit SP, Verma NK, Aggarwal R, et al. Genetic diversity and relationship among southern Indian goat breeds based on microsatellite markers. Small Rumin Res. 2010;91(2-3):153–159.
- Hussain T, Shaheen M, Babar ME, et al. Molecular diversity analysis of Jattal and Dera Din Panah goat breeds of Pakistan using microsatellite markers. J Hellenic Vet Med Soc. 2018;69(1):791.
- Hague MTJ, Routman EJ. Does population size affect genetic diversity? A test with sympatric lizard species. Heredity (Edinb). 2016;116(1):92–98.
- Bradshaw CJ, Isagi Y, Kaneko S, et al. Low genetic diversity in the bottlenecked population of endangered non-native Banteng in northern Australia. Mol Ecol. 2007;16(14):2998–3008.
- Cornuet JM, Luikart G. Description and power analysis of two tests for detecting recent population bottlenecks from allele frequency data. Genetics. 1996;144(4):2001–2014.
- Luikart G, Allendorf FW, Cornuet JM, et al. Distortion of allele frequency distributions provides a test for recent population bottlenecks. J Hered. 1998;89(3):238–247.
- Luikart G, Cornuet JM. Empirical evaluation of a test for identifying recently bottlenecked populations from allele frequency data. Conserv Biol. 1998;12(1):228–237.
- Di Rienzo A, Peterson AC, Garza JC, et al. Mutational processes of simple-sequence repeat loci in human populations. Proc Natl Acad Sci U S A. 1994;91(8):3166–3170.
- Luikart G, Sherwin WB, Steele BM, et al. Usefulness of molecular markers for detecting population bottlenecks via monitoring genetic change. Mol Ecol. 1998;7(8):963–974.
- Wright S. The genetical structure of populations. Ann Eugen. 1951;15(4):323–354.
- Nomura K, Ishii K, Dadi H, et al. Microsatellite DNA markers indicate three genetic lineages in East Asian indigenous goat populations.Anim Genet, 2012, 43(6): 760–767.
- Cañón J, García D, García-Atance MA, et al. Geographical partitioning of goat diversity in Europe and the Middle East. Anim Genet. 2006;37(4):327–334.
- Liu G, Zhao QJ, Lu J, et al. Insights into the genetic diversity of indigenous goats and their conservation priorities. Asian-Australas J Anim Sci. 2019;32(10):1501–1510.