
Abstract
At various stages of ovarian follicular development, more than 99% of follicles will be eliminated through a degenerative process called atresia. The regulatory mechanisms of atresia have been elucidated to some extent, involving hormones, growth factors, cytokines, and other factors. However, the stimuli initiating atresia in follicular granulosa cells remain unknown. In this study, we isolated the granulosa cells from porcine ovarian follicles (3–5 mm diameter) divided into healthy follicles (HFs) and early atretic follicles (EAFs). We applied high-throughput RNA sequencing to identify and compare differentially expressed genes (DEGs) between HFs and EAFs. A total of 31,694 genes were detected, of which 21,806 were co-expressed in six samples, and 243 genes (p < 0.05; FDR < 0.05) were differentially expressed (DEGs), including 123 downregulated and 120 upregulated in EAFs. GO analysis highlighted hormone metabolism, plasma membrane localization, and transporter activity. The pathway analysis indicated that 51 DEGs, involved in steroidogenesis, cell adhesion molecules, and TGF-beta signaling pathways, were highly related to atresia. Additionally, the interaction network of DEGs (p < 0.01; FDR < 0.05) using STRING highlighted LHR, ACACB, and CXCR4 as central nodes. In summary, this transcriptome analysis enriched our knowledge of the shifted mechanisms in granulosa cells during early atresia and provided novel perspectives into the atresia initiation.
Introduction
In mammalian ovaries, only a few follicles develop to the pre-ovulatory stage and ovulate; more than 99% of all follicles undergo atresia during the overall process of follicular growth and development.Citation1 Ovarian follicles are a complex system containing oocytes, cumulus cells, mural granulosa cells (GCs), and the cells of internal or external theca layers. Recently, numerous studies have focused on the role of GCs in follicular growth and atresia. On the one hand, GCs can secrete factors such as estradiol and IGF, which are essential for follicular development.Citation2–6 On the other hand, in the GCs, inducers of apoptosis, including members of the mitochondrion-dependent pathways or their downstream cell death ligands and receptors, were upregulated during follicular atresia, indicating the contributions of GC apoptosis to follicular atresia.Citation2,Citation7 However, the signal transduction between each constituent in whole follicles and the initiator of follicular atresia is poorly understood. A better knowledge of these events could inform strategies to improve fertility and in vitro fertilization outcomes.
A number of studies in antral follicles have tried to reveal the atresia triggers by transcriptome profiling of GCs, which are believed to be the primary cause of atresia. Expression profiles of porcine small (1–2 mm) healthy and atretic follicles were compared using a 9,216 cDNA microarray and found 287 genes to be differentially regulated. In addition to apoptosis-related genes, tumor suppressors were highlighted.Citation8 The differences between healthy and atretic follicles at early antral stages (<5 mm) were profiled and compared in bovine, and the results suggested that cell division and other growth-related functions are more active in healthy follicles.Citation9 In the previous research, we utilized microarray technology to identify genes differentially expressed during follicle growth and atresia in porcine antral follicles.Citation10 However, RNA sequencing (RNA-seq) offers more comprehensive transcriptome profiling and has been minimally applied to the study of the atresia of porcine antral follicles.
In this study, we used RNA-seq to generate transcriptome profiles of GCs from porcine middle-sized (3–5 mm) antral follicles between healthy and early atretic stages. Differential expression gene analysis identifies crucial factors and pathways inducing atresia. We then constructed a network to explore interactions among differentially expressed genes (DEGs). Our study provides reliable insights into ovarian folliculogenesis and establishes a foundation to identify initiators of follicular atresia.
Materials and methods
Animals and sample collection
The ovaries used in this study were obtained from
After routine slaughtering procedures, 7-month-old, healthy, unstimulated replacement commercial Duroc × Landrace × Yorkshire gilts at a local slaughterhouse. Ovaries were collected, washed, and transported to the laboratory as soon as possible with PBS containing 100 IU/L penicillin and 50 mg/L streptomycin. Individual 3–5 mm in diameter antral follicles were dissected from the ovaries using ophthalmic scissors and fine forceps under a surgical stereoscope. The healthy (HF) and early atresia (EAF) follicles were classified as described in our previous study.Citation10 We picked 18 follicles for sequencing, including HF (n = 9) and EAF (n = 9). Then, GCs from three follicle samples of each group were collected and randomly pooled together as one mixed sample to generate three mixed samples for each group. Additionally, 20 follicles including HF (n = 10) and EAF (n = 10) were picked for qPCR verification.
RNA isolation and library construction
Total RNA was isolated from the GCs of the HFs and EAFs using TRIzol reagent (Invitrogen, CA, USA) and further purified with RNeasy mini kit (Qiagen) according to the manufacturer’s instructions. The integrity test of purified total RNA was assessed by 1% agarose gels and was checked using the NanoPhotometer® spectrophotometer (IMPLEN, CA, USA). The mRNA libraries were sequenced on an Illumina HiSeq4000 platform by Gene Denovo Biotechnology Co. (Guangzhou, China).
Quality control and read mapping
The raw paired-end reads were trimmed and quality controlled by fastpCitation11 with default parameters. The high-quality reads were aligned to the Sus scrofa genome (SusScr3) using Hisat2Citation12 software.
Differential gene expression analysis
The DESeq package in the R statistical language and environment (version 3.0.2) was used to calculate the reads per kilobase per million (RPKM). The number of fragments per kilobase of exon length million mapped reads (FPKM) was analyzed by the DESeq package in the R statistical environment (version 3.0.2) to evaluate the normalized gene expression. Differentially expressed genes (DEGs) were identified using the statistical significance of the absolute value of fold change >2.0 and p < 0.05 between the HF and the EAF groups.
GO enrichment and KEGG analysis
Functional enrichment analysis Gene ontology (GO) and pathway analysis of DEGs were conducted using the Gene Ontology (http://www.geneontology.org/) and KEGG (http://www.genome.jp/kegg/), respectively, as previously described.Citation13
qRT-PCR validation
qRT-PCR was used to validate the sequencing data. The extracted total RNA was reverse transcribed to generate cDNA using a Super M-MLV RTase Synthesis Kit, and qRT-PCR was performed using SYBR Premix Ex Taq (Takara, Dalian, China) on an ABI StepOne system (Applied Biosystems, Carlsbad, CA, USA) according to the manufacturer’s instructions. The primers used are listed in Supplementary Table 1. GAPDH was used as an internal control. The relative expression level was measured using the comparative 2–ΔΔCt method.Citation14
Statistical analysis
All experiments were repeated thrice, and the data were presented as mean ± standard deviation. The data were analyzed using the SPSS software version 20.0 (SPSS Inc., Chicago, IL, USA). A T-test was used to analyze the significance of statistics. p-Values <0.05 were statistically significant.
Results
Overview of RNA-sequencing
To investigate the mechanism of early follicular atresia, we conducted a comparative transcriptomic analysis between three healthy and three early atretic antral follicles and built a total of six cDNA libraries (HF1, HF2, HF3, EAF1, EAF2, and EAF3). RNA sequencing showed 6,236,904,422 clean reads with an average of more than 100 million (ranging from 88 million to 118 million) for each library. More than 80% of the clean reads were mapped to the pig genome (). Additionally, after generating a transcriptome assembly, unigene coverage was mostly >65% for genes of different lengths, conforming to the standardized normal distribution in biology (). These results imply that all libraries were of good quality.
Figure 1. Gene distribution and expression profiles. (A) Length distribution of transcripts and unigenes. (B) Box plot showing overall RPKM expression values of each sample. (C) The RPKM density distribution of unigenes. (D) Principal component analysis (PCA) of the gene expression data (the principal components 1 and 2 accounted for 59.7 and 37.5 of variance).
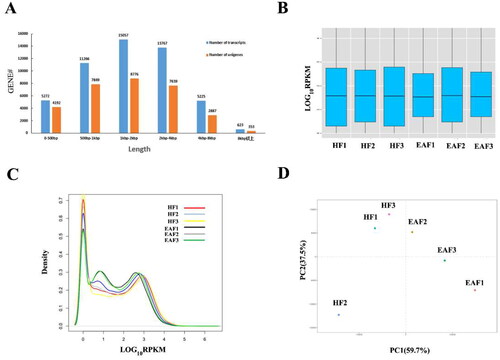
Table 1. Summary of sequencing reads aligned with the Sus scrofa genome and mapped genes.
A total of 31,694 genes were detected as expressed in the GCs of ovarian follicles, of which 21,805 genes had co-occurrence of expression across the six samples. To detect gene expression levels and correlations between samples, we generated box plots of relative expression values (RPKM) and RPKM distribution curves using R software (). According to the results, the overall RPKM expression values were largely comparable across the six samples, which showed a balanced sampling and sequencing. More importantly, the principal component analysis (PCA) revealed a divergent expression pattern between HF and EAF ().
Differentially expressed genes in follicle atresia
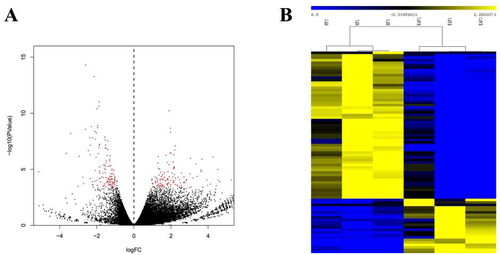
The volcano plot shows that 243 differentially expressed genes (DEGs) separated the two experimental groups corresponding to HF and EAF status (|log2(fold change)| ≥ 1, p-value <0.05, FDR < 0.05, and RPKM > 100). Among the 243 genes, 123 were upregulated in EAFs, and 120 were down-regulated (; Supplementary Table 2). Hierarchical clustering showed distinguishable expression patterns of DEGs in each sample ().
Figure 2. Volcano map and hierarchical clustering analysis showing the expression profiles between HF and EAF. (A) Volcano maps show the detected DEGs. Red dots represent the DEGs with corrected p < 0.05 and |log2(fold change)| ≥ 1, FDR < 0.05, and RPKM > 100. (B) The heatmap shows the hierarchical clustering of DEGs. Yellow represents the upregulated genes, and blue represents the downregulated ones.
Gene ontology analysis of DEGs
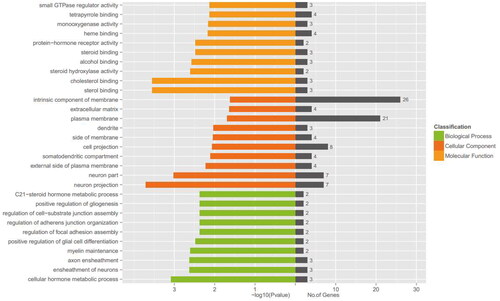
To gain insight into the functions of the DEGs, we conducted a gene ontology analysis. A total of 46 DEGs were classified under Biological Process, 22 DEGs under Cellular Component, and 68 DEGs under Molecular Function (). A significant enrichment of DEGs in cellular hormone metabolic processes, ensheathment of neurons, and axon ensheathment was observed, which implied essential roles in the regulation of ovarian follicle development and atresia. Also, the fact that DEGs were predominantly abundant in the plasma membrane and intrinsic components of the membrane suggested that the identified DEGs may participate in the regulation of cellular signaling pathways and cell-cell communication in ovarian follicles. The Molecular Function category was primarily enriched in sterol binding, cholesterol binding, and steroid hydroxylase activity, which is related to regulating steroid hormone synthesis and metabolism in the follicles.
Figure 3. GO enrichment analysis of DEGs. The No. of genes indicates the number of inputs of DEGs annotated to the category, and the X-axis represents − log10 (p value).
Pathway analysis
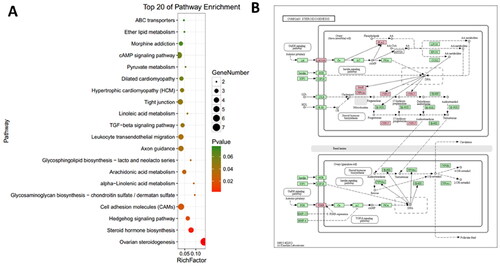
Furthermore, KEGG pathway analysis was conducted to investigate the interrelationships between DEGs, and 13 pathways, including ovarian steroidogenesis, steroid hormone biosynthesis, cell adhesion molecules, TGF-beta signaling pathway, and tight junctions were significantly enriched with a p-value less than 0.05 (). Notably, the ovarian steroidogenesis pathway () was found to be particularly relevant to the DEGs, with key genes such as luteinizing hormone/choriogonadotropin receptor (LHCGR), steroidogenic acute regulatory protein (STAR), and cytochrome P450 family 17 subfamily A member 1 (CYP17) being prominently shifted during atresia.
Figure 4. The pathway analysis of DEGs. (A) KEGG enrichment analysis of DGEs. The size of each dot represents the number of DEGs enriched in the corresponding pathway. (B) The ovarian steroidogenesis pathway with DEGs is highlighted in pink.
Network interaction of DEGs
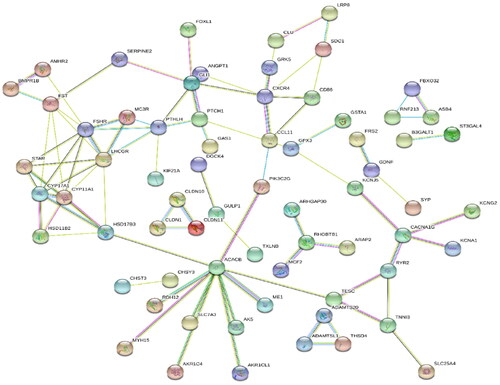
To further explore the molecular interactions of the DEGs network, we implemented a network interaction analysis using the STRING database, which offers extensive coverage and convenient accessibility to both experimental and predicted interaction data (). The regulatory interconnections among 159 DEGs were identified. The analysis revealed that luteinizing hormone receptor (LHR), acetyl-CoA carboxylase beta (ACACB), and C-X-C motif chemokine receptor 4 (CXCR4) were central hubs within the interaction network. This result implied that the main activity during atresia within GCs may be the reception of pituitary hormones and activation of the fatty acid synthesis involved in steroidogenesis via cell signalings.
Figure 5. Protein–protein interaction network of DEGs. Lines of different colors represent seven types of evidence used in predicting associations. red: fusion evidence; green line: neighborhood evidence; blue: co-occurrence evidence; purple: experimental evidence; yellow: text mining evidence; light blue: database evidence; black: co-expression evidence.
Verification of DEGs
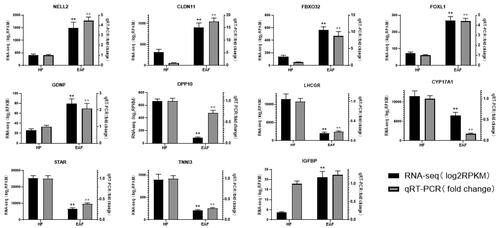
To confirm the results of RNA-seq, eleven DEGs including 6 upregulated genes (GDNF, NELL2, CLDN11, FOXL1, FBXO32, IGFBP) and 5 down-regulated genes (DPP10, CYP17A1, LHCGR, TNNI3, STAR) were selected and validated by qPCR (). The results were perfectly in tune with those obtained with RNA-seq, which further indicate that the RNA-seq results are reliable and can represent the virtual expression pattern between HF and EAF follicles.
Figure 6. qPCR validation of 11 DEGs between HF and EAF. The black columns represent the log2RPKM value (left Y-axis) generated by RNA-seq, and the grey columns represent the qPCR fold changes (right Y-axis) and are expressed as means of three samples. **p < 0.01.
Discussion
Previous studies have investigated various factors that could trigger follicular atresia during folliculogenesis, including hormone stimuli, oxidative stress, and nutritional status. Under natural conditions, GC plays a vital role in follicular growth and atresia. Once follicles undergo atresia, apoptosis is observed in GCs earlier than in oocytes and theca cells.Citation15 Factors secreted by GCs, such as estradiol and insulin-like growth factor (IGF), are considered essential for follicular growth, while death-ligand-receptor-induced and mitochondrial-controlled apoptotic pathways are activated in GCs once follicles undergo atresia.Citation10,Citation16,Citation17 This study used RNA sequencing to identify the shifted expression patterns in GCs of healthy and early atretic middle-sized porcine ovarian follicles. The results further hinted at the critical factors in follicle atresia initiation and established the network among these factors.
Pituitary hormone receptors and steroidogenesis
The hypothalamus-pituitary-gonadal (HPG) axis is a complex hormonal system that plays a crucial role in the production and regulation of sex hormones and the control of reproductive processes. In the ovary follicles, two important pituitary hormone receptors FSHR and LHCGR exist in GCs and thus regulate the biogenesis of gonadal hormones.Citation18 In our previous work to detect the expression patterns of the whole follicle using microarrays, the drop of STAR and CYP19A1 was observed.Citation10 Here, in separated GCs, we observed a downregulation of STAR, CYP19A2, and CYP17A1, suggesting an impairment of E2 production during atresia. STAR is essential for the initial and rate-limiting step in steroid biosynthesis, which involves the transfer of cholesterol to the inner mitochondrial membrane, where P450scc converts cholesterol into pregnenolone. After HSD17B3 transfers pregnenolone into progesterone, CYP19A2 finally plays a key role in E2 production.Citation19 HSD17B3 was detected at a shallow level in both HF and EAF, which suggested that the transformation from pregnenolone to progesterone is almost stopped.
Interestingly, we also observed a significant decrease of LHR and an increase of FSHR, which showed no significant shift in whole follicle samples. This difference may be due to the possible opposite expression trend of these receptors in GCs and the theca cells, which are the main component of the rest of the follicle. Also, raising FSHR might be a feedback regulatory mechanism for the GCs to rescue or block atresia. It is worth noticing that the expression level of a neurotrophin, glial cell line-derived neurotrophic factor (GDNF), was detected to increase during atresia. GDNF was shown to promote neuron survival, growth, and differentiation. In the reproduction area, the supplementation of GDNF promoted primordial follicle activation in rodentsCitation20 and humansCitation21 and regulated oocyte maturation and early embryo development in bovine.Citation22 Therefore, the role of GDNF and the other members of the GDNF family in folliculogenesis and atresia is worth further study.
TGF-β signaling pathway
The transforming growth factors β (TGF-β) superfamily have been shown to be indispensable for oocyte formation, and the BMP/Smad signaling pathway is deeply involved in follicle development and ovulation.Citation23,Citation24 In pigs, multiple core members of this signaling pathway, such as BMP5, 6, 7, 15, and BMPR1B, have been identified as candidate genes responsible for reproductive traits.Citation25 In the present study, two members of the TGF-β superfamily, BMPR1B, and AMHR2, were observed to be significantly down-regulated in the EAFs. BMPR1B is a fecundity-determining gene expressed in the GCs of growing follicles. As the receptor of GDF5 and BMP4, BMPR1B interacts with these ligases and inhibits the P4 secret by GCs in sheep. BMPR1B is an essential anti-apoptotic cytokine found in ovine GCs.Citation26 Therefore, BMPR1B must have played an important role in atresia initiation. In addition, the anti-mullerian hormone (AMH) produced by GCs may play a pivotal role in GC differentiation and follicle selection. AMH signals through its Type II receptor, AMHR2, which is expressed in GCs. It has been reported that FSH inhibits AMH expression, and AMH signaling suppresses CYP19A1 expression and GC proliferation to maintain GC in an undifferentiated state in cattle.Citation27 This result was inconsistent with our observation of increased FSHR and decreased AMHR2 expression and implied possible cooperation of FSH/AMH during follicle atresia.
The apoptosis and autophagy
Previous studies pointed out that the apoptosis of GCs triggers atresia of the ovarian follicles.Citation2 In this study, we did not detect a dramatic shift of classical apoptosis-associated genes as expected, although some apoptosis-associated genes, TNFSF10 and FAS, still showed increased trends. We attribute this result to our classification of early atretic follicles and the process for GCs collection. In the early stage of atresia, the number of GC that go through apoptosis is relatively small, and the intact and robust cells are more likely to be collected during the washing and centrifugation processes. However, apoptosis-associated transcriptional factors, forkhead box L1 (FOXL1) were observed to be upregulated during atresia. In pancreatic cancer cells, FOXL1 co-expression with PP2A could promote the transcription of TRAIL to induce apoptosis.Citation28
Additionally, we noticed some significantly increased genes that were reported to prevent apoptosis of neurons but have not been previously reported in the ovary, including neural EGFL Like 2 (NELL2) and F-box only protein 32 (FBXO32). NELL2 gene was reported to be trans-activated by E2 and contributes to mediating the survival-promoting effects of E2 via the intracellular signaling pathway of ERK.Citation29 In contrast, FBXO32 was reported to be necessary for autophagosome formation, and its overexpression triggers apoptosis in cultured cells and neurons.Citation30 The upregulation of NELL2 and drop of FBXO32 revealed novel apoptotic networks during ovarian atresia.
In summary, we have identified the shifted transcription profiles in GCs between healthy and early atretic follicles and revealed the initial mechanism of follicle atresia. The study enriched our knowledge and provided novel perspectives on folliculogenesis and atresia.
Authors’ contributions
Conception and design: J.Z. and Z.P.; Manuscript preparation: J.Z. and J.L.; Manuscript revision/review: Z.P. and S.X.; Animal and laboratory experiments: C.W., X.Q., Y. Z., and Y. D.; Interpretation, final approval of the manuscript: Z.P.
Ethics statement
All experiments were conducted according to the guidelines and were approved by the Animal Ethics Committee of Nanjing Agricultural University, Nanjing, Jiangsu, China.
Supplemental Material
Download MS Excel (58.6 KB)Supplemental Material
Download MS Word (27.5 KB)Disclosure statement
We certify no conflict of interest with any financial organization regarding the material discussed in the manuscript. All authors have read and approved the final manuscript.
Additional information
Funding
References
- Tilly LJ, Kowalski KI, Johnson AL, Hsueh AJ. Involvement of apoptosis in ovarian follicular atresia and postovulatory regression. Endocrinology. 1991;129(5):2799–2801.
- Yu YS, Sui HS, Han ZB, Li W, Luo MJ, Tan JH. Apoptosis in granulosa cells during follicular atresia: relationship with steroids and insulin-like growth factors. Cell Res. 2004;14(4):341–346.
- Orisaka M, Tajima K, Tsang BK, Kotsuji F. Oocyte-granulosa-theca cell interactions during preantral follicular development. J Ovarian Res. 2009;2(1):9.
- Lin F, Fu YH, Han J, et al. Changes in the expression of Foxo1 and death ligand genes during follicular atresia in porcine ovary. Genet Mol Res. 2014;13(3):6638–6645.
- Shen M, Liu Z, Li B, et al. Involvement of FoxO1 in the effects of follicle-stimulating hormone on inhibition of apoptosis in mouse granulosa cells. Cell Death Dis. 2014;5(10):e1475–e1475.
- Shen M, Cao Y, Jiang Y, Wei YH, Liu HL. Melatonin protects mouse granulosa cells against oxidative damage by inhibiting foxo1-mediated autophagy: implication of an antioxidationin-dependent mechanism. Redox Biol. 2018;18:138–157.
- Tilly JL. The molecular basis of ovarian cell death during germ cell attrition, follicular atresia, and luteolysis. Front Biosci. 1996;1(4):d1–11.
- Terenina E, Fabre S, Bonnet A, et al. Differentially expressed genes and gene networks involved in pig ovarian follicular atresia. Physiol Genomics. 2017;49(2):67–80.
- Hatzirodos N, Irving-Rodgers HF, Hummitzsch K, Harland ML, Morris SE, Rodgers RJ. Transcriptome profiling of granulosa cells of bovine ovarian follicles during growth from small to large antral sizes. BMC Genomics. 2014;15(1):24.
- Zhang J, Liu Y, Yao W, Li Q, Liu H, Pan Z. Initiation of follicular atresia: gene networks during early atresia in pig ovaries. Reproduction. 2018;156(1):23–33.
- Chen S, Zhou Y, Chen Y, Gu J. fastp: an ultra-fast all-in-one FASTQ preprocessor. Bioinformatics. 2018;34(17):i884–i890.
- Kim D, Langmead B, Salzberg SL. Hisat: a fast spliced aligner with low memory requirements. Nat Methods. 2015;12(4):357–360.
- Liu JG, Ning CB, Li BJ, Li RY, Wu WJ, Liu HL. Hepatic micrornaome reveals potential microRNA-mRNA pairs association with lipid metabolism in pigs. Asian-Australas J Anim Sci. 2019;32(9):1458–1468.
- Livak KJ, Schmittgen TD. Analysis of relative gene expression data using real-time quantitative PCR and the 2(T)(-delta delta C) method. Methods. 2001;25(4):402–408.
- Irving-Rodgers HF, van Wezel IL, Mussard ML, Kinder JE, Rodgers RJ. Atresia revisited: two basic patterns of atresia of bovine antral follicles. Reproduction. 2001;122(5):761–775.
- Matsuda F, Inoue N, Manabe N, Ohkura S. Follicular growth and atresia in mammalian ovaries: regulation by survival and death of granulosa cells. J Reprod Dev. 2012;58(1):44–50.
- Regan S, Knight PG, Yovich JL, Leung Y, Arfuso F, Dharmarajan A. Granulosa cell apoptosis in the ovarian follicle-a changing view. Front Endocrinol. 2018;9:61.
- Suocheng W, Zhuandi G, Li S, Haoqin L, Luju L, Yingying D. Maturation rates of oocytes and levels of FSHR, LHR and GnRHR of COCs response to FSH concentrations in IVM media for sheep. J Appl Biomed. 2017;15(3):180–186.
- Kim J-M, Park J-E, Yoo I, et al. Integrated transcriptomes throughout swine oestrous cycle reveal dynamic changes in reproductive tissues interacting networks. Sci Rep. 2018;8(1):5436.
- Dole G, Nilsson EE, Skinner MK. Glial-derived neurotrophic factor promotes ovarian primordial follicle development and cell–cell interactions during folliculogenesis. Reproduction. 2008;135(5):671–682.
- Farhi J, Ao A, Fisch B, Zhang XY, Garor R, Abir R. Glial Cell line-derived neurotrophic factor (GDNF) and its receptors in human ovaries from fetuses, girls, and women. Fertil Steril. 2010;93(8):2565–2571.
- Wang DH, Hong XZ, Shu JL, et al. Glial cell line-derived neurotrophic factor supplementation promotes bovine invitro oocyte maturation and early embryo development. Theriogenology. 2018;113:92–101.
- Du X, Pan Z, Li Q, Liu H, Li Q. SMAD4 feedback regulates the canonical TGF-B signaling pathway to control granulosa cell apoptosis. Cell Death Dis. 2018;9(2):151.
- Zhang J, Xu Y, Liu H, Pan Z. Micrornas in ovarian follicular atresia and granulosa cell apoptosis. Reprod Biol Endocrinol. 2019;17(1):9.
- BMP15/GDF9 regulates proliferation and apoptosis of bovine cumulus cells by BMPR2, College of Animal Science, Jilin University, P.R.China, 2018.
- Yao Y, Reheman A, Xu Y, Li Q. miR-125b contributes to ovarian granulosa cell apoptosis through targeting BMPR1B, a major gene for sheep prolificacy. Reprod Sci. 2019;26(2):295–305.
- Poole DH, Ocon-Grove OM, Johnson AL. Regulation of anti-Müllerian hormone receptor type II (AMHR2) is mediated by oocyte-specific factors. Biol Reprod. 2011;85(Suppl_1):635–635.
- Li Y, Yu D, Sheng W, Song H, Li Y. Co-expression of FOXL1 and PP2A inhibits proliferation inducing apoptosis in pancreatic cancer cells via promoting trail and reducing phosphorylated MYC. Oncol Rep. 2016;35(4):2198–2206.
- Choi EJ, Kim DH, Kim JG, et al. Estrogen-dependent transcription of the NEL-like 2 (NELL2) gene and its role in protection from cell death. J Biol Chem. 2010;285(32):25074–25084.
- Murdoch J, Rostosky C, Gowrisankaran S, et al. Endophilin-a deficiency induces the Foxo3a-Fbxo32 network in the brain and causes dysregulation of autophagy and the ubiquitin-proteasome system. Cell Rep. 2016;17(4):1071–1086.