
Abstract
The peculiarity of Indian cattle lies in milk quality, resistance to diseases and stressors as well as adaptability. The investigation addressed selection signatures in Gir and Tharparkar cattle, belonging to arid ecotypes of India. Double digest restriction-site associated DNA sequencing (ddRAD-seq) yielded nearly 26 million high-quality reads from unrelated seven Gir and seven Tharparkar cows. In all, 19,127 high-quality SNPs were processed for selection signature analysis. An approach involving within-population composite likelihood ratio (CLR) statistics and between-population FST statistics was used to capture selection signatures within and between the breeds, respectively. A total of 191 selection signatures were addressed using CLR and FST approaches. Selection signatures overlapping 86 and 73 genes were detected as Gir- and Tharparkar-specific, respectively. Notably, genes related to production (CACNA1D, GHRHR), reproduction (ESR1, RBMS3), immunity (NOSTRIN, IL12B) and adaptation (ADAM22, ASL) were annotated to selection signatures. Gene pathway analysis revealed genes in insulin/IGF pathway for milk production, gonadotropin releasing hormone pathway for reproduction, Wnt signalling pathway and chemokine and cytokine signalling pathway for adaptation. This is the first study where selection signatures are identified using ddRAD-seq in indicine cattle breeds. The study shall help in conservation and leveraging genetic improvements in Gir and Tharparkar cattle.
Introduction
Domestication of cattle about 8000–10,000 years agoCitation1 followed by mutations, selection and demographic changes such as bottleneck effect and founder’s effect,Citation2,Citation3 cumulatively shaped the diverse breeds. During this course of evolution, zebu cattle acquired attributes of heat tolerance, longevity, low maintenance, resistance to tropical diseases and adaptability to scarcity of feed and fodder.Citation4 A total of 53 cattle breeds have been registered till date in India (https://nbagr.icar.gov.in/en/registered-cattle/).Citation5 Gir and Tharparkar are two of the registered zebu cattle breeds and represent the arid and semi-arid ecotypes of the Indian mainland. Gir cattle is native to Gir forests in Kathiawar region of Gujarat, while Tharparkar cattle is native to the Kachchh region of Gujarat and western parts of Rajasthan.Citation6,Citation7 The temperature in their habitat ranges from 7 to 45 °C with an average rainfall of 1000 mm.Citation8 Morphologically, Gir cattle have leaf-like and the longest ears, sleepy eye appearance, typical convex head, largest hump and widest coat colour variation among all Indian cattle breeds, while Tharparkar cattle have white or light grey coat colour and convex forehead features. Performance-wise, Gir cattle produce relatively more milk (average of 2110 kg; range of 800–3300 kg) than Tharparkar (average of 1749 kg; range of 913–2147 kg),Citation9 while Tharparkar displays better genetic plasticity in different climates ranging from sub-zero to fifty-degree Celsius temperature, recurrent famines and xerophytic vegetation.Citation10,Citation11
High-throughput sequencing and SNP genotyping technologies have advanced our ability to identify selection signatures in genomes, including those of cattle. These signatures, indicative of natural and artificial selection, are detected through statistical analyses of genetic data, enabling the identification of genes and mutations associated with phenotypic traits.Citation12 Saravanan et al.Citation13 described in detail about concepts, approaches and applications of selection signatures in livestock. The intricacies of these processes involve factors like the type of selection (hard or soft), the strength of selection and the methods used to detect these patterns in genetic data. In brief, under the influence of selection, a neutral allele gets dragged by a closely linked beneficial allele, causing hitchhiking effect. This pattern of co-inheritance left by selective sweeps decreases genetic variability in proximity, causing selection signatures on the genomeCitation14,Citation15 and the phenomenon is termed as selective sweep or hitchhiking effect or genetic draft.Citation16–18 They lead to reduced polymorphism, skewed site frequency spectrum and linkage disequilibrium, which can be quantified by different statistics.Citation19 Composite likelihood ratio (CLR) and Wright’s fixation index (FST) are two of them. The CLR statistic assesses the skewness in allele frequency spectra across multiple loci and factors in recombination rates to distinguish selection effects from demographic events.Citation20 On the other hand, the fixation index (FST) measures allele frequency differences between populations, with values ranging from 0, indicative of no population differentiation to 1, indicative of complete fixation difference. Elevated FST values at a specific locus signify positive selection, whereas low FST values suggest negative selection.Citation21 During selection, the within-breed component of diversity fades while the between-breed component rises, measured as FST. The greater the value of CLR and FST, the greater will be the likelihood of genomic regions under selection.Citation22
SNP markers are robust tools in population genetics to assess selection signatures,Citation13 for breed classification purposesCitation23–25 and for understanding various other diversity measuresCitation3 due to their genomic abundance and accessibility.Citation26 At present, genome-wide SNP mining relies on whole genome sequencing (WGS) and SNP chips. However, SNP chips are not tailored for specific populations, leading to ascertainment bias.Citation27 This limitation in chip data can be taken care of by WGS, but it is costly and involves operational difficulties. A consensus solution is genomic sub-sampling through double digest restriction-site associated DNA sequencing (ddRAD-seq) which covers roughly 5–40% of the genome.Citation28,Citation29
Erstwhile, RAD sequencing has been exercised in Sahiwal,Citation30,Citation31 Tharparkar,Citation32 BadriCitation33 and VrindavaniCitation34 cattle breeds of India for genome-wide identification of SNPs. Though selection signature analyses have been carried out in taurine cattle breeds, there is, however, limited knowledge about selection signatures in Indian cattle breeds using ascertainment bias-free genome-wide markers. This catalysed our quest for selection signatures using ddRAD-seq in Gir and Tharparkar cattle.
Material and methods
Data preprocessing
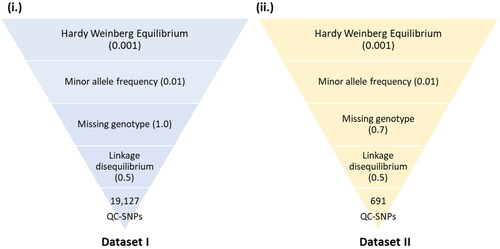
General bioinformatics pipeline was used for data preprocessing (). Dataset-I (S1) consists of a total of 14 ddRAD sequences sampled from seven Gir and seven Tharparkar adult and unrelated cows. The sampled cows were affiliated with the breed standards laid by the National Bureau of Animal Genetic Resources (NBAGR), the nodal agency for breed registration in India. The above 14 samples were sequenced using the Illumina® platform and deposited in NCBI (accessions: PRJNA678112 and PRJNA633222). The raw reads were retrieved and demultiplexed using FastX Toolkit v0.0.13 (http://hannonlab.cshl.edu/fastx_toolkit/).Citation35 Preliminary screening of raw reads was done using FastQC v0.11.8.Citation36 PRINSEQ-lite v0.20.4Citation37 was used to skim off barcodes and adapter sequences trailing restriction sites. STACKS v2.2Citation38 was used to process RAD tags and to remove reads having Phred score below 15. BOWTIE2 v2.3.4.1Citation39 was used to map the query sequences to the latest reference assembly of Bos taurus (GCF_002263795.2Citation40) and to Bos indicus (GCF_000247795.1 Bos indicus_1.0) assembly, in local very sensitive alignment mode. Gir reads were additionally mapped to reference assembly of Gir cattle (GCA_002933975.1) to enumerate additional variants in Gir cattle. SAM files were obtained, which were further processed to BAM files, using SAMtools v1.9.Citation41 With the help of sort, index and mpileup in BCFtools v1.17Citation42 and VCFtools v0.1.15,Citation42 variants shared between the two breeds were inferred based on likelihood algorithms. Eventually, the total number of SNPs and InDels as compared to different reference genomes were filtered at read depth (RD) ≥ 10Citation43 and mapping quality (MQ) ≥ 30Citation42 using VCFtools v0.1.15. SNPs were subjected to quality checking (QC) for Hardy–Weinberg equilibrium (HWE; p < 0.001), minor allele frequency (MAF < 0.01), missing genotypes (MG < 1.0) and linkage disequilibrium (LD > 0.50; 50 site-window) using PLINK v1.07Citation44 (Dataset-I; ).
Figure 1. Workflow for identification and annotation of selective sweeps.
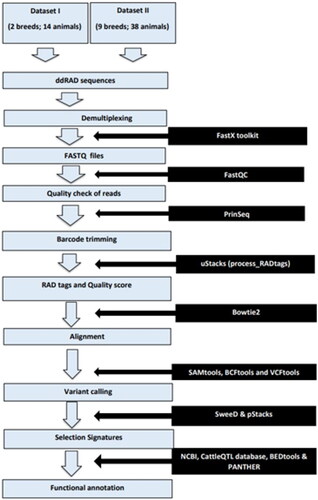
Figure 2. Quality control of SNPs in Dataset-I and Dataset-II.
Detection of selection signatures
For intra-breed selection signatures, CLR values were obtained in Gir and Tharparkar, respectively using SweeD 3.0Citation45 based on the hidden Markov model. SNPs were split breed-wise and chromosome-wise using BCFtools v1.16, and then SweeD 3.0 was run. Grid values were set as per the number of SNPs in each chromosome to get CLR at each SNP site, ranging from 393 to 980. Later, all the breed-wise CLR values were concatenated. For inter-breed selection signatures, population STACKS v2.61 yielded smoothed FST values between the two breeds. For both of the approaches, top 1 percentile SNPs (Dataset-I) with a window size of 10 kb, i.e., flanking the outlier SNPs ±5 kb both upstream and downstream, were assumed as putative selection signatures. Manhattan and circos plots were constructed using the qqman package in RCitation46 and shinyCircos v2.0,Citation47 respectively in R. The candidate genes under selection were traced in the coordinates of the windows of selection signatures.
To compare the reliability of the FST estimate, genotyping-by-sequencing (GBS) sequences of 24 unrelated adult cows (PRJNA400567) belonging to 8 breeds, viz., Gangatiri, Hariana, Kankrej, Ongole, Sahiwal, Siri and Tharparkar breeds of zebu cattle as well as a Holstein cross, already generated by our collaborating partnersCitation43 were also included in the study. Thus, Dataset-II comprised 14 ddRAD sequences of Gir (zebu) (S1) and Tharparkar (zebu) (S1) as well as GBS sequences of 8 breeds (zebu and nonzebu) (S11). SNPs were called jointly from Dataset-II at RD ≥ 10 and MQ ≥ 30 subjected to QC for HWE (p < 0.001), MAF (0.01), LD (0.5) and MG (0.7). FST value was estimated again from the high-quality SNPs common to the nine breeds including Gir and Tharparkar (Dataset-II) using population STACKS v2.61 ().
Annotation of selection signatures
The general feature format files containing gene and quantitative trait loci (QTL) information were retrieved from the NCBI (https://www.ncbi.nlm.nih.gov/assembly/GCF_002263795.2) and CattleQTLdb,Citation48 respectively. Candidate genes and QTL were annotated to BED files containing coordinates of selection signatures obtained from Dataset-I, using BEDtools v2.30.0.Citation49 Graphical maps were generated using MG2CCitation50 to address signatures on various chromosomes in relation to different traits. Genes common across CLR and FST approaches were traced using GeneVenn.Citation51 The candidate genes were submitted as an input to the PANTHER Database for pathway analysis.Citation52 Gene ontology was done by biological process (BP) terms, molecular functions terms as well as functional pathways.
Results
SNP identification
Mean base pair length of all the reads was 151 bp each. A total of 26 million raw reads were obtained from the Illumina platform comprising 13.67 million and 12.33 million of Gir and Tharparkar cattle respectively (S2). On an average, each sample produced 1.85 million reads. Gir samples had an average read count of 1.95 million while Tharparkar samples averaged a read count of 1.67 million. A total of 25.56 million (98.27%) clean reads passed the quality check (S2). When mapped to B. taurus assembly, the overall alignment rates were 99.85% and 99.87% in Gir and Tharparkar cattle, respectively. However, when mapped to B. indicus assembly, the overall alignment rates were 93.5% and 92.13% in Gir and Tharparkar cattle, respectively. Gir reads showed an alignment rate of 91.6% with Gir reference as compared to alignments with other assemblies; (S2). In all, 19,127 high-quality SNPs were obtained at RD ≥10 and MQ ≥30 (; S3), when mapped to B. taurus genome (Dataset-I) that were common across Gir and Tharparkar cattle to identify causal selection signatures. The Pearson’s correlation coefficient between length of autosomes and the number of SNPs was 0.93 (S4).
Identification of selective sweeps
A total of 191 sweep regions were found from Dataset-I by each of the approaches ( and ). Based on CLR values, the top 1% variants crossing the threshold, viz., CLR of 2.92 in Gir and 3.23 in Tharparkar cattle () were considered as selection signatures. A total of 91 and 80 genes were traced in selective sweep regions with a window size of 10 kb (S12–S13) in Gir and Tharparkar cattle respectively. Signals of selection detected through CLR approach were found to overlap with CACNA1D, CP, GNA14, LCP1, NFIB, etc., genes having a role in production, NOSTRIN, GHRHR, PRKD1 and XCR1 genes having a role in reproduction functions. Likewise, PARG, ROBO2, NOD1, IL12B, etc., genes found to have a role in immunity (S8–S10). Gir and Tharparkar cattle shared seven genes found in selective sweep regions namely, ARHGEF4, MUM1, FSTL4, GCFC2, TMEM132C, GINS3 and MAP4 (S15).
Figure 3. Circos plot showing SNPs and selective sweep identified in Gir and Tharparkar cattle. Outermost circle represents chromosomes, followed by number of SNPs identified, selection signatures in Gir using CLR statistic and selection signatures in Tharparkar using CLR statistic FST.
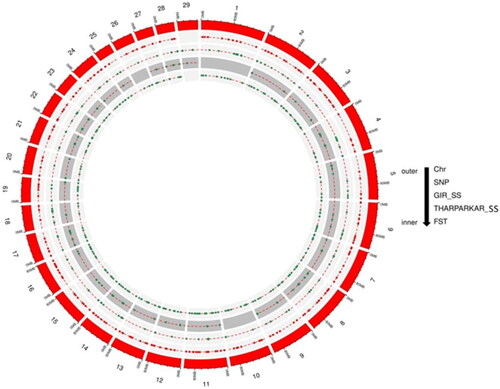
Figure 4. Chromosome map of selective sweep regions, where red denotes Gir cattle, green colour denotes Tharparkar cattle and blue colour denotes FST.
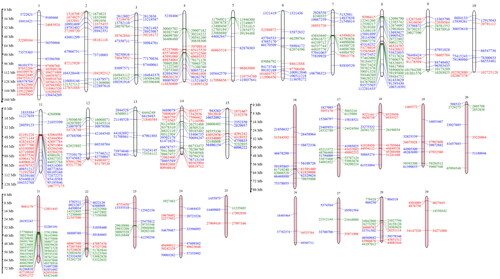
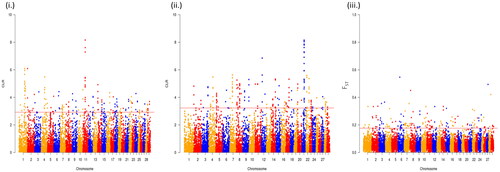
Figure 5. Manhattan plots to represent selective sweep regions detected by (i) CLR approach in Gir, (ii) CLR approach in Tharparkar and (iii) FST approach in Gir and Tharparkar.
The average FST value between the two populations was estimated to be 0.055. The top 1% variants with FST more than 0.66 are considered as the threshold for finding selection signatures. The outlier fraction contained 191 sites, flanked by a 10 kb window, 5 kb up- and down- stream were declared as the putative selective sweep regions. A total of 100 genes were traced in the 191 sites (S14). Among these, selection signatures identified through FST approach overlapped with ELOVL5, FAM13A, FHOD3, KCNK, etc., genes were related to production traits, MAPK10, RBMS3, ABCC1, TGFB2, ESR1, CACNA1D, CLEC 18 C, APAF1, etc., genes have a role in reproduction. While genes like RBS6KA2 and FAM13A have a role in immunity, the RNF20 gene identified by the FST approach had a role in heat tolerance (S8–S10).
Signatures associated with genes, QTL and pathways
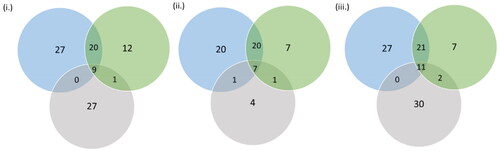
A total of 91, 80 and 100 genes were traced in selection signatures (S12–S14). After removing the common genes (S15), selection signatures overlapping 86 and 73 genes were detected as Gir- and Tharparkar- specific, respectively. A total of 32, 14 and 11 selection signatures were mapped to QTL associated with milk production, reproduction and growth traits respectively in Gir cattle (S16–S21). A total of 18 and 11 selection signatures were mapped to QTL related to milk production and reproduction traits respectively in Tharparkar cattle (S16–S21). Likewise, 38, 85 and 3 selection signatures were mapped to QTL related to milk production, reproduction and exterior traits respectively by FST approach (S22). Interestingly, the majority of the QTL responsible for milk casein percentage is found on the sixth chromosome (S16) and QTL responsible for reproduction traits on the X chromosome (S17). A total of 9, 7 and 11 genes overlapped with BPs, molecular function and pathways found by CLR approach in Gir, CLR approach in Tharparkar and FST approach in Gir-Tharparkar, respectively (; S23–S27). In all, 7 out of the 11 genes traced by FST approach were involved in apoptosis signalling pathway which is crucial for thermoregulation and adaptation. Greater number of genes were found to be enriched for Oxytocin receptor mediated signalling pathway (P04391), Wnt signalling pathway (P00057), Ras pathway (P04393), gonadotropin-releasing hormone receptor pathway (P06664) and insulin/IGF pathway-mitogen activated protein kinase/MAP kinase cascade (P00032) (S23–S27).
Figure 6. Venn diagram indicating genes overlapping for BPs, molecular function and pathways identified by (i) CLR in Gir, (ii) CLR in Tharparkar and (iii) FST in Gir and Tharparkar. Here, blue, green and grey colours depict BPs, molecular functions and gene pathways, respectively.
Discussion
SNP identification
Locally adapted breeds are the reservoirs of polymorphisms and signatures of selection vis-a-vis climate change.Citation26 Breeds showing adaptive attributes are prioritized for conservation.Citation53 Different studies have been published related to selection signatures in different Indian livestock species using SNP chip data, viz., cattle,Citation54–57 buffaloCitation57 and sheep.Citation58,Citation59 Current study was undertaken to acknowledge selection hotspots in the genome of two zebu cattle, Gir and Tharparkar, which enriched them with excellent performance in hot and arid ecologies. Of note, cattle genetics and allied technologies such as SNP arrays and SNP databases developed so far show ascertainment biasCitation60–62 and moreover, exclude discovery of breed-specific or rare variants.Citation63,Citation64 Nevertheless, there is always scope for finding some SNPs which may be static in exotic breeds while dynamic in indigenous breeds, at the same time. In the study strict quality control was followed, i.e., SNPs were called at RD ≥10 and MQ ≥30 subjected to HWE (0.001), MAF (0.01) and LD (0.5). However, there are growing concerns regarding the HWE test potentially excluding variants under selection, given its impact on signal detection.Citation65 Recognizing that next-generation sequencing data can be prone to errors due to factors like base-calling and alignment, it is advisable to sequence target regions deeply (at >20× coverage) for accurate SNP calling. Nonetheless, to balance cost-effectiveness, sequencing in this study was performed at medium coverage (5–20×), which is commonly used. Consequently, to address issues stemming from low-quality scores, systematic disparities in quality scores for major and minor alleles, unusual LD patterns and extreme read depths, a filtering approach based on deviations from HWE was applied to enhance the precision of SNP calling,Citation66 aligning with methodologies employed in other studies investigating positive selection in cattle using both whole genome resequencingCitation67 and SNP chip data.Citation68 GBS is more economical than SNP arrays for fewer individuals. Erstwhile works support similar sample size, n ≤ 7Citation32,Citation43,Citation45,Citation69–71 to ensure cost-effectiveness as well as animal welfare, while warranting accuracy and minimal false positives at the same time. STACKS was used for trimming low-quality reads as it checks the mean quality score using sliding windows while PRINSEQ trims across mean values.Citation72 The reads were mapped to three different reference assemblies, to choose a reference genome yielding a higher number of polymorphisms for downstream analysis (S2). First, to infer indicine-specific variants,Citation32 both the breeds under study were aligned with indicine reference assembly (Bos_indicus_1.0). This step minimizes ascertainment bias to taurine markers.Citation73 Second, to have additional variants,Citation74 Gir cattle were aligned with a Gir breed-specific reference assembly. However, due to the higher number of unmapped contigs present in this assembly,Citation75 the alignment rates were found to be the lowest. In Tharparkar, breed-specific reference alignment was not carried out because no Tharparkar breed-specific reference assembly is available yet. Finally, SNPs identified with reference to ARS-UCD1.3,Citation40 the latest, representative and more complete assembly, were used for downstream processing since it yielded higher variants (S3) than other assemblies. This was in line with Devadasan et al.,Citation32 where Tharparkar reads were mapped to B. indicus (Bos_indicus_1.0) and B. taurus (Bos_taurus_UMD_3.1.1) reference genomes and ultimately, considered B. taurus alignment for downstream analysis as it yielded higher number of variants.
The 19,127 high-quality SNPs are lower than 87,047 SNPs reported in TharparkarCitation32 and 65,483 SNPs in BadriCitation33 cattle, due to the application of stringent quality control. The number of SNPs are in line with Vineeth et al.Citation31 and Jaglan et al.,Citation76 where 193,803 and 18,056 SNPs were reported in 10 Sahiwal cattle and 96 Murrah buffaloes, respectively. However, SNPs reported are more than 9638 SNPs reported in 96 Vrindavani crossbred cattleCitation34 implying greater degree of polymorphism in Gir. Gurgul et al.Citation77 reported 8065 high-confidence SNPs in 48 cattle using the same technique. Malik et al.Citation43 found 107,488 SNPs in 24 animals from eight cattle breeds, using GBS. The discrepancy in number is due to the use of the GBS approach which employs one single restriction enzyme as compared to dual frequent and rare cutters in ddRAD.Citation72 The inter-SNP distance was higher than reported by Wang et al.Citation78 More distanced SNPs reflect more stringent quality filtration. In the current study, the maximum and minimum number of SNPs was located at BTA1 and BTA28, respectively in both the breeds (S4). As per Wang et al.,Citation78 the number of SNPs was most frequent in BTA11 while least frequent in BTA28. These differences in the distribution of SNPs may be due to differences in read depth threshold or may even be a breed-specific characteristic.Citation79 Pearson’s coefficient of correlation was fairly high and concordant with the findings of Vineeth et al.Citation31 Number of deletions was greater than the number of insertions.Citation80 This may be due to the higher propensity of software to identify a missing segment as compared to the amplified segment.Citation81 Since CLR and FST statistics are not haplotype-based, LD pruning was done to remove collinearity between SNPsCitation82 using conservative thresholds (r2 > 0.5) over a sliding window of 50 bp.
Detection of selection signatures
Detection of selection signatures by combinatorial approach is typically recommended.Citation83 For that reason, CLR values and FST approach were used, similar to Wang et al.,Citation78 to capture selection signatures within and between the breeds. Use of alternative approaches may complement and/or supplement our findings by finding sweeps which the former approach could not as well as by establishing congruence between the sweeps, making our findings reliable. However, as soon as selection comes into play, variability is evident in FST values. An outlier approach was used by sorting out the top 1 percentile of the polymorphic sites, to minimize false positives.Citation75
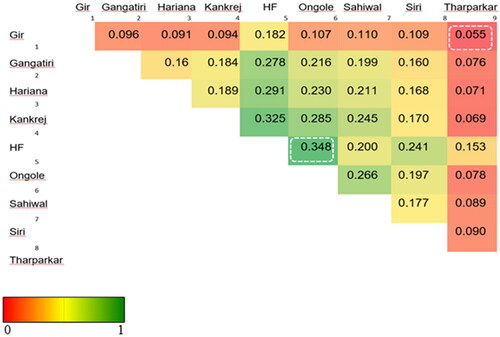
Lewontin and KrakauerCitation84 suggested that under neutrality, only little heterogeneity in the form of FST is observed. FST based Population differentiation is a powerful approach to detect selection signatures for nonphenotyped populations.Citation85 A systematic diversity investigation requires inclusion of more breeds for better reliability of estimates.Citation78 Merging of datasets is not trivial, but differences in SNP identification codes and genomic coordinates can be harmonized across the datasets using the same reference genome assembly as well as strand orientation. Thus, to check the reliability of FST, 24 cattle GBS sequences representing 8 breeds were merged with 14 ddRAD sequences representing Gir and Tharparkar breeds (S11). For merging, the datasets to be combined should share at least one breed for commonality; Tharparkar was common between 14 ddRAD and 7 GBS sequences in this case. Here, as the number of breeds was increased, the MG threshold for QC in Dataset-II was kept more lenient, i.e., 0.70 similar to De Donato et al.,Citation63 and upon filtering for common SNPs, the number of SNPs were less than Dataset-I. These comparisons were made to cross-check FST values obtained in two breeds (S7) versus nine breeds (). The least FST (=0.055) was found between Gir and Tharparkar implying a moderate amount of variability, i.e., 5.5% shared between the two breeds, while the remaining 94.5% can be attributed to the within-breed variability (; S11). Average FST value between Gir and Tharparkar breeds was found to be minimum among all breed pairs, as well as found to be concordant, i.e., 0.055, both in Dataset-I and Dataset-II, which indicates these two breeds are genetically similar compared to the rest of the breeds in Dataset-II. The genetic similarity between the two breeds as compared to the other breeds may be due to overlapping arid ecological niches as well as milch utilities of the two breeds.Citation86 Since FST measures allele frequency differences between populations, this may give clues for the selection of populations/breeds for crossbreeding to exploit heterosis. This is because crossbreeding involves the mating of animals chosen that have complementary traits,Citation87,Citation88 and alleles associated with the complementariness of traits display maximum FST.Citation89 In contrast, intra-population selection statistics such as CLR in our study explain adaptability to a given environment or production system may be given consideration in selective breeding.
Figure 7. Heat map of FST values for pair-wise breed comparisons.
In this study, 191 selection signatures and 91 and 80 overlapping genes have been identified in Gir and Tharparkar cattle, respectively using CLR approach while 100 genes were identified using the FST approach (S12–S14). Saravanan et al.Citation68 identified 34 and 23 genes in regions under positive selection using bovine 50K SNP chip data in Gir and Tharparkar, respectively with the help of iHS statistics. Rajawat et al.Citation58,Citation59 using bovine 50K SNP chip data and CLR approach identified 22 genes in Gir and 23 genes in Tharparkar. In this study, most of the selection signatures were found on BTA1 and BTA8 by CLR approach in Gir and Tharparkar, respectively. However, maximum signatures were found on BTA3 using the FST approach. These findings suggest higher selection pressure acting on chromosomes 3, 8 and 25 as indicated in chromomap (). Gir cattle showed a higher number of candidate genes in sweep regions than Tharparkar. This can be attributed to higher selection pressure acting on coding regions in Gir cattle. Overlap in the signals between the CLR and FST approaches rules out the chances of demographic events from the selection model. Less number of overlaps may be due to different criteria employed in both approaches (S15). Thus, the two approaches are complementary, rather than supplementary. Genes were annotated using taurine genomic backgrounds due to more elaborate and precise annotation reports.Citation90 However, a number of gene desert regions also form a major share of selection signatures due to incomplete genome annotation.Citation75,Citation91
Signatures overlapping with production related genes
Selection signatures were annotated with candidate genes for production traits (S8). In Gir cattle, the gene CACNA1D (calcium voltage-gated channel subunit alpha1 D) is found in a positively selected region, which performs muscle contraction hormone or neurotransmitter release.Citation92 The GHRHR (growth hormone releasing hormone receptor) gene encodes a receptor for growth hormone-releasing hormone.Citation93 MAP2K4 (mitogen-activated protein kinase kinase 4) is involved in prolactin signalling and GPCR pathway. Other important genes, viz., CP, RAB20, MAP4, ARHGEF4, GHRHR, TMEM132C, LDB2, GNA14 and GHRHR genes were also found. Maiorano et al.Citation94 also identified ARHGEF4 under selection by using the FST approach, carrying dairy importance.Citation95 In Tharparkar cattle, the genes co-inheriting with regions under positive selection were; STARD10 (StAR related lipid transfer domain containing 10) involved in lipid transport and regulation of bile acid secretion,Citation96 RPS6KA2 (ribosomal protein S6 kinase A2), implicated in controlling cell growth and differentiationCitation97 and XCR1 (X-C motif chemokine receptor 1) involved in calcium-dependent signal transduction.Citation98 MAP4, ARHGEF4, TMEM132C, RPS6KA2, VCP, RAB2A, NFIB and CHD7 genes were also found. Relatively higher number of genes related to production using CLR were found in Gir (nine), than in Tharparkar (six) (S8), which may explain higher milk production in Gir compared to Tharparkar.
Selective signatures identified using FST approach overlapped with CAPN5 (Calpain 5) involved in signal transduction in a variety of cellular processes,Citation99 ELOVL5 (ELOVL fatty acid elongase 5) involved in long-chain fatty acids productionCitation100 and MAPK10 (mitogen-activated protein kinase 10) involved in proliferation, differentiation, transcription regulation and development (GC04M085990). Apart from that, FHOD3, FAM13A, OSBPL10, TGFB2, RBMS3, ABCC1 and GRB10 genes were traced. No intersection was seen with some of the major genes such as LEP and DGAT1 which suggests that genes found under selection may bear linkage and/or pleiotropy with the candidate genes for milk production and other performance traits. MARCH4 gene which is involved in vesicular transport between membrane compartmentsCitation101 was traced commonly in sweep regions identified by CLR and FST approach, suggesting the joint action of positive and divergent selection on MARCH4 at the same time. This finding is in accordance with the findings of Zhao et al.Citation102
Signatures overlapping with reproduction related genes
In Tharparkar, PRKD1 (protein kinase D1) gene was found which is involved in Golgi body membrane integrity and transport, cell migration, differentiation and adhesion.Citation103 By FST approach, RBMS3 (RNA binding motif single stranded interacting protein 3) has been implicated in diverse functions, such as DNA replication, gene transcription, cell cycle progression and apoptosis.Citation104 ESR1 (estrogen receptor 1) regulates growth, metabolism, sexual development, gestation and other reproductive functions.Citation105 CLEC18C, APAF1, ZGLP1, GNAQ, MAPK10 and TGFB2 genes were also traced.
Signatures overlapping with disease related genes
In Gir, NOSTRIN (nitric oxide synthase trafficking inducer) regulates neurotransmission, inflammatory response and vascular homeostasis,Citation106 CDH13 (cadherin 13) is involved in cell adhesion mechanism,Citation107 IL12B (interleukin 12B) mediates long-term protection to an intracellular pathogenCitation108 and FYB1 is involved in platelet activation and controls the expression of interleukin-2.Citation109 MAP4, PARG, ROBO2, NOD1 and PLB1 genes were found to overlap with the selection signatures (S9). In Tharparkar, overlaps were seen with VTCN1 (V-set domain containing T cell activation inhibitor 1), which interacts with ligand bound to T cell receptors,Citation110 RPS6KA2 (ribosomal protein S6 kinase A2) implicated in controlling cell growth and differentiationCitation111 and LCP1 (lymphocyte cytosolic protein 1) implicated in tumorigenesis in solid tissues.Citation112 TLE1, MAP4, XCR1 and TMEM154 were also found in sweep regions. Using FST approach, the genes found the sweep regions were GNAQ (G protein subunit alpha Q) required for platelet activation and regulates B-cell selection,Citation113 IL12RB1 (interleukin 12 receptor subunit beta 1) to mediate mycobacterial and salmonella infection pathwaysCitation114 and ATRN (attractin) to regulate the chemotactic activity of chemokines.Citation115 TRIM33, TGFB2, GUCY1A2, TOX2 and FAM13A were the other genes found. Saravanan et al.Citation68 reported NCR3 in Gir and DEFB7 in Tharparkar for immune response as genes under positive selection.
Signatures overlapping with adaptation related genes
In Gir, ASL (argininosuccinate lyase) required in the liver to detoxify ammonia via the urea cycleCitation116 was found. In Tharparkar, ADAM22 (ADAM metallopeptidase domain 22), implicated in a variety of BPs involving cell interactions and neurogenesis,Citation117 was found, and TLE1, SP4 and TMTC2 were also detected. DNAJC12 was identified by CLR approach in Tharparkar cattle. Members of the DNAJ family serve as cofactors for heat shock protein 70 (Hsp70) and are related to heat stress response.Citation118 Using the CLR approach, a relatively higher number of genes were found in Tharparkar (12) compared to Gir (9) (S10), which explains the plasticity of Tharparkar to different climates. Through FST approach, RNF20 (ring finger protein 20), a putative tumour suppressor,Citation119 PLXNA4 (plexin A4) involved in the positive regulation of axonogenesisCitation120 and NCAM1 (neural cell adhesion molecule 1) required in the development of the nervous system.Citation121 SNTG2, MPP5, DOCK9, ASTN2, MAPK10, DSCAML1, LINGO2, PHLDB2 and DISP1 were also traced (S10).
Signatures overlapping with QTL and pathway analysis
Selection signatures had overlapped maximum with reproduction and production associated with QTL (S16–S22). This is parallel with QTL mapped with selection signatures reported by Maiorano et al.Citation94 However, Dixit et al.Citation122 reported a maximum number of QTL overlapping with selection signatures in production and carcass traits in four Indian dairy breeds including Gir and Tharparkar using bovine HD 777k chip data. The TOX gene, related to immunity and daughter pregnancy rate was found under selection by FST approach in this study and was also reported by Maiorano et al.Citation94 in QTL associated with milk. KCNIP1 and ROBO1 identified by CLR in Tharparkar and FST approach in the current study were reported to overlap with QTL related to production and composition. Rajawat et al.Citation58,Citation59 reported genes under positive selection in QTL using CLR approach, viz., CAHD1 for calving ease, PPP1R14C for body conformation and PHF2 for milk fat percentage in Tharparkar and CNTN5 for milk fat and protein quality, KLHL20 for somatic cell count and CADPS for conception rate in Gir cattle.
Gene pathway analysis was done to show the biological traffic of genes in synchrony rather than the action of a single candidate gene.Citation123 A total of seven genes traced by FST approach were involved in Apoptosis signalling pathway which is crucial for thermoregulation and adaptation (S23–S27). A greater representation of genes in oxytocin receptor mediated signalling pathway (P04391) indicates role of signatures in milk production,Citation124 in Wnt signalling pathway (P00057) for ageing processCitation125 and in Ras pathway (P04393) for cell proliferation and differentiation, thus having a direct role in immunity.Citation126 Likewise, over representation of genes in gonadotropin-releasing hormone receptor pathway (P06664) indicates role of signatures in reproduction.Citation127 Signatures in insulin/IGF pathway-mitogen activated protein kinase kinase/MAP kinase cascade (P00032) have a role in energy metabolismCitation128 in the arid adaptive environment. An excess of genes in glutamatergic pathways and Parkinson’s disease pathways reflect their role in domestication and nervous system adaptation.Citation129,Citation130
Conclusions
Research on selective sweeps offers valuable insights into biologically significant genetic variations that lead to genetic divergence. Genomic sub-sampling methods like ddRAD-seq offer a cost-effective solution to mitigate ascertainment bias, addressing limitations posed by generic SNP chips and expensive WGS. A total of 19,127 SNPs were used to examine selection signatures and found 191 potential regions through CLR and FST statistics. Analysing allele frequency differences through FST offers valuable insights for selecting populations in crossbreeding, capitalizing on trait complementarity, while, considering intra-population selection statistics like CLR ensures adaptability to specific environments and optimizing selective breeding strategies. The corresponding genes overlapping with selection signatures are particularly associated with crucial aspects of production (CACNA1D, CP, GNA14, etc.), reproduction (NOSTRIN, GHRHR, PRKD1, etc.) and adaptation (ASL, ADAM22, DNAJC12, etc.) underscoring the potential for comprehensive improvements in these key areas. Hence Gir and Tharparkar breeds can be considered as models for identifying selection signatures in hot and arid regions. These observations hold the potential to furnish valuable knowledge for future functional genomic investigations, QTL mapping, genome-wide association studies, genomic selection, the creation of breed-specific SNP panels, gene editing and the implementation of breeding strategies, and conservation initiatives. It is important to note that additional research with a larger sample size is necessary to validate our findings.
Supplemental Material
Download MS Word (333.8 KB)Acknowledgements
The authors thank the Director, ICAR-National Dairy Research Institute, and the Director, ICAR-National Bureau of Animal Genetic Resources, for their support in carrying out this research work. The authors express their sincere thanks to Dr. Parameswari B., Senior Scientist (Plant Pathology), and Dr. Neeraj Kulshreshtha, Principal Scientist (Plant Breeding) and Head, Regional Centre, Sugarcane Breeding Institute Regional Centre, Karnal, Haryana, for providing computational facilities for this work.
Disclosure statement
On behalf of all authors, the corresponding authors state that there is no conflict of interest.
Data availability statement
All data generated or analysed during this study are included in this manuscript.
Additional information
Funding
References
- Loftus RT, MacHugh DE, Ngere LO, et al. Mitochondrial genetic variation in European, African and Indian cattle populations. Anim Genet. 1994;25(4):265–271.
- Flori L, Fritz S, Jaffrézic F, et al. The genome response to artificial selection: a case study in dairy cattle. PLoS One. 2009;4(8):e6595.
- Kanaka KK, Sukhija N, Goli RC, et al. On the concepts and measures of diversity in the genomics era. Curr Plant Biol. 2023;33:100278.
- Srivastava AK, Patel J, Ankuya K, Chauhan H, Pawar M, Gupta J. Conservation of indigenous cattle breeds. J Anim Res. 2019;9(1):1–12.
- Registered Cattle. ICAR-National Bureau of Animal Genetic Resources; 2023. https://nbagr.icar.gov.in/en/registered-cattle/. Accessed June 30, 2023.
- Gaur GK, Kaushik SN, Garg RC. The Gir cattle breed of India-characteristics and present status. Anim Genet Resour Inf. 2003;33:21–29.
- Godara AS, Tomar AKS, Patel M, Godara RS, Bhat SA, Bharati P. Body conformation in Tharparkar cattle as a tool of selection. J Anim Res. 2015;5(3):423–430.
- IMD. India Meteorological Department, Met Center Ahmedabad; 2023. https://mausam.imd.gov.in/ahmedabad/. Accessed January 7, 2023.
- AGRI-IS. Animal Genetic Resources of India Information System; 2023. https://nbagr.icar.gov.in/en/registered-cattle/. Accessed January 7, 2023.
- Gahlot GC. Genetic Evaluation of Tharparkar Cattle [Ph.D. thesis]. Bikaner: Rajasthan Agricultural University; 1999.
- Kaushish SK. Drought adapted breeds of livestock. In: Feeding and Management of Livestock During Drought and Scarcity; Scientific Publishers, 2012:271.
- Panigrahi M, Kumar H, Saravanan KA, et al. Trajectory of livestock genomics in South Asia: a comprehensive review. Gene. 2022;843:146808.
- Saravanan KA, Panigrahi M, Kumar H, Bhushan B, Dutt T, Mishra BP. Selection signatures in livestock genome: a review of concepts, approaches and applications. Livest Sci. 2020;241:104257.
- Kaplan NL, Hudson RR, Langley CH. The “hitchhiking effect” revisited. Genetics. 1989;123(4):887–899.
- Smith JM, Haigh J. The hitch-hiking effect of a favourable gene. Genet Res. 1974;23(1):23–35.
- Braverman JM, Hudson RR, Kaplan NL, Langley CH, Stephan W. The hitchhiking effect on the site frequency spectrum of DNA polymorphisms. Genetics. 1995;140(2):783–796.
- Fay JC, Wu CI. Hitchhiking under positive Darwinian selection. Genetics. 2000;155(3):1405–1413.
- Maynard J, Haigh J. The hitch-hiking effect of a favourable gene . Genet Res . 2007;89(5–6):391–403.
- Stephan W. Selective sweeps. Genetics. 2019;211(1):5–13.
- Kim Y, Stephan W. Detecting a local signature of genetic hitchhiking along a recombining chromosome. Genetics. 2002;160(2):765–777.
- Moradi MH, Nejati-Javaremi A, Moradi-Shahrbabak M, Dodds KG, McEwan JC. Genomic scan of selective sweeps in thin and fat tail sheep breeds for identifying of candidate regions associated with fat deposition. BMC Genet. 2012;13(1):10.
- Beaumont MA. Adaptation and speciation: what can FST tell us? Trends Ecol Evol. 2005;20(8):435–440.
- Kumar H, Panigrahi M, Chhotaray S, et al. Identification of breed-specific SNP panel in nine different cattle genomes. Biomed Res. 2019;30(1):78–81.
- Kumar H, Panigrahi M, Chhotaray S, et al. Comparative analysis of five different methods to design a breed-specific SNP panel for cattle. Anim Biotechnol. 2021;32(1):130–136.
- Kumar H, Panigrahi M, Rajawat D, et al. Selection of breed-specific SNPs in three Indian sheep breeds using ovine 50 K array. Small Rumin Res.. 2021;205:106545.
- Groeneveld LF, Lenstra JA, Eding H, et al. Genetic diversity in farm animals—a review. Anim Genet. 2010;41 Suppl 1(s1):6–31.
- Manolio TA, Collins FS, Cox NJ, et al. Finding the missing heritability of complex diseases. Nature. 2009;461(7265):747–753. .
- Mishra DC, Sikka P, Yadav S, et al. Identification and characterization of trait-specific SNPs using ddRAD sequencing in water buffalo. Genomics. 2020;112(5):3571–3578.
- Peterson BK, Weber JN, Kay EH, Fisher HS, Hoekstra HE. Double digest RADseq: an inexpensive method for de novo SNP discovery and genotyping in model and non-model species. PLoS One. 2012;7(5):e37135.
- Surati U, Verma A, Niranjan SK, Verma A, Niranjan SK. Genome-wide in silico analysis leads to identification of deleterious L290V mutation in RBBP5 gene in Bos indicus. Anim Biotechnol. 2023;1–9. https://doi.org/10.1080/10495398.2023.2199502
- Vineeth MR, Surya T, Sivalingam J, et al. Genome-wide discovery of SNPs in candidate genes related to production and fertility traits in Sahiwal cattle. Trop Anim Health Prod. 2020;52(4):1707–1715.
- Devadasan MJ, Kumar DR, Vineeth MR, et al. Reduced representation approach for identification of genome-wide SNPs and their annotation for economically important traits in Indian Tharparkar cattle. 3 Biotech. 2020;10(7):309.
- Rahman JU, Kumar D, Singh SP, et al. Genome-wide identification and annotation of SNPs and their mapping in candidate genes related to milk production and fertility traits in Badri cattle. Trop Anim Health Prod. 2023;55(2):117.
- Wara AB, Kumar A, Singh A, Arthikeyan AK, Dutt T, Mishra BP. Genome wide association study of test day’s and 305 days milk yield in crossbred cattle. Indian J Anim Sci. 2019;89:861–865. https://epubs.icar.org.in/index.php/IJAnS/article/view/93019.
- FASTX Toolkit. http://hannonlab.cshl.edu/fastx_toolkit/. Accessed April 3, 2023.
- Andrews S. 2010. FastQC: a quality control tool for high throughput sequence data. https://www.bioinformatics.babraham.ac.uk/projects/fastqc.
- Schmieder R, Edwards R. Quality control and preprocessing of metagenomic datasets. Bioinformatics. 2011;27(6):863–864.
- Catchen JM, Amores A, Hohenlohe P, Cresko W, Postlethwait JH. Stacks: building and genotyping loci de novo from short-read sequences. G3. 2011;1(3):171–182.
- Langmead B, Salzberg SL. Fast gapped-read alignment with Bowtie 2. Nat Methods. 2012;9(4):357–359.
- ARS-UCD1.3. BosTau9—Genome—Assembly—NCBI. https://www.ncbi.nlm.nih.gov/assembly/GCF_002263795.2. Accessed July 3, 2023.
- Li H. A statistical framework for SNP calling, mutation discovery, association mapping and population genetical parameter estimation from sequencing data. Bioinformatics. 2011;27(21):2987–2993.
- Danecek P, Bonfield JK, Liddle J, et al. Twelve years of SAMtools and BCFtools. Gigascience. 2021;10(2):giab008.
- Malik AA, Sharma R, Ahlawat S, Deb R, Negi MS, Tripathi SB. Analysis of genetic relatedness among Indian cattle (Bos indicus) using genotyping-by-sequencing markers. Anim Genet. 2018;49(3):242–245.
- Purcell S, Neale B, Todd-Brown K, et al. PLINK: a tool set for whole-genome association and population-based linkage analyses. Am J Hum Genet. 2007;81(3):559–575.
- Pavlidis P, Živković D, Stamatakis A, Alachiotis N. SweeD: likelihood-based detection of selective sweeps in thousands of genomes. Mol Biol Evol. 2013;30(9):2224–2234.
- Turner SD. qqman: an R package for visualizing GWAS results using Q-Q and manhattan plots. J Open Source Softw. 2018;3(25):731.
- Yu Y, Ouyang Y, Yao W. shinyCircos: an R/Shiny application for interactive creation of Circos plot. Bioinformatics. 2018;34(7):1229–1231.
- Hu ZL, Park CA, Wu XL, Reecy JM. Animal QTLdb: an improved database tool for livestock animal QTL/association data dissemination in the post-genome era. Nucleic Acids Res. 2013;41(database issue):D871–D879.
- Quinlan AR, Hall IM. BEDTools: a flexible suite of utilities for comparing genomic features. Bioinformatics. 2010;26(6):841–842.
- Chao J, Li Z, Sun Y, et al. MG2C: a user-friendly online tool for drawing genetic maps. Mol Hortic. 2021;1(1):16.
- Pirooznia M, Nagarajan V, Deng Y. GeneVenn—a web application for comparing gene lists using Venn diagrams. Bioinformation. 2007;1(10):420–422.
- Mi H, Lazareva-Ulitsky B, Loo R, et al. The PANTHER database of protein families, subfamilies, functions and pathways. Nucleic Acids Res. 2005;33(database issue):D284–D288.
- Weldenegodguad M, Popov R, Pokharel K, et al. Whole-genome sequencing of three native cattle breeds originating from the northernmost cattle farming regions. Front Genet. 2018;9:728.
- Dixit SP, Bhatia AK, Ganguly I, et al. Genome analyses revealed genetic admixture and selection signatures in Bos indicus. Sci Rep. 2021;11(1):21924.
- Nayak SS, Panigrahi M, Kumar H, et al. Evidence for selective sweeps in the MHC gene repertoire of various cattle breeds. Anim Biotechnol. 2023;1–7. https://doi.org/10.1080/10495398.2023.2196317
- Rajawat D, Panigrahi M, Nayak SS, et al. Uncovering genes underlying coat color variation in indigenous cattle breeds through genome-wide positive selection. Anim Biotechnol. 2023;1–14. https://doi.org/10.1080/10495398.2023.2240387
- Saravanan KA, Rajawat D, Kumar H, et al. Signatures of selection in riverine buffalo populations revealed by genome-wide SNP data. Anim Biotechnol. 2022;1–12. https://doi.org/10.1080/10495398.2022.2145292
- Rajawat D, Panigrahi M, Kumar H, et al. Identification of important genomic footprints using eight different selection signature statistics in domestic cattle breeds. Gene. 2022;816:146165.
- Rajawat D, Panigrahi M, Kumar H, et al. Revealing genomic footprints of selection for fiber and production traits in three Indian sheep breeds. J Nat Fibers. 2022;19(16):14963–14974.
- Iqbal N, Liu X, Yang T, et al. Genomic variants identified from whole-genome resequencing of indicine cattle breeds from Pakistan. PLoS One. 2019;14(4):e0215065.
- Kõks S, Reimann E, Lilleoja R, et al. Sequencing and annotated analysis of full genome of Holstein breed bull. Mamm Genome. 2014;25(7-8):363–373.
- Stothard P, Choi JW, Basu U, et al. Whole genome resequencing of black Angus and Holstein cattle for SNP and CNV discovery. BMC Genom. 2011;12(1):559.
- De Donato M, Peters SO, Mitchell SE, Hussain T, Imumorin IG. Genotyping-by-sequencing (GBS): a novel, efficient and cost-effective genotyping method for cattle using next-generation sequencing. PLoS One. 2013;8(5):e62137.
- Sivalingam J, Vineeth MR, Surya T, et al. Genomic divergence reveals unique populations among Indian Yaks. Sci Rep. 2020;10(1):3636.
- Abramovs N, Brass A, Tassabehji M. Hardy–Weinberg equilibrium in the large scale genomic sequencing era. Front Genet. 2020;11:210.
- Nielsen R, Paul JS, Albrechtsen A, Song YS. Genotype and SNP calling from next-generation sequencing data. Nat Rev Genet. 2011;12(6):443–451.
- Ben-Jemaa S, Adam G, Boussaha M, et al. Whole genome sequencing reveals signals of adaptive admixture in Creole cattle. Sci Rep. 2023;13(1):12155.
- Saravanan KA, Panigrahi M, Kumar H, et al. Genomic scans for selection signatures revealed candidate genes for adaptation and production traits in a variety of cattle breeds. Genomics. 2021;113(3):955–963.
- Ravi Kumar D, Joel Devadasan M, Surya T, et al. Genomic diversity and selection sweeps identified in Indian swamp buffaloes reveals it’s uniqueness with riverine buffaloes. Genomics. 2020;112(3):2385–2392.
- Li H, Qu W, Obrycki JJ, et al. Optimizing sample size for population genomic study in a global invasive lady beetle, harmonia Axyridis. Insects. 2020;11(5):290.
- Nazareno AG, Bemmels JB, Dick CW, Lohmann LG. Minimum sample sizes for population genomics: an empirical study from an Amazonian plant species. Mol Ecol Resour. 2017;17(6):1136–1147.
- Surya T, Vineeth MR, Sivalingam J, et al. Genomewide identification and annotation of SNPs in Bubalus bubalis. Genomics. 2019;111(6):1695–1698.
- Nayee N, Sahana G, Gajjar S, et al. Suitability of existing commercial single nucleotide polymorphism chips for genomic studies in Bos indicus cattle breeds and their Bos taurus crosses. J Anim Breed Genet. 2018;135(6):432–441.
- Czech B, Frąszczak M, Mielczarek M, Szyda J. Identification and annotation of breed-specific single nucleotide polymorphisms in Bos taurus genomes. PLoS One. 2018;13(6):e0198419.
- Gao Y, Jiang J, Yang S, et al. CNV discovery for milk composition traits in dairy cattle using whole genome resequencing. BMC Genom.. 2017;18(1):265.
- Jaglan K, Ravikumar D, Sukhija N, et al. Genomic clues of association between clinical mastitis and SNPs identified by ddRAD sequencing in Murrah buffaloes. Anim Biotechnol. 2023;1–9. https://doi.org/10.1080/10495398.2023.2165937
- Gurgul A, Miksza-Cybulska A, Szmatoła T, et al. Genotyping-by-sequencing performance in selected livestock species. Genomics. 2019;111(2):186–195.
- Wang W, Gan J, Fang D, et al. Genome-wide SNP discovery and evaluation of genetic diversity among six Chinese indigenous cattle breeds in Sichuan. PLoS One. 2018;13(8):e0201534.
- Gurgul A, Żukowski K, Ślaska B, et al. General assessment of copy number variation in normal and tumor tissues of the domestic dog (Canis lupus familiaris). J Appl Genet. 2014;55(3):353–363.
- Sjödin P, Bataillon T, Schierup MH. Insertion and deletion processes in recent human history. PLoS One. 2010;5(1):e8650.
- Yuan C, Lu Z, Guo T, et al. A global analysis of CNVs in Chinese indigenous fine-wool sheep populations using whole-genome resequencing. BMC Genom.. 2021;22(1):78.
- Malomane DK, Reimer C, Weigend S, Weigend A, Sharifi AR, Simianer H. Efficiency of different strategies to mitigate ascertainment bias when using SNP panels in diversity studies. BMC Genom. 2018;19(1):22.
- Utsunomiya YT, Pérez O'Brien AM, Sonstegard TS, Sölkner J, Garcia JF. Genomic data as the “hitchhiker’s guide” to cattle adaptation: tracking the milestones of past selection in the bovine genome. Front Genet. 2015;6:36.
- Lewontin RC, Krakauer J. Distribution of gene frequency as a test of the theory of the selective neutrality of polymorphisms. Genetics. 1973;74(1):175–195.
- Hoban S, Kelley JL, Lotterhos KE, et al. Finding the genomic basis of local adaptation: pitfalls, practical solutions, and future directions. Am Nat. 2016;188(4):379–397.
- Ciani E, Ciampolini R, D’Andrea M, et al. Analysis of genetic variability within and among Italian sheep breeds reveals population stratification and suggests the presence of a phylogeographic gradient. Small Rumin Res. 2013;112(1–3):21–27.
- Esfandyari H, Sørensen AC, Bijma P. A crossbred reference population can improve the response to genomic selection for crossbred performance. Genet Sel Evol. 2015;47(1):1–12.
- Wright S. 1932. The roles of mutation, inbreeding, crossbreeding, and selection in evolution. Proceedings of the VI International Congress of Genetics. 1:356–366.
- Nagylaki T. Fixation indices in subdivided populations. Genetics. 1998;148(3):1325–1332.
- Stafuzza NB, Zerlotini A, Lobo FP, et al. Single nucleotide variants and indels identified from whole-genome re-sequencing of Guzerat, Gyr, Girolando and Holstein cattle breeds. PLoS One. 2017;12(3):e0173954.
- Librado P, Der Sarkissian C, Ermini L, et al. Tracking the origins of Yakutian horses and the genetic basis for their fast adaptation to subarctic environments. Proc Natl Acad Sci U S A. 2015;112(50):E6889–E6897.
- Lipscombe D, Helton TD, Xu W. L-type calcium channels: the low down. J Neurophysiol. 2004;92(5):2633–2641.
- Cohen LE, Hashimoto Y, Zanger K, Wondisford F, Radovick S. CREB-independent regulation by CBP is a novel mechanism of human growth hormone gene expression. J Clin Invest. 1999;104(8):1123–1130.
- Maiorano AM, Lourenco DL, Tsuruta S, et al. Assessing genetic architecture and signatures of selection of dual purpose Gir cattle populations using genomic information. PLoS One. 2018;13(8):e0200694.
- Chen Z, Yao Y, Ma P, Wang Q, Pan Y. Haplotype-based genome-wide association study identifies loci and candidate genes for milk yield in Holsteins. PLoS One. 2018;13(2):e0192695.
- Ito M, Yamanashi Y, Toyoda Y, et al. Disruption of Stard10 gene alters the PPARα-mediated bile acid homeostasis. Biochim Biophys Acta. 2013;1831(2):459–468.
- Dufner A, Thomas G. Ribosomal S6 kinase signaling and the control of translation. Exp Cell Res. 1999;253(1):100–109.
- Horuk R. Chemokine receptors. Cytokine Growth Factor Rev. 2001;12(4):313–335.
- Goll DE, Thompson VF, Li H, Wei WEI, Cong J. The calpain system. Physiol Rev. 2003;83(3):731–801.
- Wang Y, Botolin D, Christian B, Busik J, Xu J, Jump DB. Tissue-specific, nutritional, and developmental regulation of rat fatty acid elongases. J Lipid Res. 2005;46(4):706–715.
- Bartee E, Mansouri M, Hovey Nerenberg BT, Gouveia K, Früh K. Downregulation of major histocompatibility complex class I by human ubiquitin ligases related to viral immune evasion proteins. J Virol. 2004;78(3):1109–1120.
- Zhao F, McParland S, Kearney F, Du L, Berry DP. Detection of selection signatures in dairy and beef cattle using high-density genomic information. Genet Sel Evol. 2015;47(1):49.
- Jaggi M, Du C, Zhang W, Balaji KC. Protein kinase D1: a protein of emerging translational interest. Front Biosci. 2007;12(8-12):3757–3767.
- Arvanitis C, Felsher DW. Conditional transgenic models define how MYC initiates and maintains tumorigenesis. Semin Cancer Biol. 2006;16(4):313–317.
- Muramatsu M, Inoue S. Estrogen receptors: how do they control reproductive and nonreproductive functions? Biochem Biophys Res Commun. 2000;270(1):1–10.
- Chakraborty S, Ain R. Nitric-oxide synthase trafficking inducer is a pleiotropic regulator of endothelial cell function and signaling. J Biol Chem. 2017;292(16):6600–6620.
- Van den Bossche J, Malissen B, Mantovani A, De Baetselier P, Van Ginderachter JA. Regulation and function of the E-cadherin/catenin complex in cells of the monocyte-macrophage lineage and DCs. J Am Soc Hematol Blood. 2012;119(7):1623–1633.
- Trinchieri G. Interleukin-12 and the regulation of innate resistance and adaptive immunity. Nat Rev Immunol. 2003;3(2):133–146.
- Kliche S, Breitling D, Togni M, et al. The ADAP/SKAP55 signaling module regulates T-cell receptor-mediated integrin activation through plasma membrane targeting of Rap1. Mol Cell Biol. 2006;26(19):7130–7144.
- Vaishnav J, Khan F, Yadav M, et al. V-set domain containing T-cell activation inhibitor-1 (VTCN1): a potential target for the treatment of autoimmune diseases. Immunobiology. 2022;227(6):152274.
- Magnuson B, Ekim B, Fingar DC. Regulation and function of ribosomal protein S6 kinase (S6K) within mTOR signalling networks. Biochem J. 2012;441(1):1–21.
- Dubovsky JA, Chappell DL, Harrington BK, et al. Lymphocyte cytosolic protein 1 is a chronic lymphocytic leukemia membrane-associated antigen critical to niche homing. J Am Soc Hematol Blood. 2013;122(19):3308–3316.
- Xie Z, Chan EC, Druey KM. R4 regulator of G protein signaling (RGS) proteins in inflammation and immunity. AAPS J. 2016;18(2):294–304.
- Gately MK, Renzetti LM, Magram J, et al. The interleukin-12/interleukin-12-receptor system: role in normal and pathologic immune responses. Annu Rev Immunol. 1998;16(1):495–521.
- Duke-Cohan JS, Gu J, McLaughlin DF, Xu Y, Freeman GJ, Schlossman SF. Attractin (DPPT-L), a member of the CUB family of cell adhesion and guidance proteins, is secreted by activated human T lymphocytes and modulates immune cell interactions. Proc Natl Acad Sci U S A. 1998;95(19):11336–11341.
- Erez A, Nagamani SCS, Lee B. Argininosuccinate lyase deficiency—Argininosuccinic aciduria and beyond. Am J Med Genet C Semin Med Genet. 2011;157C(1):45–53.
- Sagane K, Sugimoto H, Akaike A. Biological characterization of ADAM22 variants reveals the importance of a disintegrin domain sequence in cell surface expression. J Recept Signal Transduct Res. 2010;30(2):72–77.
- Kampinga HH, Craig EA. The HSP70 chaperone machinery: J proteins as drivers of functional specificity. Nat Rev Mol Cell Biol. 2010;11(8):579–592.
- Wei D, Sun Y. Small ring finger proteins RBX1 and RBX2 of SCF E3 ubiquitin ligases: the role in cancer and as cancer targets. Genes Cancer. 2010;1(7):700–707.
- Suto F, Murakami Y, Nakamura F, Goshima Y, Fujisawa H. Identification and characterization of a novel mouse plexin, plexin-A4. Mech Dev. 2003;120(3):385–396.
- Kiss JZ, Troncoso E, Djebbara Z, Vutskits L, Muller D. The role of neural cell adhesion molecules in plasticity and repair. Brain Res Rev. 2001;36(2–3):175–184.
- Dixit SP, Singh S, Ganguly I, et al. Genome-wide runs of homozygosity revealed selection signatures in Bos indicus. Front Genet. 2020;11:92.
- Lv FH, Agha S, Kantanen J, et al. Adaptations to climate-mediated selective pressures in sheep. Mol Biol Evol. 2014;31(12):3324–3343.
- Gimpl G, Fahrenholz F. The oxytocin receptor system: structure, function, and regulation. Physiol Rev. 2001;81(2):629–683.
- Zhang Q, Marioni RE, Robinson MR, et al. Genotype effects contribute to variation in longitudinal methylome patterns in older people. Genome Med. 2018;10(1):75.
- Vojtek AB, Der CJ. Increasing complexity of the Ras signaling pathway. J Biol Chem. 1998;273(32):19925–19928.
- Fink MY, Pincas H, Choi SG, Nudelman G, Sealfon SC. Research resource: gonadotropin-releasing hormone receptor-mediated signaling network in LβT2 cells: a pathway-based web-accessible KnowledgeBase. Mol Endocrinol. 2010;24(9):1863–1871.
- Claeys I, Simonet G, Poels J, et al. Insulin-related peptides and their conserved signal transduction pathway. Peptides. 2002;23(4):807–816.
- Cookson MR, Bandmann O. Parkinson’s disease: insights from pathways. Hum Mol Genet. 2010;19(R1):R21–R27.
- Hou Y, Qi F, Bai X, et al. Genome-wide analysis reveals molecular convergence underlying domestication in 7 bird and mammals. BMC Genom.. 2020;21(1):204.