
Abstract
Mastitis in cows is caused by the inflammation of the mammary glands due to an infection by external pathogenic bacteria. Mammary gland epithelial cells, which are in direct contact with the external environment, are responsible for the first line of defense of the mammary gland against pathogenic bacteria, playing an essential role in immune defense. To investigate the mechanism of bovine mammary epithelial cells in the inflammatory process, we treated the cells with LPS for 12 hours and analyzed the changes in mRNA by transcriptome sequencing. The results showed that compared to the control group, the LPS treatment group had 121 up-regulated genes and 18 down-regulated genes. GO and KEGG enrichment analysis revealed that these differential genes were mainly enriched in the IL-17 signaling pathway, Legionellosis, Cytokine-cytokine receptor interaction, NF-kappa B signaling pathway, and other signaling pathways. Furthermore, the expression of GRO1 and CXCL3 mRNAs increased significantly after LPS treatment. These findings provide new insights for the treatment of mastitis in cows in the future.
Introduction
Bovine mastitis is a severe and common disease in dairy cattle farming that threatens the lives of dairy cows, causes a drop in milk production and quality, and leads to significant economic losses for farms.Citation1 Research has shown that the primary cause of mastitis in dairy cows is the infection of pathogenic bacteria, mostly gram-negative, such as Escherichia coli and Pseudomonas aeruginosa.Citation2
Lipopolysaccharide (LPS) is a molecular pattern molecule found on the surface of gram-negative bacteria, which triggers an immune and inflammatory response when bacterial infections occur. LPS is considered an important virulence factor for mastitis and Toll-like receptor 4 (TLR4) on the surface of breast epithelial cells can recognize LPS and activate downstream signaling pathways to trigger an inflammatory response, leading to increased secretion of cellular inflammatory factors.Citation3,Citation4
Mammary epithelial cells are the primary cell type in breast parenchyma, accounting for 70% of the breast’s composition.Citation5 They are widely distributed on the surface of the mammary parenchyma and play a crucial role in the immune response and first line of defense against pathogenic bacterial invasion.Citation6–Citation8 Mammary epithelial cells show increased expression of immune-related genes, such as cytokines, chemokines, TLR receptors and β-defensins in response to inflammation.Citation9 The activation of the NF-κB pathway in infected and developing mouse mammary epithelial cells has been shown to lead to reduced lactation.Citation10
Transcriptome sequencing technology has become a powerful tool for researchers to understand the molecular mechanisms involved in specific biological processes and disease development. Transcriptome sequencing analysis has been used to study the function of various tissues in dairy and beef cattle. For example, Mi et al. identified key lncRNAs with potential immunomodulatory functions (PRANCR and TNK2-AS1) as potential targets for the preventing bovine mastitis by sequencing mammary epithelial cells infected with S. aureus and identifying differential expression genes (DEGs).Citation11 Chen et al. established a model of cellular mastitis and selected genes for functional assessment by high-throughput sequencing to identify strategies for the prevention and treatment of mastitis using tea tree oil to improve milk quality.Citation12
Mastitis is a complex disease, and although many studies have been conducted to elucidate the immune mechanisms underlying this disease,Citation13,Citation14 the molecular mechanisms in the bovine mammary gland tissue during mastitis have been poorly investigated, particularly the role of mammary epithelial cells, which constitute 70% of the mammary gland. To clarify the role of mammary epithelial cells in the inflammatory response to exogenous microbial invasion of mammary tissue in cows, we analyzed the mRNA expression profiles of LPS-treated bovine mammary epithelial cells to identify DEGs to explore the regulatory role of mammary epithelial cells during bovine mastitis. These findings will enable the discovery of novel therapeutic strategies for mastitis treatment.
Methods
CCK8
80–90% Of MAC-T cells were chosen, grown into 96-well plates, and then incubated at 37 °C with 5% CO2. Discard the culture medium once the cells have expanded to cover 70% of the container. Add various concentrations of LPS dilution and incubate in the incubator for 12 hours. Discard the culture medium again, wash the cells twice and add fresh culture medium. Add 10 L of CCK-8 solution to each well. Incubate in the incubator for 30 minutes. Use a microplate reader to measure the OD value at 450 nm.
Cells treatment with LPS
The MAC-T cell lines used in this study were all from the clinical veterinary laboratory of the College of Veterinary Medicine, Henan Agricultural University. We selected 80–90% adherent MAC-T cells, diluted them to a concentration of 5 × 10⁴ cells/mL and inoculated 2 mL in a 6-well plate. When the cell monolayer was 70% confluent, the medium was discarded. MAC-T cells were randomly divided into two groups with three replicates each: one group of cells was treated with 100 µg/mL LPS (Sigma, 297-473-0), and the other group was treated with an equal volume of PBS and incubated for 12 h at 37 °C in a 5% CO2 incubator. Then, the medium was discarded, the plate was washed twice with pre-cooled PBS, cells were collected and RNA was extracted.
Extraction and quality inspection of total RNA
Three setting techniques were repeated for each group, and RNA was extracted using the Trizol method. The concentration of extracted total RNA, RNA integrity number and 28s/18s RNA were measured by Nanjing Personalbio Technology Co., Ltd., using Agilent 2100 Bioanalyzer.
Library preparation and transcriptome sequencing
RNA samples were prepared in a 3-µg loading volume. Sequencing libraries were generated using the TruSeq RNA Library Prep Kit v2. In summary, poly-A-containing mRNA was enriched using oligo-dT magnetic beads, and cleavage was accomplished at a high temperature using divalent cations in Illumina’s proprietary lysis buffer. Random oligonucleotides and Superscript II were used to synthesize first-strand cDNA followed by second-strand cDNA. The remaining overhangs were converted into blunt ends using exonuclease/polymerase. Before hybridization, the 3′ ends of the DNA fragments were adenylated and ligated with Illumina paired-end (PE) adapter oligonucleotides. The amplified library fragments were subjected to 15 cycles of PCR amplifications using the Illumina-PCR primer mixture, and the amplified library size was selected as 300–400 bp. PCR products were purified using the AmpreXP system, and the library size was determined using the Agilent 2100 Bioanalyzer system. Finally, library sequencing of PEs was performed using next-generation sequencing on the Illumina HiSeq platform.
Quality control and comparison of reads with reference genome
The samples were sequenced at the upper level to obtain image files, which the sequencing platform’s software converted to generate the original FASTQ data. Then, the raw sample data were counted, including the sample name, percentage of ambiguous bases, Q20 (%) and Q30 (%) (). The sequencing data contained low-quality reads, significantly interfering with subsequent information analysis. Therefore, the sequencing data were further filtered to remove low-quality reads. The filtered reads were then compared with the reference genome using the HISAT2 software. The reference genome used was Bos taurus. The clean reads were mapped to the reference genome using HISAT2.
Table 1. Data filtering statistics after Illumina sequencing.
Analysis of DEGs
Genes that were differentially expressed in PBS and LPS groups (three biological replicates per group) were screened using DESeq. DEGs were screened according to the general criteria of cuffdiff (|log2FC|≥1) and p-value <0.05. After the DEGs were obtained, Gene Ontology (GO) function analysis and Kyoto Encyclopedia of Genes and Genomes (KEGG) signaling pathway analysis were performed.
GO and KEGG enrichment analysis
We performed GO enrichment analysis for functional annotation and KEGG enrichment analysis for signaling pathway annotation of DEGs. GO enrichment analysis was performed using topGO. The GO terms were used to obtain the list of genes and the number of genes per term. Then, the p-value was calculated using the hypergeometric distribution method (the criterion for significant enrichment was p-value <0.05) to identify DEGs significantly enriched in GO terms compared to the whole genomic background, thus determining the main biological functions performed by the DEGs.
QRT-PCR
The sequencing results were validated by randomly selecting nine genes from DEGs. The expression profiles of 10 unselected DEGs were determined using the SYBR green-based QRT-PCR method and sequence-specific primers designed with an online primer design tool (Supplementary Table 1). cDNA samples were synthesized by transcribing RNA from the PBS and LPS groups using a cDNA kit (Vazyme, Nanjing, China). After obtaining cDNA samples, each group of models was mixed as follows: 1 μL cDNA template, 0.5 μL forward primer, 0.5 μL reverse primer, 10 μL 2 × RealStar Green Fast Mixture and 8 μL enzyme-free water. For each gene set, three biological replicates were performed. Reaction conditions included pre-denaturation at 95 °C for 30 s, followed by 40 cycles of denaturation at 95 °C for 5 s and annealing at 60 °C for 30 s. The Ct value of the gene was then obtained, and the data were analyzed using GraphPad Prism software (8.0.2).
Results
Effects of LPS on MAC-T cell viability and inflammatory factors expression
displays the findings of the CCK8 test, which revealed that the viability of MAC-T cells was unaffected by the 12 and 24 hours of stimulation with various doses of LPS. The vitality of MAC-T cells is decreased by LPS concentrations of 100, 150, 200 and 250 g/mL when breast epithelial cells are stimulated for 48 hours at various doses. The cells were then exposed to LPS solutions at 0, 50, 100, 150, 200 and 250 g/mL for 12 hours. Using qRT-PCR, the expression levels of the pertinent inflammatory factors IL-6, IL-8 and TNF- were found. demonstrates the degree of inflammatory factor expression in MAC-T cells.
Figure 1. Cell viability of MAC-T cells treated with LPS. *p < 0.05; **p < 0.01; **p < 0.001 versus the value for cells cultured without LPS.
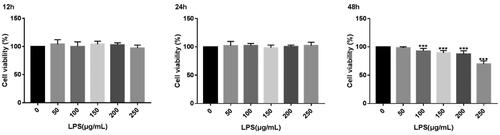
Figure 2. Effect of LPS on the expression of inflammatory factors related to MAC-T cells. *p < 0.05; **p < 0.01; ***p < 0.001 versus the value for cells cultured without LPS.
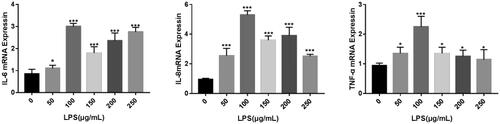
The CCK8 test results are shown in : when different concentrations of LPS stimulate MAC-T cells for 12 and 24 h, there is no significant effect on the viability of MAC-T cells. When different concentrations of LPS stimulated breast epithelial cells for 48 h, the attention of LPS at 100, 150, 200 and 250 μg/mL were highly significant (p < 0.001) reduced the viability of MAC-T cells. Next, LPS solutions at concentrations (0, 50, 100, 150, 200 and 250 μg/mL) were selected, and the cells were applied for 12 h. The expression levels of the relevant inflammatory factors IL-6, IL-8 and TNF-α were detected by qRT-PCR. It can be seen from that the expression level of inflammatory factors in MAC-T cells increased significantly after different concentrations of LPS. The mRNA expression levels of IL-6, IL-8 and TNF-a were the highest when the LPS concentration was 100 μg/mL, so the LPS concentration was the best induction concentration at 100 μg/mL.
Quality control of the RNA sequence
The RNA OD260/280 of all samples was >1.8 and <2.0; the RNA integrity number (RIN) values were all ≥7.0 (Table S1). Each RNA sample was visualized using agarose gel electrophoresis (Fig. S1). For each example, three bands were observed (28S, 18S and 5S), and the 28S and 18S bands were the clearest and brightest, while the 5S band was weaker. The results showed that the quality of each RNA sample was satisfactory and could be used for library sequencing and further testing. Three PBS treatment groups and three LPS treatment groups were created for sequencing. The sequencing data were filtered to remove low-quality reads (). The filtered read values were 44,000,120 (94.37%), 47,050,824 (94.26%) and 47,088,886 (94.41%) for the PBS group and 53,166,308 (94.35%), 51,258,452 (94.27%) and 44,773,680 (94.29%) for the LPS groups. The resulting read numbers were then compared to Bos taurus (). The total number of sequences aligned to multiple positions in the PBS groups was 42,783,859 (97.24%), 45,770,975 (97.28%) and 45,850,549 (97.37%), and the total number of sequences aligned to multiple locations in the LPS groups was 51,646,566 (97.14%), 43,836,139 (97.23%) and 43,485,914 (97.12%).
Table 2. Summary of clean reads mapped to the reference genome.
Identification of DEGs
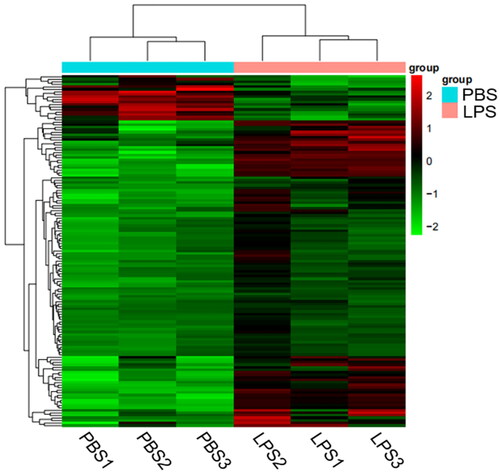
Compared with the PBS group, 139 DEGs were identified in the LPS group, including 121 genes that were over-expression and 18 that were under-expression. The ggplots2 package in R software was used to map the differences in gene expression between PBS and LPS groups (). Some inflammation-related genes were over-expression, such as IL1A, IL2RB and IL6, which were increased by 7.92-fold, 2.18-fold and 6.11-fold, respectively; the over-expression chemokine genes included CXCL3, CXCL5 and C3, which were raised by 30.28, 14.82 and 4.85-fold, respectively. We used the R software Pheatmap package to perform bivariate clustering analysis on the concatenated sets and samples of DEGs from the LPS group. We clustered them according to the expression levels of the same gene in different pieces and the expression patterns of other genes in the same sample. The Euclidean method was used to calculate distance and the hierarchical clustering most extended distance method (complete linkage) was used for clustering ().
Figure 3. Volcano map of DEGs. The two vertical dotted lines are the threshold of the differential expression. The horizontal dotted line is the threshold FDR at 0.05. Up-expression and under-expression genes are shown as red and blue dots, respectively, and gray dots represent non-significantly differentially expressed genes.
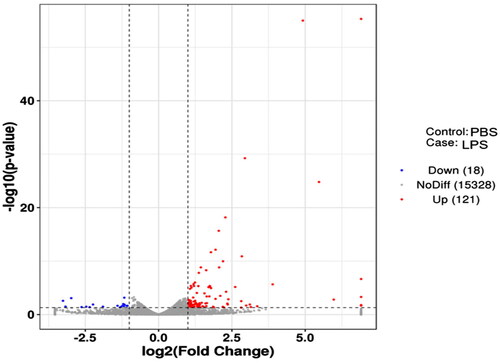
Figure 4. Heatmap analysis of DEGs. The horizontal lines represent genes, and each column is a sample. Red represents high-expression genes, and the green represents low-expression genes. The X-axis is the sample number, and the Y-axis is the DEGs.
GO enrichment analysis
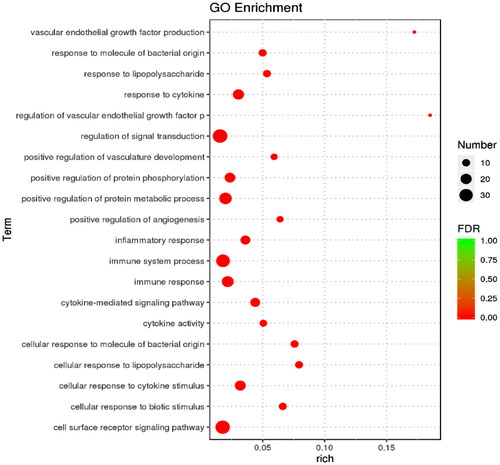
DEGs were classified and annotated using GO (). The genes were annotated into three categories: GO biological process, molecular function, and cellular component. Cytokine-mediated signaling pathway (GO: 0019221), cytokine activity in molecular function (cytokine activity, GO: 0005125), extracellular region (GO: 0044421), and interleukin-6 receptor complex (GO: 0005896). A total of 318 significantly enriched GO entries were obtained from the GO enrichment analysis. The top 20 enriched considerably GO entries are presented in . The most significantly enhanced GO entries were associated with signal transduction regulation (GO: 0055114) and the cell surface receptors signaling pathway (GO: 0006629).
Figure 5. GO enrichment analysis displaying the top 10 significantly enriched GO terms.
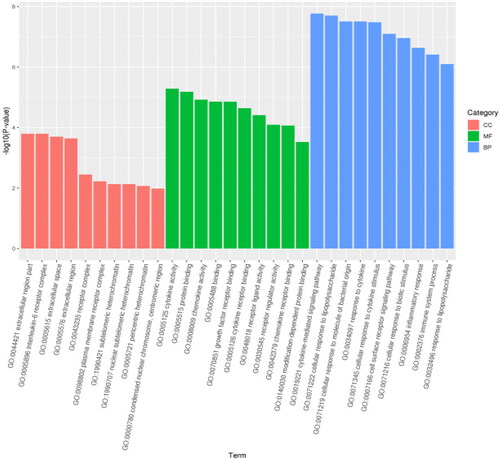
Figure 6. Bubble diagram of GO enrichment analysis. The size of the dots indicates the number of genes in the GO term, and different colors indicate different levels of significance.
KEGG enrichment analysis
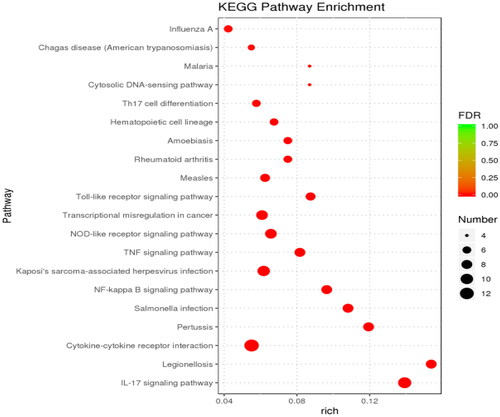
KEGG classification annotation was performed on the DEGs (). The DEGs were annotated into three subjects: environmental information processing, human diseases and biological systems. The IL-17 signaling pathway contained the most DEGs. Furthermore, through KEGG enrichment analysis, 38 significantly enriched pathways were identified. The top 20 enriched KEGG pathways are shown in . The most significantly enhanced KEGG pathway was the cytokine-cytokine-receptor interaction pathway.
Figure 7. Histogram of KEGG pathway enrichment result. Abscissa is the name of the pathway, and the ordinate is the − log10 (p-value) of each enriched pathway.
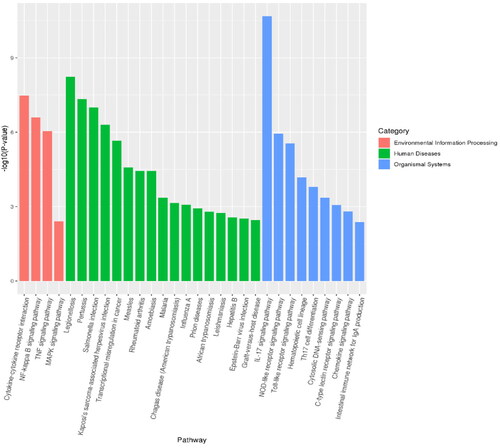
Figure 8. KEGG enrichment analysis displaying the top 20 significantly enriched KEGG terms.
DEG validation using QRT-PCR
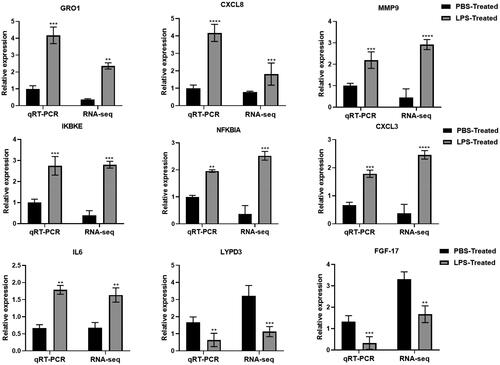
Nine genes were selected for QRT-PCR to verify the sequencing results. Among them, seven over-expression genes (GRO1, CXCL8, MMP9, IKBKE, NFKBIA, CXCL3 and IL6) and two under-expression genes (LYPD3 and FGF-17) were selected. The expression trends of these nine genes were similar to those of the RNA-seq results, validating the confidence of the sequencing results ().
Figure 9. Validation of RNA-seq results using QRT-PCR.
Discussion
Mastitis is a common disease of dairy cattle caused by the combined actions of the organism, pathogenic microorganisms and environmental health, with a wide range of occurrence and high incidence, which seriously affects the sustainable development of the dairy industry.Citation15
As cells in direct contact with the external environment, mammary epithelial cells are widely distributed on the surface of mammary parenchymal tissue and play an essential immune defense role as the first line of defense of the mammary gland against invasion by pathogenic bacteria. Therefore, it is crucial to study the role of mammary epithelial cells in the inflammatory response during mastitis to provide experimental evidence leading to the development of improved mastitis treatment. With the rapid growth of sequencing technology, high-throughput sequencing has been widely used in various diseases, which helps to understand the molecular mechanism of disease occurrence and its regulatory network.Citation16,Citation17 Therefore, in this study, transcriptome sequencing was performed on LPS-stimulated bovine mammary epithelial cells to analyze the dynamic changes of molecular immune mechanisms in early infected mastitis cells.
The results showed that the PBS group on the number of influential reads, 47,050,824, 44,000,120 and 47,088,886, respectively, and the LPS treatment group on the number of compelling reads, 53,166 308, 51,258,452, 44,773,680. In the LPS-treated samples, the number of readings was significantly higher. After analysis of gene differential mRNA expression, LPS-treated mammary epithelial cells had 121 over-expression genes and 18 under-expression genes compared with the PBS group. This result may be related to the time of LPS treatment. Function and KEGG pathway enrichment of DEGs is an effective method for understanding the functional differences between the PBS and LPS groups. In this study, 318 GO items were significantly enriched.
Regarding molecular functions, DEGs were mainly enriched in binding, protein binding, cytokine activity, chemokine activity and growth factor receptors. Regarding cellular components, DEGs were primarily increased in the extracellular region, extracellular space and leukocytes interleukin-6 receptor complex. In terms of bioengineering, DEGs were mainly enriched in cytokine-mediated signaling pathways. These findings indicate that cow mammary epithelial cells can recognize and generate complex immune responses. At the same time, LPS significantly impacts cow mammary epithelial cells’ metabolic and physiological function. Consistent with Chen’s findings,Citation12 the mRNA of inflammatory factors (IL-1β, IL-6, TNF-α) was significantly upregulated after LPS treatment. In addition to common inflammatory agents such as IL1B and IL6, our study also found other genes involved in inflammation: C3 and SAA3. It has been shown that SAA3 is an acute phase responder secreted by inflammatory adipocytes.Citation18 That inhibition of SAA3 expression can alleviate LPS-induced mesenchymal stem cell injury, while the T-cell signaling pathway regulated by SAA may be a target for anti-inflammatory therapy.Citation19 C3 is a central component of the complement system, located at the junction of all complement activation pathways. It mediates its multiple functions through different binding sites and their corresponding receptor family.Citation20 C3 of cellular and tissue origin has been found to play a vital role in dysregulated immune responses in many diseases.Citation21
In the KEGG pathway enrichment analysis, 38 significant pathways were enriched. Among them, the relevant inflammatory signaling pathways mainly enriched were in the IL-17 signaling pathway, cytokine-receptor interactions, Nuclear factor-κB signaling pathway (NF-kB signaling pathway), Tumor necrosis factor signaling pathway (TNF signaling pathway), NOD-like receptor signaling pathway, Toll-like receptor signaling pathway (TLR signaling pathway). Consistent with the results of E. M. Shangraw et al.,Citation22 they established an in vivo dairy cow mastitis model by injecting LPS into dairy cow mammary tissue, and RNA sequencing found that KEGG-enriched pathways include NF-kB signaling pathway, TNF signaling pathway and TLR signaling pathway. This suggests similar changes in sequencing results in in vitro and in vivo models of cow mastitis. TLRs are the most significant and studied pattern recognition receptor of the natural immune system and the first line of defense against pathogen invasion in higher animals.Citation23 Ibeagha-Awemu’s study found that with the increase of LPS treatment time in bovine mammary epithelial cells, the expression of TLR4 receptor and TLR downstream signaling molecules increased.Citation24 Still, this study found that the toll-like receptor signaling pathway was mainly enriched with differential factors such as IKBKE, CXCL8 and IL6. NF-κB is the primary signaling pathway that mediates LPS-induced inflammatory cytokine production. LPS activates the NF-κB signaling pathway and releases inflammatory cytokines such as IL-1β, IL-6 and TNF-α.Citation25 NF-κB is a nuclear transcription factor, and its activation is essential in the development of mastitis.Citation26 When various chemical and mechanical signals stimulate cells, IKK-β is rapidly activated, leading to IKB-α phosphorylation and proteasome-mediated degradation,Citation27 which then phosphorylates and translocates NF-κB to the nucleus, thereby inducing cytokine transcription. Therefore, the inhibition of NF-κB activation may be a critical step in the treatment of mastitis. The NOD-like receptor (NLR) protein family is a group of pattern recognition receptors (PRRs) that mediate the initial innate immune response to cellular injury and stress.Citation28 NLR proteins were initially studied as critical regulators in the immune response and as specific recognition of pathogen-associated molecular pattern recognition receptors (PAMP). This indicates that cow mammary epithelial cells have a robust immune response to LPS, consistent with previous studies. The activation of the above signaling pathway also indicates that cow mammary epithelial cells can promote the migration of macrophages and neutrophils to the site of infection, playing an essential immunomodulatory role in autophagic vesicles and bactericidal activity.
At the same time, our KEGG enrichment results also revealed pathways not reported in previous sequencing studies, such as C-type lectin receptor signaling pathway (CLR), Th17 cell differentiation, Chemokine signaling pathway, etc. Among them, CLR belongs to a large family of proteins whose extracellular structure contains carbohydrate recognition domains and calcium-binding sites.Citation29 The latest research shows that CLR-induced signaling cascades lead to the activation of NF-κB through Syk and CARD9-dependent pathways. CLR is an integral part of the innate immune response. It can play a role in developing immediate recognition of pathogens and shaping adaptive immune responses in conjunction with Pattern recognition receptors (PRRs), thereby eliminating inflammation and restoring physiological balance to the body.Citation30 Th17 cell differentiation mainly includes three stages: induction, amplification and stabilization, and at each location, Th17 cell differentiation is finely and intricately regulated by various cytokines and signaling molecules.Citation31 The primary function of Th17 cells is to promote the mobilization, recruitment and activation of neutrophils and mediate the pro-inflammatory response, which is closely related to autoimmune diseases, infectious diseases and tumor co-occurrence. Chemokine is a class of secondary pro-inflammatory mediators whose role is to direct leukocytes to the site of inflammatory infection, mainly divided into the CXC subfamily with chemotaxis on neutrophils and the CC subfamily with chemotaxis on monocytes.Citation32 The sequencing results showed that the pathway was mainly enriched with upregulating factors such as CXCL3, CXCL5, CXCL8 and NFKBIA. CXCL3 specifically recruits and activates various chemokine-expressing cells and regulates cell migration, invasion and angiogenesis. CXCL5 regulates neutrophil homeostasis, and inflammatory cytokines IL-1 or TNF-α can produce CXCL5 after stimulation of cells; CXCL8, also known as IL-8, activates NF-κB and initiates the inflammatory cycle. The results showed that when LPS treated bovine mammary epithelial cells, multiple immune responses were generated within the cells in response to inflammation compared to normal cells.
In this study, mRNA associated with C-type lectin receptor signaling pathway, Th17 cell differentiation, Chemokine signaling pathway and NOD-like receptor signaling pathway, TLR signaling pathway, NF-κB signaling pathway were significantly enriched in LPS-stimulated bovine mammary epithelial cells. Therefore, these inflammation-related mRNAs are the key to subsequent prevention and treatment of bovine mastitis.
Conclusions
In our study, compared with the PBS group, RNA-seq of MAC-T cells in the LPS-induced group showed differential expression of many critical immune-related genes and signaling pathways, such as: C-type lectin receptor signaling pathway, Th17 cell differentiation, Chemokine signaling pathway and NOD-like receptor signaling pathway, TLR signaling pathway, NF-κB signaling pathway, which may be involved in bovine mastitis. These genes and signaling pathways may be involved in the pathology of cow mastitis and require additional studies. Our analysis lays the foundation for further elucidation of the molecular mechanisms underlying microbial invasion and host cell responses and provides new insights for treating bovine mastitis.
Supplemental Material
Download MS Word (17.3 KB)Supplemental Material
Download MS Word (16.3 KB)Supplemental Material
Download JPEG Image (32.3 KB)
Acknowledgments
This work was supported by Key Research and Development Project of Henan Province “Research on Key Technology of TCM substitution and its Application in Healthy Livestock Breeding” (221111111300) and Henan Province Major Science and technology project (231100310200).
Disclosure statement
No potential conflict of interest was reported by the author(s).
Data availability statement
The raw data supporting the conclusions of this article will be made available by the authors, without undue reservation.
Additional information
Funding
References
- Seegers H, Fourichon C, Beaudeau F. Production effects related to mastitis and mastitis economics in dairy cattle herds. Vet Res. 2003;34(5):475–491.
- Bannerman DD, Chockalingam A, Paape MJ, et al. The bovine innate immune response during experimentally-induced. Pseudomonas aeruginosa mastitis. Vet Immunol Immunopathol. 2005;107(3-4):201–215.
- Li R, Fang H, Shen J, et al. Curcumin alleviates LPS-induced oxidative stress, inflammation and apoptosis in bovine mammary epithelial cells via the NFE2L2 signaling pathway. Toxins (Basel). 2021;13(3):208.
- Hu X, Tian Y, Wang T, et al. TRAM-Derived Decoy Peptides inhibits the inflammatory response in mouse mammary epithelial cells and a mastitis model in mice. 2015;764:607–612.
- Capuco AV, Wood DL, Baldwin R, et al. Mammary cell number, proliferation, and apoptosis during a bovine lactation: relation to milk production and effect of bST. J Dairy Sci. 2001;84(10):2177–2187.
- Gilbert FB, Cunha P, Jensen K, et al. Differential response of bovine mammary epithelial cells to Staphylococcus aureus or Escherichia coli agonists of the innate immune system. Vet Res. 2013;44(1):40.
- Strandberg Y, Gray C, Vuocolo T, et al. Lipopolysaccharide and lipoteichoic acid induce different innate immune responses in bovine mammary epithelial cells. Cytokine. 2005;31(1):72–86.
- Günther J, Koczan D, Yang W, et al. Assessment of the immune capacity of mammary epithelial cells: comparison with mammary tissue after challenge with Escherichia coli. Vet Res. 2009;40(4):31.
- Pareek R, Wellnitz O, VAN Dorp R, et al. Immunorelevant gene expression in LPS-challenged bovine mammary epithelial cells. J Appl Genet. 2005;46(2):171–177.
- Connelly L, Barham W, Pigg R, et al. Activation of nuclear factor kappa B in mammary epithelium promotes milk loss during mammary development and infection. J Cell Physiol. 2010;222(1):73–81.
- Mi S, Tang Y, Dari G, et al. Transcriptome sequencing analysis for the identification of stable lncRNAs associated with bovine Staphylococcus aureus mastitis. J Anim Sci Biotechnol. 2021;12(1):120.
- Chen Z, Zhang Y, Zhou J, et al. Tea tree oil prevents mastitis-associated inflammation in lipopolysaccharide-stimulated bovine mammary epithelial cells. Front Vet Sci. 2020;7:496.
- Tsugami Y, Wakasa H, Kawahara M, et al. Adverse effects of LPS on membrane proteins in lactating bovine mammary epithelial cells. Cell Tissue Res. 2021;384(2):435–448.
- Brand KS, Filor V, BäUMER W. Early inflammatory events of mastitis-a pilot study with the isolated perfused bovine udder. BMC Vet Res. 2021;17(1):356.
- Wang YY, Sun SP, Zhu HS, et al. GABA regulates the proliferation and apoptosis of MAC-T cells through the LPS-induced TLR4 signaling pathway. Res Vet Sci. 2018;118:395–402.
- Zhou ZC, Dong Y, Sun HJ, et al. Transcriptome sequencing of sea cucumber (Apostichopus japonicus) and the identification of gene-associated markers. Mol Ecol Resour. 2014;14(1):127–138.
- Li Z, Trakooljul N, Hadlich F, et al. Transcriptome analysis of porcine PBMCs reveals lipopolysaccharide-induced immunomodulatory responses and crosstalk of immune and glucocorticoid receptor signaling. Virulence. 2021;12(1):1808–1824.
- Lee J-Y, Hall JA, Kroehling L, et al. Serum amyloid a proteins induce pathogenic Th17 cells and promote inflammatory disease. Cell. 2020;180(1):79–91.e16.
- Zhuang YT, Xu D Y WGY, et al. IL-6 induced lncRNA MALAT1 enhances TNF-α expression in LPS-induced septic cardiomyocytes via activation of SAA3. Eur Rev Med Pharmacol Sci. 2017;21(2):302–309.
- Kolev M, Barbour T, Baver S, et al. With complements: C3 inhibition in the clinic. Immunol Rev. 2023;313(1):358–375.
- Geisbrecht BV, Lambris JD, Gros P. Complement component C3: a structural perspective and potential therapeutic implications. Semin Immunol. 2022;59:101627.
- Kanehisa M, Furumichi M, Tanabe M, et al. KEGG: new perspectives on genomes, pathways, diseases and drugs. Nucleic Acids Res. 2017;45(D1):D353–D361.
- Medvedev AE. Toll-like receptor polymorphisms, inflammatory and infectious diseases, allergies, and cancer. J Interferon Cytokine Res. 2013;33(9):467–484.
- Ibeagha-Awemu EM, Lee J-W, Ibeagha AE, et al. Bacterial lipopolysaccharide induces increased expression of toll-like receptor (TLR) 4 and downstream TLR signaling molecules in bovine mammary epithelial cells. Vet Res. 2008;39(2):11.
- Capece D, Verzella D, Flati I, et al. NF-κB: blending metabolism, immunity, and inflammation. Trends Immunol. 2022;43(9):757–775.
- Khan MZ, Khan A, Xiao J, et al. Overview of research development on the role of NF-κB signaling in mastitis. Animals. 2020;10(9):1625.
- Liang W-J, Yang H-W, Liu H-N, et al. HMGB1 upregulates NF-kB by inhibiting IKB-α and associates with diabetic retinopathy. Life Sci. 2020;241:117146.
- Platnich JM, Muruve DA. NOD-like receptors and inflammasomes: a review of their canonical and non-canonical signaling pathways. Arch Biochem Biophys. 2019;670:4–14.
- Peters K, Peters M. The role of lectin receptors and their ligands in controlling allergic inflammation. Front Immunol. 2021;12:635411.
- Hardison SE, Brown GD. C-type lectin receptors orchestrate antifungal immunity. Nat Immunol. 2012;13(9):817–822.
- Damasceno LEA, Prado DS, Veras FP, et al. PKM2 promotes Th17 cell differentiation and autoimmune inflammation by fine-tuning STAT3 activation. J Exp Med. 2020;217(10):e20190613.
- Keane MP, Strieter RM. Chemokine signaling in inflammation. Crit Care Med. 2000;28(Supplement):N13–N26.