
Abstract
Yak is an important dominant livestock species at high altitude, and the growth performance of yak has obvious differences under different feeding methods. This experiment was conducted to compare the effects of different feeding practices on growth performance and meat quality of yaks through combined transcriptomic and metabolomic analyses. In terms of yak growth performance, compared with traditional grazing, in-house feeding can significantly improve the average daily weight gain, carcass weight and net meat weight of yaks; in terms of yak meat quality, in-house feeding can effectively improve the quality of yak meat. A combined transcriptomic and metabolomic analysis revealed 31 co-enriched pathways, among which arginine metabolism, proline metabolism and glycerophospholipid metabolism may be involved in the development of the longissimus dorsi muscle of yak and the regulation of meat quality-related traits. The experimental results increased our understanding of yak meat quality and provided data materials for subsequent deep excavation of the mechanism of yak meat quality.
Introduction
The yak is an important large mammal living in highland areas,Citation1 which has exceeded 20 million worldwide, and is mainly distributed in high-altitude areas between 3000 and 5000 m.Citation2 More than 95% of the world’s yaks are mainly in the alpine and low-oxygen areas cantered on the Qinghai-Tibetan Plateau in China,Citation3 which is an important dominant livestock species in plateau animal husbandry.Citation4 The distribution area of yaks is characterized by low temperature, large temperature difference between day and night, strong radiation and low oxygen partial pressure, etc. Under the influence of long-term special ecological environment and natural selection, yaks have the advantages of high resistance to disease, strong resistance to adversity and strong vitality, etc.,Citation5 and the unique genetic mechanism of yaks has been formed in the process of natural evolution. Due to the yak living in the cold region of plateau for a long time, coupled with the lack of technology of grassroots personnel and the backward form of feeding management, these reasons limit the growth and development of the yak.Citation6 As a result, the economic value of yaks cannot be properly realized, and although the relevant grass-roots research departments have taken corresponding countermeasures, the situation of ‘relying on the sky to feed the animals’ has not been fundamentally resolved.
The ‘Ashdan Yak’ is a new breed of yak bred by the Lanzhou Institute of Animal Husbandry and Veterinary Medicine of the Chinese Academy of Agricultural Sciences (CAAS) and the Datong Breeding Farm of Qinghai Province after more than 20 years of efforts.Citation7 The Ashdan yak is characterized by high meat yield, high reproductive capacity and mild temperament.Citation8 Compared with other horned yaks, Ashdan yaks are easier to be managed and reared by herdsmen breeders. As the first hornless yak breed in the world, the Ashdan yak is conducive to the improvement of the ecological environment as well as the economic development of Qinghai and other highland areas,Citation9 and has been well promoted with a wide range of applications. Therefore, it is of great significance to study the complex quantitative traits and important economic traits of the Ashdan yak.Citation10
Transcriptomics is a discipline that reveals complex biological pathways and molecular mechanisms through the study of gene expression and regulation,Citation11,Citation12 which allows for the mining of candidate genes related to specific functions,Citation13 and is able to reflect the molecular response to specific physiological processes at the transcriptional level.Citation14,Citation15 The transcriptome has spatial and temporal properties,Citation16 which allows for a more comprehensive interpretation of gene expression in specific tissues,Citation17 which in turn leads to a deeper excavation of the biological functions of the relevant genes.Citation18,Citation19 Metabolomics is the study of metabolites in tissues and changes in metabolites due to different factors (genetic, environmental or disease, etc.).Citation20,Citation21 Because metabolites are the end products of the genome,Citation22 the corresponding changes in metabolite species and content can form a more direct relationship with changes in animal phenotype, so metabolomics is also the closest to phenotypic changes.Citation23,Citation24 Untargeted metabolomics allows for a comprehensive analysis of endogenous small molecule metabolites in organismsCitation25,Citation26 and is also more widely used than targeted metabolomics. A single transcriptomics analysis of results acting on multiple substances cannot directly determine the extent of changes in metabolites that lead to changes in metabolites, whereas metabolomics can unearth differences in metabolite species in the metabolic pathway, which is important for a comprehensive analysis of biosynthesis and regulatory mechanisms. Carrillo et al.,Citation27 using transcriptome and metabolome, identified biological pathways associated with differences in grass-fed and grain-fed Angus cattle. Grass-fed cattle produce lower total fat and less blood stress. This will provide greater insight into the merits and mechanisms of muscle development. Li et al.,Citation28 applied multi-omics technology to study the longest dorsal muscle tissues of Guangling donkeys with different meat tenderness and screened differentially expressed genes and differential metabolites. The joint analysis showed that the significantly differentially expressed genes and metabolites played key regulatory roles in the metabolic pathway, and could be used as potential candidate genes and metabolites for meat tenderness, which could provide a theoretical basis for the investigation of the molecular regulatory mechanism of meat tenderness and molecular breeding. Zhan et al.,Citation29 conducted comprehensive transcriptomics and metabolomics analyses of intramuscular fat (IMF) and meat colour traits in Enshi black pigs, revealing multiple pathways, such as adipogenesis and catabolism, and screened several functional genes, emphasizing nicotinamide metabolism and glutathione metabolism as important trait-related pathways. The results provide a basis for further research on the biological mechanism of IMF deposition. Liu et al.Citation30 analysed the effects of CRTC3 overexpression on the metabolomics and transcriptome profiles of porcine subcutaneous white adipocytes through a multi-omics association, revealing the metabolic effects of CRTC3 on porcine adipocytes.CRTC3 overexpression altered the expression of genes and pathways related to adipogenesis, fatty acid metabolism and glycerol phospholipid metabolism in vitro. Sun et al.Citation31 utilized transcriptomic and metabolomic approaches to analyse the transcriptomic data and fatty acid composition of four vital metabolic tissues (rumen, liver, muscle and dorsal fat) in cattle, exploring the molecular regulatory mechanisms within these tissues that promote the formation of fatty acids in cattle. This research holds significant promise for future cattle breeding initiatives. Xi et al.Citation32 studied the differences in the transcriptome-level fatty acid metabolism pathway of Bamei pork. The results showed that the metabolism levels of DX3 and DX4 were significantly higher than those of other fatty acids. Additionally, the study found that the differences in the G1 and G2 genes played an important regulatory role in fatty acid metabolism, which affects the quality of pork. These findings are of great significance for understanding the species’ traits and gene functions.
Multi-omics analysis can better illustrate the cellular life process from different dimensions, obtain the dynamic changes in the growth and development of the animal body, and then deeply study the regulatory mechanisms related to complex traits.Citation33 Yak as an important genetic resource pool, analysing the genetic mechanisms of economically important traits using multi-omics is an important task in this field of research.Citation34,Citation35 In this experiment, we selected the longissimus dorsi muscle of 12 Ashan yaks from the Datong Breeding Farm in Qinghai Province for transcriptomic and metabolomic studies to screen out differentially expressed genes and metabolites, to reveal the biogenetic mechanism of yak meat quality, and to provide a scientific basis for the selection of yak meat for breeding and efficient production.
Materials and methods
Ethics statement
All animal studies conducted in this study were approved by the Animal Administration and Ethics Committee of Lanzhou Institute of Husbandry and Pharmaceutical Sciences, CAAS (SYXK-2014–0002).
Experimental design and sample collection
In this experiment, 12 male Ashdan yaks (4 years old) were selected from the Datong Breeding Yak Farm in Qinghai Province, and were divided into fattening group (Group F) and grazing group (Group Y) according to the feeding method in the farm, of which 6 were in each group. The experimental period was from April 5 2019 to October 2 2019, and the experimental group was reared in full housing, with a preparatory trial of 10 d and a formal trial of 170 d. Group F was prepared with total mixed ration (TMR) feed in strict accordance with the Beef Cattle Feeding Standard (NY/T 815-2004), as shown in . During the preparatory test, all the yaks were dewormed internally and externally, and the experimental group was provided with basic food once a day in the morning and once in the evening, and water was freely available for drinking, and the food intake of yaks in the experimental group was kept and recorded at any time. The control group (grazing group) was treated by grazing alone in natural pasture without anthropogenic supplementation.
Table 1. Composition of the basal diet in the experimental group.
All test yaks were fasted and dehydrated for 24 h before sampling and slaughtering, and yak slaughtering was carried out in accordance with the National Standard of the People’s Republic of China, ‘Cattle Slaughtering Operation Procedures’ (GB/T 19477-2004). Carcass and live weights of pre-slaughter yaks were recorded and eye muscle area and slaughter rate were measured. Meat colour, shear, cooking loss and pH of the longissimus dorsi muscle between the 12th and 13th pairs of ribs of yaks were measured at 45 min and 24 h. Finally, the longissimus dorsi muscle samples were cut into 1–3 cm3 pieces, transported back to the laboratory using dry ice, and stored in a −80 °C refrigerator for long-term storage.
RNA-Seq analysis
Total RNA was extracted from yak longissimus dorsi muscle tissue using Trizol reagent, and the whole process was carried out in an ultra-clean bench. Total RNA concentration and purity were examined using an Agilent 2100 Bioanalyzer, and finally total RNA integrity was examined by 1% agarose gel electrophoresis. The mRNA was then enriched with magnetic beads with Oligo (dT), and the library was constructed using TruSeq stranded total RNA with Ribo-Zero Gold. The constructed libraries were qualified with an Agilent 2100 Bioanalyzer for QC and then sequenced using the Illumina HiSeqTM 2500 Sequencer to produce 125 or 150 bp bipartite data. After passing the quality control (QC), sequencing was performed using an Illumina sequencer.
The raw data generated in high-throughput sequencing are fastq format sequences. In order to get high quality data for subsequent analysis, quality filtering of raw reads is required. The data were first quality controlled, joints removed, and low quality bases and N bases filtered using TrimmomaticCitation36 software to obtain high quality clean reads. The use of HisatCitation37 was compared to the BosGru_v2.0 reference genome. Gene FPKMCitation38expression was quantified using CufflinksCitation39 software, HTseq-CountCitation40 software was applied to obtain the number of reads falling on the gene in each sample, and the data were normalized using the estimateSizeFactors function that comes with DESeq (2012) R packageCitation41 software. Differential genes with p values less than 0.05 and multiplicity of difference greater than 2 were selected for GO and KEGG functional enrichment analysis. The reads were assembled by StringTieCitation42 software to splice new transcripts, which should be more than 200 bp away from the existing annotation gene and not less than 180 bp in length. Variable shear events were detected using ASprofileCitation43software. SNP and INDEL analyses were performed using SamtoolsCitation44 and BcftoolsCitation45 software.
LC/MS untargeted metabolomic analysis
The metabolome samples were first pretreated by weighing 30 mg of the samples, adding 20μL of each of the internal standards (L-2-chlorophenylalanine, 0.3 mg/mL; Lyso PC17:0, 0.01 mg/mL, both configured from methanol), followed by the addition 400 μL of aqueous formaldehyde solution (CH3OH:H2O V:V = 4:1) for metabolite extraction. The processed samples were transferred to LC injection vials and stored at −80 °C in a refrigerator until LC/MS analysis. QC samples were prepared by mixing equal volumes of extracts from all samples, ensuring that the QC samples had the same volume as the rest of the samples. A liquid-mass spectrometry (MS) system consisting of AB ExionLC ultra-high performance liquid chromatography and AB Triple TOF 6600 high-resolution mass spectrometer was used for metabolomics analysis in this experiment. Chromatographic conditions included ACQUITY UPLC BEH C18 (100 mm × 2.1 mm, 1.7 um), column temperature (45 °C), mobile phase (A-water, B-acetonitrile), flow rate (0.4 mL/min) and injection volume (5 μL). MS conditions included ion source (ESI), and the samples’ MS signals were acquired using positive and negative ions respectively.
Joint transcriptomics and metabolomics analysis
This is because differential genes obtained from transcriptomics analysis alone will correspond to substances in multiple metabolic pathways, affecting the direct determination of the amount of metabolites accumulated. Metabolomics analysis can better identify differences in the types and ion abundance of metabolites in the pathways. Therefore, the joint analysis of transcriptomics and metabolomics on the same sample will be helpful to dig out the biological mechanisms related to yak meat quality traits and screen out the related genes and metabolites. Based on the transcriptomic and metabolomic data, expression correlation analysis was performed to construct KGML networks, etc.
Statistical analysis of data
Results such as production data were analysed using the t-test in GraphPad Prism 8 (GraphPad Software, La Jolla, CA) and expressed as mean standard deviation. Differences were judged to be significant when p < 0.05.
Results
Measurement of growth performance, slaughtering performance and meat quality
The experiment was conducted to determine the growth performance and slaughter performance of Ashdan yaks within groups Y and F, respectively (). It was found () that final body weight, average daily weight gain, carcass weight, net meat weight, slaughter rate and eye muscle area of Ashdan yaks in group F were significantly increased (p < 0.01) compared to group Y. The final body weight, carcass weight and net meat weight of the yaks in group F were 377.17, 208.04 and 176.23 kg, respectively, which were 70.34, 93.76 and 81.5 kg higher than that of the yaks in group Y, respectively. It indicates that the growth performance indexes of Ashdan yaks can be effectively improved by housed feeding in this experiment. Meat quality of the longissimus dorsi muscle of Ashdan yaks was determined at the time of sample collection and the results are shown in . The differences in pH (45mIn, 24h), cooking loss and shear were highly significant (p < 0.01) in yaks of group F compared to group Y. The differences in pH (45 min, 24 h), cooking loss and shear were highly significant (p < 0.01).
Figure 1. Radar plots of growth performance and longissimus dorsi muscle quality of Ashdan yaks in group Y and group F. (A) Slaughtering performance of Ashdan yak, (B) Determination of meat quality of Ashdan yak.
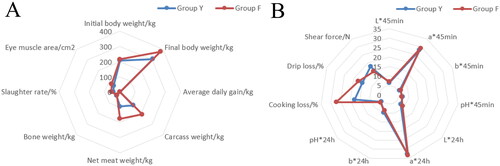
Table 2. Determination of growth performance and slaughtering performance of Ashdan yaks.
Table 3. Determination of the longissimus dorsi muscle quality of Ashdan yaks.
Transcriptome results and analysis
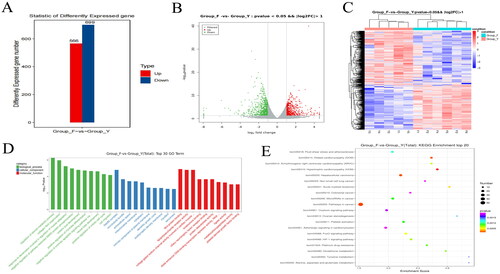
Since one yak died during the trial in group Y, we performed reference transcriptome sequencing on samples from a total of 11 yaks from both groups. A total of 77.79 G of CleanData was obtained, and the effective data volume of each sample was distributed in the range of 6.79–7.76 G, the Q30 bases were distributed in the range of 91.65–92.65%, and the average GC content was 51.82%; and the comparison rate with the reference genome was 86.63–95.05% (Schedule 1). We applied the FPKM method to the gene expression and the results are shown in (Schedule 2). As seen in , the results of the test grouping were more reasonable, with more homogeneous results within groups F and Y, and differences between the two groups, with the mean FPKM values of the genes in groups F and Y being 17.89 and 16.85, respectively. The FPKM densities of the genes in the two groups were more evenly distributed (), and intervalization of the FPKM revealed that the highest number of genes expressed in the samples was located at 0.5 < FPKM < 1 and the lowest at 1 < FPKM < 10 (). We tested the correlation between the samples, and the results were all greater than 0.8, indicating that the biological replication was good enough to continue with subsequent analyses (). ,F) shows a good distribution of samples between the two groups with more dispersed samples between groups and relatively clustered samples within groups. The differentially expressed genes were analysed and a total of 1265 differentially expressed genes were obtained from the two groups, including 566 up-regulated genes and 699 down-regulated genes (). Hierarchical clustering results showed significant differences in the expression profiles of the two groups of genes (, Schedule 3). GO enrichment analysis was performed to identify significantly enriched entries in differentially expressed genes, and at the transcriptome level, the differentially expressed genes compared between the two groups were significantly enriched in 1489 GO terms (p < 0.05). The main distributions were in the regulation of steroid metabolism, collagen fibre organization, denervation response, muscle adaptation regulation, negative regulation of phosphorylation of pathway-restricted SMAD proteins, positive regulation of myotube differentiation, positive regulation of the mitotic cell cycle, cell migration and regulation of myofibrils (, Schedule 4). KEGG enrichment analysis was performed used to identify significantly enriched entries in differentially expressed genes, and at the transcriptome level, the differential genes compared between the two groups were significantly enriched in 34 KEGG terms (p < 0.05). The main distribution was in the FoxO signalling pathway, HIF-1 signalling pathway, glutathione metabolism and tyrosine metabolism (, Schedule 5).
Figure 2. Expression level analysis of protein-coding genes of Ashtan yak in group Y and group F. (A) Box plots of gene expression levels in the two groups. Box plots for each region for five statistics (maximum, upper quartile, median, lower quartile and minimum, from top to bottom), (B) Density distribution plot of FPKM values for each sample. The horizontal coordinates of the points on the curve indicate the logarithmic value of the corresponding sample FPKM, and the vertical coordinates of the points indicate the probability density, (C) Distribution of gene expression of samples, (D) Plot of correlation coefficients between samples based on gene expression was obtained, (E) Sample 3D distribution, (F) Obtaining sample clustering based on gene expression. The horizontal coordinate indicates the sample name, the vertical coordinate indicates the corresponding sample name, and the colour represents the magnitude of the correlation coefficient.
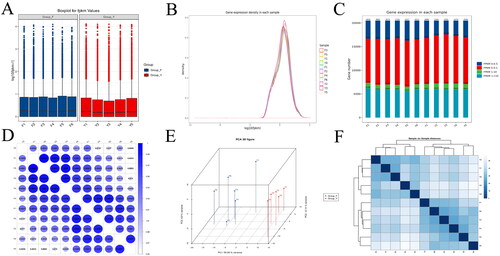
Figure 3. Number of differentially expressed mRNAs in Ashdan yaks in groups Y and F. (A) Histogram of differential gene expression statistics. The horizontal axis is the individual comparison groups; the vertical axis is the number of differentiated genes in the comparison groups, where up is the number of up-regulated genes that are significantly different and down is the number of down-regulated genes that are significantly different, (B) Volcano map of differentially expressed genes. Gary is non-significantly different genes, red and green are significantly different genes, (C) Cluster analysis of group differences in subgroups. The red colour in the figure indicates highly expressed genes and the blue colour indicates lowly expressed protein-coding genes, (D) GO enrichment analysis, (E) KEGG enrichment analysis.
Metabolome results and analysis
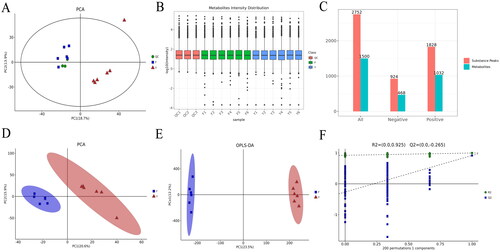
The test was prepared by mixing F1-F5 into F6 for metabolomics analysis. The stability and reproducibility of the analytical methods were evaluated using QC. Ion peaks with RSD > 0.4 in the QC group were removed. Unsupervised PCA identification model and QC metabolite intensity distribution were applied to assess inter-sample variability and QC variability, and the samples in the QC group were more clustered, indicating that there were differences in metabolite species and quantities between the two groups, and that the analytical method was stable and reproducible (). A total of 2752 substance peaks were extracted by total ion chromatography (924 in the negative ion mode and 1828 in the positive ion mode); 1500 metabolites were obtained by combined metabolite annotation using primary MS and secondary MS (468 in the negative ion mode and 1032 in the positive ion mode) (). Multivariate statistical analysis using unsupervised PCA and supervised OPLS-DA was seen to be effectively divided into two categories, and it was also found that within-group samples were closer and clustered together, with better data reproducibility; between-group samples were farther apart, suggesting that there were differences in metabolite phenotypes between the two groups (). The OPLS-DA model was built to prevent overfitting, and it was found that all Q2 points were lower than the rightmost original Q2 point and the regression line of Q2 was < 0 at the intersection of the vertical coordinates, and the intercepts of R2 and Q2 were 0.925 and −0.265, respectively, which indicated that the model was more stable and did not suffer from overfitting (, Schedule 6).
Figure 4. Principal component analysis and orthogonal partial least squares discriminant analysis of metabolites. (A) Principal component analysis of QC samples, (B) QC metabolite intensity distribution assessment, (C) Qualitative quantitative results. Substance peaks and metabolite statistics graphs, (D,E) Unsupervised PCA and supervised OPLS-DA for multivariate statistical analysis, (F) Permutation diagram. Loads can range from −1 to 1. Loads close to −1 or 1 indicate that the variable has a very strong effect on the component. A load close to 0 indicates that the variable has a very weak effect on the component.
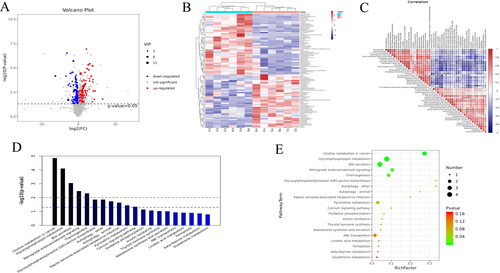
A total of 1500 metabolites were obtained in this study, and the differential metabolites were screened by the VIP value (VIP > 1) of the OLPS-DA model and the p value of the t-test (p < 0.05). From the results, it can be seen that 105 differential metabolites were initially identified, of which 56 were up-regulated and 49 were down-regulated, accounting for 53.33% and 46.67% of the total number of differential metabolites, respectively (, Schedule 7). The 105 differential metabolites screened were subjected to cluster analysis (), from which two groups can be clustered into two categories, suggesting that these clustered metabolites may have similar functional annotations or be in the same metabolic pathway, and that the differences in expression between the samples are obvious. The results of correlation analysis of the differential metabolites are shown in . KEGG enrichment analysis at the metabolome level revealed that a total of 32 pathways were significantly enriched (p < 0.05). The main distribution was in lipid metabolism, glycosylphosphatidylinositol (GPI), pyrimidine metabolism and oxidative phosphorylation (, Schedule 8).
Figure 5. Differential metabolite analysis. (A) Volcano diagram for VIP and P screening. The red dots represent differential metabolites that were significantly up-regulated in the experimental group, the blue dots represent differential metabolites that were significantly down-regulated, and the grey dots represent differential metabolites that were not significant, (B) Heat map of differential metabolites, (C) Correlation analysis plot of TOP-50 differential metabolites, (D) TOP-20 metabolic pathway enrichment map, (E) TOP-20 bubble chart.
Results of combined transcriptome and metabolome analysis
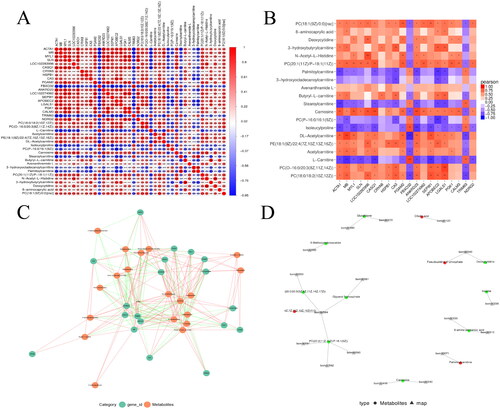
In order to understand the meat quality as well as the deeper regulatory mechanisms in Ashdan yak, the transcriptome and metabolome were comprehensively analysed by expression correlation analysis, pathway mapping, KEGG enrichment analysis and KGML network map in this study. Correlation analysis of the differentially expressed genes and metabolites of the two groups showed that the correlation between differentially expressed genes and metabolites was high, which indicated that the changes in differentially metabolites regulating the longissimus dorsi muscle of the Ashdan yak were related to the changes in differentially expressed genes (). Differential gene and differential metabolite association network maps were plotted according to p value < 0.05 (). Joint KEGG pathway coanalysis was performed, resulting in 31 co-enriched pathways, among which arginine metabolism, proline metabolism and glycerophospholipid metabolism may be involved in the regulation of the development of the longissimus dorsi muscle and meat quality traits in Ashdan yaks. The KGML network analysis was then plotted () (Schedule 9).
Figure 6. Joint transcriptomic and metabolomic correlation analysis. (A) Correlation matrix of gene expression and metabolites, (B) Correlation heat map, (C) Relevance network diagram, (D) KGML network diagram.
Discussion
As one of the important local livestock breeds in China, yak plays an important role in people’s diet, life and economic development. Yaks mainly feed on natural pasture and live in a pollution-free environment, so yak products are considered a natural green food.Citation46 Meanwhile, in order to adapt to the high altitude and low oxygen environment, the yak’s body will make corresponding adjustments, such as the metabolism of various types of amino acids, oxidative phosphorylation, the expression of genes related to glycolysis and the increase of myoglobin. In this experiment, we investigated the biological mechanisms regulating yak meat quality and longissimus dorsi muscle development through different feeding methods and in combination with transcriptome and metabolome.Citation47,Citation48 In this experiment, compared with group Y, there were significant differences in final body weight, average daily gain and net meat weight of yaks in group F, which increased by 70.34, 0.34 and 81.5 kg, respectively, which indicated that housed feeding could significantly improve yak performance. Shear force is a direct indicator of meat tenderness,Citation49 and is one of the most important factors influencing consumers’ choice of meat, which directly affects the edible and commercial value of meat. Meat tenderness is in turn affected by a variety of factors, including the content of intramuscular connective tissue, IMF content and muscle fibre diameter.Citation50 Yak meat is generally tougher and chewy because of its thicker muscle fibres. In this experiment there was a significant difference in the shear force of the housed F group compared to the Y group, which indicated that the shear force could be effectively reduced and the tenderness of the meat could be improved by housed feeding, and it has also been shown in numerous studies that housed feeding can effectively reduce the shear force value.Citation51–53 The pH in muscle is also one of the most important indicators of meat quality, with corresponding effects on tenderness and flavour, among others.Citation54 There is a strong positive correlation between pH and tenderness, the higher the pH the higher the tenderness.Citation55 The pH decreases gradually due to the production of lactic acid from glycolysis and the catabolism of ATP to produce phosphoric acid in the muscle after slaughter,Citation56 which is also consistent with the result that the pH at 24 h was lower than that at 45 min in this experiment. At the same time, this reduction in pH puts the cells in an acidic environment, where the ionic balance is disrupted, promoting the release of Ca2+ which in turn activates calpain, which then degrades fibrous proteins, resulting in an increase in the tenderness of the meat.Citation57 However, the decrease in pH also causes autolysis of μ-calcium-activating enzymes and a decrease in enzyme activity, which in turn leads to a decrease in the rate of myofibrillar protein hydrolysis.Citation58 This suggests that changes in pH will have an effect on the catalytic activity of endogenous enzymes in the organism, which in turn will have an effect on the degradation rate of myofibrillar proteins, and ultimately affect the tenderness of meat. In conclusion, reasonable housing can improve the production performance of yaks and yak meat quality.
In the transcriptome analysis, a total of 1265 differential genes (566 up-regulated and 699 down-regulated genes) were screened in both groups and were significantly enriched (p < 0.05) in 1489 GO entries, mainly in the collagen fibre organization (ADAMTS2, COL1A1, COL1A2, COL5A2, DPT, and P3H4), positive regulation of myotube differentiation (MAML1, MAMSTR, MYOG and SMYD1), myofibrillar ganglia (ARHGEF25, CALM3, FHOD3 and HABP4), cytoplasmic (CRYAB, ACTA1, HSPB1, SEPW1 and APOBEC2), and denervation and muscle adaptive regulation (FBXO32, HDAC4, MYOG and TRIM63), among others. A total of 34 KEGG entries were significantly enriched (p < 0.05), mainly in the FOXO signalling pathway (CCNB3, FOXO6, INSR, PIK3R1, PIK3CD, TGFB2, CCNG2, FBXO32 and FOXO3), tyrosine metabolism (FAH, AOX1, PNMT, TH and DDC), oxytocin signalling pathway (CACNG7, CACNA2D2, MYLK3, ROCK2 and MYLK4) and glutathione metabolism (MGST3, GPX4, GPX7 and GPX1). This suggests that the regulation of yak meat quality is not determined by a single factor, but is co-regulated by multiple factors. Actin alpha 1 (ACTA1) is a class of heterotrimeric forms of actin, which constitutes the main component of skeletal muscle contractile proteins, and is involved in the development of fibres and the movement of cells and organelles in skeletal muscle.Citation59 Sibut et al.Citation60 found that the expression of ACTA1 in the longissimus dorsi muscle of low-moon-old Korean cattle was significantly higher than that of high-moon-old Korean cattle, suggesting that this gene may be involved in the regulation of beef quality traits in Korean cattle. Venturini et al.,Citation61 in their study of ACTA1 and meat production traits in broiler chickens found that ACTA1 is involved in the production performance of broiler chickens and can be used as an important molecular marker to increase economically important traits in broiler chickens. Shin and ChungCitation62found that ACTA1 was differentially expressed in different grades of marbled beef, with low-grade marbled beef being significantly higher than high-grade marbled beef, which may indicate that ACTA1 is involved in the regulation of meat quality traits. The results of numerous studies have shown that ACTA1 is a major candidate gene that affects the quality of livestock and poultry meat. F-box protein 32 (FBXO32) is an E3 ubiquitin-protein ligase that plays an important role in the ubiquitin-proteinase pathway and has been shown to be one of the major pathways for degrading myosin.Citation63 Wang et al.Citation64 found that FBXO32 plays an important role in regulating muscle development and muscle proteolysis. Chen et al. found that FBXO32 was significantly associated with carcass and meat quality traits, but not with growth traits.Citation65 However, it has also been shown that this gene may be a candidate locus for muscle and fat deposition, and its mutation may affect the production performance of livestock.Citation66
In the metabolome level analysis, 105 differential metabolites were identified (56 up-regulated and 49 down-regulated). One of them, L-Carnitine (L-Carnitine), is a vitamin-like nutrient involved in fatty acid metabolism in the body and promotes beta-oxidation of fatty acids. Ying et al. foundCitation67 that the addition of L-carnitine to the feed of fattening pigs significantly reduced the shear force of their longest dorsal muscles and increased their tenderness. The expression of L-carnitine in group F was significantly higher than that in group Y in this experiment. Also in the study of James et al.,Citation68 it was found that L-carnitine could improve meat quality by changing the meat colour. However, the specific regulatory mechanism of L-carnitine on yak meat quality needs to be further investigated and deeply explored. Carnosine is a natural water-soluble dipeptide composed of β-alanine and L-histidine, which is involved in animal growth, has been the oxidation of lipids and improves the meat quality of livestock and poultry. Ma et al. foundCitation69 that the colour redness value of the longissimus dorsi muscle of the pig’s back increased and the drip loss decreased after proper supplementation of carnosine, indicating that the quality of pork was effectively improved. The same results were also reflected in the study of Ma et al. The addition of carnosine significantly reduced drip loss, improved muscle tethering force and enhanced muscle quality and tenderness in muscles stored for 72 and 96 h.Citation70 Muscle tethering force measures the water retention capacity of meat, which is important for both flavour and tenderness.Citation71 D'Astous-PagéCitation72 found that pork with high expression of myostatin had better water holding capacity and meat colour value. The results of numerous studies have shown that myostatin can improve meat quality by reducing drip loss and increasing meat colour value.Citation73 By discovering the transient state of gene expression through transcriptome data, and then observing the final result of gene expression through transcriptome data, joint analysis can be performed to study the intrinsic formation mechanism of traits from different stages of transcription to metabolism. A total of 31 co-enriched channels were screened by co-analysing the functional enrichment of differential genes and differential metabolites, and a high correlation between differential genes and differential metabolites was also found. The regulation of the longissimus dorsi muscle of the yak is not determined by a single factor, but by a combination of multiple factors. The results revealed that the differential gene FBXO32 and the differential metabolite L-carnitine showed a positive and strong correlation, suggesting that they are involved together in the regulation of the longissimus dorsi muscle in yaks. Similarly FBXO32 and DL-acetylcarnitine also showed strong positive correlation. However, the current research on the key regulatory genes for yak meat quality is not deep enough, especially the correlation between the key genes and traits of yak meat quality still needs to be further explored, so as to improve the yak meat industry and yak meat quality.
Conclusion
In this study, 1265 differential genes and 105 differential metabolites were obtained from the two histological studies by combining the transcriptome and metabolome to compare the longissimus dorsi muscle characteristics of grazing and housed yaks, respectively. Genes (ACTA1 and FBXO32, etc.) and metabolites (L-carnitine and myostatin, etc.) potentially involved in yak meat quality regulation were screened. And these related genes were found to have significant correlations with metabolites, which may be jointly involved in the regulatory role of yak meat quality. Yak meat is rich in nutrients, unique in flavour, and rich in a variety of essential amino acids. However, due to the special environment of yaks and the fact that most yaks are raised in grazing mode, the tenderness of yak meat is poorer than that of other cattle breeds, and screening for related regulatory genes or metabolites to improve the quality of yak meat is particularly critical. Meat tenderness, as an important indicator of meat quality, needs to be further investigated so as to reveal the molecular mechanisms regulating yak meat tenderness and provide a theoretical basis for improving yak meat quality marker-assisted breeding.
Authors’ contribution
Conceptualization, T.W., X.M. and P.Y.; methodology, T.W.; software, T.W. and X.M.; formal analysis, Q.Z. and C.M.; investigation, Z.Z.; resources, X.W., M.C., and H.P.; data curation, H.P., C.L. and P.Y.; writing – original draft preparation, T.W.; writing – review and editing, T.W., X.M. and C.M.; visualization, Z.Z. and X.G.; supervision, P.Y.; project administration, P.Y.; funding acquisition, P.Y. All authors contributed to the article and approved the submitted version.
Institutional review board Statement
All animal studies conducted in this study were approved by the Animal Administration and Ethics Committee of Lanzhou Institute of Husbandry and Pharmaceutical Sciences, Chinese Academy of Agricultural Sciences (SYXK-2014–0002).
Supplemental Material
Download MS Excel (34.3 KB)Supplemental Material
Download MS Excel (13.1 KB)Supplemental Material
Download MS Excel (53.6 KB)Supplemental Material
Download MS Excel (920.2 KB)Supplemental Material
Download MS Excel (43.2 KB)Supplemental Material
Download MS Excel (374.3 KB)Supplemental Material
Download MS Excel (470.9 KB)Supplemental Material
Download MS Excel (4.4 MB)Supplemental Material
Download MS Excel (11.4 KB)Acknowledgements
The authors would like to thank the Key Laboratory of Yak Breeding Engineering in Gansu Province for providing the experimental conditions and the teachers and brothers for their help.
Disclosure statement
The authors declare no conflict of interest.
Data availability statement
Data used in this study are available from the corresponding author on reasonable request.
Additional information
Funding
References
- Wang H, Chai Z, Hu D, et al. A global analysis of CNVs in diverse yak populations using whole-genome resequencing. BMC Genomics. 2019;20(1):61.
- Qi XB, Zhang Q, He YX, et al. The transcriptomic landscape of yaks reveals molecular pathways for high altitude adaptation. Genome Biol Evol. 2019;11(1):72–85.
- Wu JG. The distributions of Chinese yak breeds in response to climate change over the past 50 years. Anim Sci J. 2016;87(7):947–958.
- Ruan CM, Wang J, Yang YX, et al. Proteomic analysis or Tianzhu White Yak (Bos grunniens) testis at different sexual developmental stages. Anim Sci J. 2019;90(3):333–343.
- Bao Q, Zhang XL, Bao PJ, et al. Using weighted gene co-expression network analysis (WGCNA) to identify the hub genes related to hypoxic adaptation in yak (Bos grunniens). Genes Genomics. 2021;43(10):1231–1246.
- Shi FY, Wang HC, Degen AA, et al. Rumen parameters of yaks (Bos grunniens) and indigenous cattle (Bos taurus) grazing on the Qinghai‐Tibetan Plateau. J Anim Physiol Anim Nutr (Berl). 2019;103(4):969–976.
- Fei G. Genome-wide selection and association analysis of early growth traits in Ashtan yak (Bos grunniens). Chin Acad Agric Sci. 2021;10:8–10.
- Wu XY, Zhou XL, Ding XJ, et al. The selection of reference genes for quantitative real-time PCR in the Ashidan yak mammary gland during lactation and dry period. Animals (Basel). 2019;9(11):943.
- Huang C, Ge F, Ren WW, et al. Copy number variation of the HPGDS gene in the Ashidan yak and its associations with growth traits. Gene. 2021;772:145382.
- Xu Y, Shi T, Cai HF, et al. Associations of MYH3 gene copy number variations with transcriptional expression and growth traits in Chinese cattle. Gene. 2014;535(2):106–111.
- Jian H, Li XJ, Coleman K, et al. SpaGCN: Integrating gene expression, spatial location and histology to identify spatial domains and spatially variable genes by graph convolutional network. Nat Methods. 2021;18(11):1342–1351.
- Oliveira PSND, Coutinho LL, Tizioto PC, et al. An integrative transcriptome analysis indicates regulatory mRNA-miRNA networks for residual feed intake in Nelore cattle. Sci Rep. 2018;8(1):17072.
- Chen ID, Rathi VK, DeAndrade DS, Jay PK. Association of genes with physiological functions by comparative analysis of pooled expression microarray data. Physiol Genom. 2013;45(2):69–78.
- Han Y, Li LZ, Kastury NL, Thomas CT, Lam MY, Lau E. Transcriptome features of striated muscle aging and predictability of protein level changes. Mol Omics. 2021;17(5):796–808.
- Capomaccio S, Vitulo N, Verini-Supplizi A, et al. RNA sequencing of the exercise transcriptome in equine athletes. PLoS One. 2013;8(12):e83504.
- Salilew-Wondim D, Tesfaye D, Hoelker M, Schellander K. Embryo transcriptome response to environmental factors: Implication for its survival under suboptimal conditions. Anim Reprod Sci. 2014;149(1-2):30–38.
- Hatzirodos NH, Irving-Rodgers HF, Hummitzsch K, Harland ML, Morris SE, Rodgers RJ. Transcriptome profiling of granulosa cells of bovine ovarian follicles during growth from small to large antral sizes. BMC Genomics. 2014;15:24.
- Fan X, Fu Y, Zhou X, et al. Single-cell transcriptome analysis reveals cell lineage specification in temporal-spatial patterns in human cortical development. Sci Adv. 2020;6(34):eaaz2978.
- Olivera-Martinez I, Schurch N, Li RA, et al. Major transcriptome re-organisation and abrupt changes in signalling, cell cycle and chromatin regulation at neural differentiation in vivo. Development. 2014;141(16):3266–3276.
- Amberg A, Riefke B, Schlotterbeck G, et al. NMR and MS methods for metabolomics. Drug Saf Eval. 2017;1641:229–258.
- Berk M, Ebbels T, Montana G. A statistical framework for biomarker discovery in metabolomic time course data. Bioinformatics. 2011;27(14):1979–1985.
- Serena MD, Bonafè M, Giudetti MA. Urinary metabolic biomarkers in cancer patients: an overview. Methods Mol Biol. 2021;2292:203–212.
- Goldansaz SA, Guo AC, Sajed T, Steele MA, Plastow GS, Wishart DS. Livestock metabolomics and the livestock metabolome: a systematic review. PLoS One. 2017;12(5):e0177675.
- Lindeque JZ, Van Rensburg PJJ, Louw R, et al. Obesity and metabolomics: metallothioneins protect against high-fat diet-induced consequences in metallothionein knockout mice. OMICS. 2015;19(2):92–103.
- Forcisi S, Moritz F, Kanawati B, Tziotis D, Lehmann R, Schmitt-Kopplin P. Liquid chromatography–mass spectrometry in metabolomics research: mass analyzers in ultra high pressure liquid chromatography coupling. J Chromatogr A. 2013;1292:51–65.
- Cheng J, Pan Y, Yang S, et al. Integration of transcriptomics and non-targeted metabolomics reveals the underlying mechanism of follicular atresia in Chinese buffalo. J Steroid Biochem Mol Biol. 2021;212:105944.
- Carrillo JA, He YH, Li YK, et al. Integrated metabolomic and transcriptome analyses reveal finishing forage affects metabolic pathways related to beef quality and animal welfare. Sci Rep. 2016;6(1):25948.
- Li W, Guan JW, Qiu LX, Sun YT, Du M. Study on the molecular mechanism of regulating tenderness of Longissimus Dorsi muscle of donkey based on transcriptomics and metabolomics. Acta Vett Zootech Sin. 2022;53:743–754.
- Zhan HW, Xiong YC, Wang ZC, et al. Integrative analysis of transcriptomic and metabolomic profiles reveal the complex molecular regulatory network of meat quality in Enshi black pigs. Meat Sci. 2022;183:108642.
- Liu JQ, Li J, Chen WT, et al. Comprehensive evaluation of the metabolic effects of porcine CRTC3 overexpression on subcutaneous adipocytes with metabolomic and transcriptomic analyses. J Anim Sci Biotechnol. 2021;12(1):19.
- Sun HZ, Zhu Z, Zhou M, Wang J, Dugan MR, Guan LL. Gene co-expression and alternative splicing analysis of key metabolic tissues to unravel the regulatory signatures of fatty acid composition in cattle. RNA Biol. 2021;18(6):854–862.
- Xi B, Luo J, Gao YQ, et al. Transcriptome–metabolome analysis of fatty acid of Bamei pork and Gansu Black pork in China. Bioprocess Biosyst Eng. 2021;44(5):995–1002.
- Hasin Y, Seldin M, Lusis A. Multi-omics approaches to disease. Genome Biol. 2017;18(1):83.
- Li QF, Zhao XB, Liu HL, Li N, Xie Z. A review of the research on taxonomic status in yak (Poephagus). Acta Zootaxonom Sin. 2006;31:520–524.
- Xu SY, Zhao LL, Xiao SJ, Gao TX. Whole genome resequencing data for three rockfish species of Sebastes. Sci Data. 2019;6(1):97.
- Bolger AM, Lohse M, Usadel B. Trimmomatic: a flexible trimmer for Illumina sequence data. Bioinformatics. 2014;30(15):2114–2120.
- Kim D, Langmead B, Salzberg SL. HISAT: a fast spliced aligner with low memory requirements. Nat Methods. 2015;12(4):357–360.
- Trapnell C, William BA, Pertea G, et al. Transcript assembly and quantification by RNA-Seq reveals unannotated transcripts and isoform switching during cell differentiation. Nat Biotechnol. 2010;28(5):511–515.
- Roberts A, Trapnell C, Donaghey J, Rinn JL, Pachter L. Improving RNA-Seq expression estimates by correcting for fragment bias. Genome Biol. 2011;12(3):R22.
- Anders S, Pyl PT, Huber W. HTSeq-a Python framework to work with high-throughput sequencing data. Bioinformatics. 2015;31(2):166–169.
- Anders S, Huber W. Differential expression of RNA-Seq data at the gene level-the DESeq package. Biol Comput Sci. 2012;12:f1000research.
- Pertea M, Pertea GM, Antonescu CM, Chang TC, Mendell JT, Salzberg SL. StringTie enables improved reconstruction of a transcriptome from RNA-seq reads. Nat Biotechnol. 2015;33(3):290–295.
- Florea L, Song L, Salzberg SL. Thousands of exon skipping events differentiate among splicing patterns in sixteen human tissues. F1000Res. 2013;2:188.
- Li H, Handsaker B, Wysoker A, et al. The Sequence Alignment/Map (SAM) format and SAMtools. Bioinformatics. 2009;25(16):2078–2079.
- Li H. A statistical framework for SNP calling, mutation discovery, association mapping and population genetical parameter estimation from sequencing data. Bioinformatics. 2011;27(21):2987–2993.
- Hao LZ, Yang X, Huang YY, et al. Using mineral elements to authenticate the geographical origin of Yak meat. Kafkas Üniv Vet Fakült Derg. 2019;25:93–98.
- Liu XC, Zhang S, Sun BZ, et al. Progress in understanding quality characteristics of yak meat. Meat Res/Roulei Yanjiu. 2020;34:78–83.
- Guan JQ, Long K, Ma J, et al. Comparative analysis of the microRNA transcriptome between yak and cattle provides insight into high-altitude adaptation. PeerJ. 2017;5:e3959.
- Onopiuk A, Półtorak A, Sun DW, Wierzbicka A. Effects of selected myofibrillar protein activities on beef tenderization process based on electrophoretic analysis. J Food Process Eng. 2018;41(1):e12596.
- Kemp CM, Sensky PL, Bardsley RG, Buttery PJ, Parr T. Tenderness–An enzymatic view. Meat Sci. 2010;84(2):248–256.
- Zhang P, Shang P, Zhang B, et al. Comparison of slaughtering performance and meat quality of Tibetan pigs under indoor feeding and grazing conditions. Chin J Anim Sci. 2019;55:107–109.
- Liu YX, Ma XM, Xiong L, et al. Effects of intensive fattening with total mixed rations on carcass characteristics, meat quality, and meat chemical composition of yak and mechanism based on serum and transcriptomic profiles. Front Vet Sci. 2020;7:599418.
- Skřivanová V, Tůmová E, Englmaierová M, Chodova D, Skrivan M. Do rearing system and free-range stocking density affect meat quality of chickens fed feed mixture with rapeseed oil? Czech J Anim Sci. 2017;62(4):141–149.
- Rahman MH, Hossain MM, Rahman SME, Amin MR, Oh DH. Evaluation of physicochemical deterioration and lipid oxidation of beef muscle affected by freeze-thaw cycles. Korean J Food Sci Anim Resour. 2015;35(6):772–782.
- Cassens RG, Carpenter CE, Eddinger TJ. An analysis of microstructural factors which influence the use of muscle as a food. Food Struct. 1984;3:2.
- Humada MJ, Sañudo C, Serrano E. Chemical composition, vitamin E content, lipid oxidation, colour and cooking losses in meat from Tudanca bulls finished on semi-extensive or intensive systems and slaughtered at 12 or 14 months. Meat Sci. 2014;96(2 Pt A):908–915.
- Rhee MS, Ryu YC, Imm JY, Kim BC. Combination of low voltage electrical stimulation and early postmortem temperature conditioning on degradation of myofibrillar proteins in Korean native cattle (Hanwoo). Meat Sci. 2000;55(4):391–396.
- Lomiwes D, Farouk MM, Frost DA, Dobbie PM, Young OA. Small heat shock proteins and toughness in intermediate pHu beef. Meat Sci. 2013;95(3):472–479.
- Latinkić BV, Cooper B, Towers N, Sparrow D, Kotecha S, Mohun TJ. Distinct enhancers regulate skeletal and cardiac muscle-specific expression programs of the cardiac α-actin gene in Xenopus embryos. Dev Biol. 2002;245(1):57–70.
- Sibut V, Hennequet-Antier C, Bihan-Duval L, Marthey S, Duclos MJ, Berri C. Identification of differentially expressed genes in chickens differing in muscle glycogen content and meat quality. BMC Genomics. 2011;12(1):112.
- Venturini GC, Stafuzza NB, Cardoso DF, et al. Association between ACTA1 candidate gene and performance, organs and carcass traits in broilers. Poult Sci. 2015;94(12):2863–2869.
- Shin SC, Chung ER. Identification of differentially expressed genes between high and low marbling score grades of the longissimus lumborum muscle in Hanwoo (Korean cattle). Meat Sci. 2016;121:114–118.
- Xie P, Guo SB, Fan YN, Zhang H, Gu DF, Li HH. Atrogin-1/MAFbx enhances simulated ischemia/reperfusion-induced apoptosis in cardiomyocytes through degradation of MAPK phosphatase-1 and sustained JNK activation. J Biol Chem. 2009;284(9):5488–5496.
- Wang AL, Zhang Y, Li MJ, Lan SY, Wang JQ, Chen h SNP identification in FBXO32 gene and their associations with growth traits in cattle. Gene. 2013;515(1):181–186.
- Chen B, Xu JG, He XM, et al. A genome-wide mRNA screen and functional analysis reveal FOXO3 as a candidate gene for chicken growth. PLoS One. 2015;10(9):e0137087.
- Cleveland BM, Evenhuis JP. Molecular characterization of atrogin-1/F-box protein-32 (FBXO32) and F-box protein-25 (FBXO25) in rainbow trout (Oncorhynchus mykiss): Expression across tissues in response to feed deprivation. Comp Biochem Physiol B Biochem Mol Biol. 2010;157(3):248–257.
- Ying W, Tokach MD, DeRouchey JM, et al. Effects of dietary L-carnitine and dried distillers grains with solubles on growth, carcass characteristics, and loin and fat quality of growing-finishing pigs. J Anim Sci. 2013;91(7):3211–3219.
- James BW, Owen KQ, Lawrence TE, et al. Interactive effects between paylean (ractopamine⋅ HCl) and dietary L-carnitine on finishing pig growth performance and carcass characteristics. Kansas Agric Exp Stat Res Rep. 2002;10:106–110.
- Ma XY, Lin YC, Jiang ZY, et al. Dietary arginine supplementation enhances antioxidative capacity and improves meat quality of finishing pigs. Amino Acids. 2010;38(1):95–102.
- Ma XY, Jiang ZY, Lin YC, Zheng CT, Zhou GL. Dietary supplementation with carnosine improves antioxidant capacity and meat quality of finishing pigs. J Anim Physiol Anim Nutr (Berl). 2010;94(6):e286–e295.
- Dransfield E, Sosnicki AA. Relationship between muscle growth and poultry meat quality. Poult Sci. 1999;78(5):743–746.
- D'Astous-Pagé J, Gariépy C, Blouin R, et al. Carnosine content in the porcine longissimus thoracis muscle and its association with meat quality attributes and carnosine-related gene expression. Meat Sci. 2017;124:84–94.
- Cong J, Zhang L, Li J, Wang S, Gao F, Zhou G. Effects of dietary supplementation with carnosine on meat quality and antioxidant capacity in broiler chickens. Br Poult Sci. 2017;58(1):69–75.