
Abstract
Planned breeding and conservation strategies for a lesser-known population require an assessment of complete genetic diversity and population structure analysis in addition to its morphometric characteristics. In the present study, a comparative analysis of the genetic structure of a rare buffalo population, namely Chhattisgarhi, was extensively studied using a panel of FAO-recommended microsatellite markers along with well-established breeds namely Murrah, Nili-Ravi, Gojri, Kalahandi, and Nagpuri. Mode shift analysis indicated the absence of genetic bottleneck in the recent past. Assessment of genetic diversity indices across all loci indicated the presence of sufficient genetic variation within and between populations. Analysis of molecular variance between the six different buffalo populations attributed 19.05% of the variations to between-population differentiation. Cluster analyses using DAPC and Bayesian approach along with the phylogenetic tree based on UPGMA grouped six populations into three groups. The Chhattisgarhi population was revealed to be genetically closer to Nagpuri and Kalahandi populations. The study reveals the presence of sufficient genetic diversity within the Chhattisgarhi population and indicates the absence of a systematic selection program. We suggest improvement and conservation programs should be planned for this breed in the near future through short-term selection.
Introduction
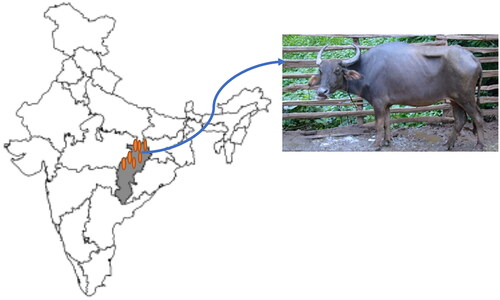
In the recent past, a large population of interbred non-descript buffaloes have evolvedCitation1 causing a negative impact on the diversity and uniqueness of comparatively lesser-known local breeds of buffalo like Chhattisgarhi. As per theCitation2 79.7% of buffaloes are either non-descript or grades of pure breeds. A genetic marker-based examination of a population structure and its comparison with breeds from the surrounding area and well-known milch buffalo breeds can be used to genetically characterize a population. Being neutral, codominant, ubiquitous, and highly polymorphic, microsatellite markers have been most commonly used for the study of genetic diversity in different domestic animal species.Citation3 In the present study, comparative assessment of the genetic structure of Chhattisgarhi buffalo population with other well-established breeds of buffaloes was done using 15 microsatellite markers. Chhattisgarhi buffalo has its breeding tract in the northern hilly and central plain areas of Chhattisgarhi () state and has been defined well based on its morphological characteristics and is reared under unique system of management ‘Bathan’.Citation4 Five different buffalo breeds namely Murrah, Nili-Ravi, Gojri, Nagpuri, and Kalahandi were used for comparative analysis. Such a comparative genetic study identifies the hidden production potential of the uniquely adapted breeds to various geographical regions of India, and their genetic characterization will aid in formulating breed-specific conservation and genetic improvement programs.
Figure 1. Map highlighting the breeding tract of Chhattisgarhi buffalo.
Materials and methods
Sampling and DNA extraction
With the consent of herd owner, 5-10 ml of blood samples of 48 healthy buffaloes representing the original indigenous true-to-type phenotype of Chhattisgarhi buffalo population were selected for this study from the native tract following the guidelines of measurement of the domestic animal diversity program.Citation5 Whole genomic DNA was isolated using the standard phenol-chloroform method described by Sambrook and Russel.Citation6 The primers for 24 microsatellite markers as suggested by ISAG-FAO were used. The genotyping was carried out by following the protocol of Mishra et al.Citation7 and Singh et al.Citation8 with ABI PRISM 3100 automatic sequencer (Applied Biosystems, Foster City, CA, USA). To maximize the throughput, products were amplified by different primers with different dyes were pooled for one capillary injection. GeneScan-500 LIZ™ Size Standard (Applied Biosystems) was used as the internal standard for fragment sizing. Internal lane size standard was run with every sample for accurate sizing. Gene Scan software was used to calculate the molecular weight (size) of different alleles/DNA fragments.Citation9 For comparative analysis 15 microsatellite markers (CSSM45, CSSM47, CSSM66, HEL13, ILSTS19, ILSTS25, ILSTS26, ILSTS28, ILSTS29, ILSTS30, ILSTS33, ILSTS56, ILSTS58, ILSTS60, ILSTS61) common in all six populations were taken (data for Kalahandi, Murrah and Nili-Ravi populations was taken from Animal Genomics lab, NBAGR, Karnal).
Statistical analysis
BOTTLENECK v1.2.01Citation10 was used to test for the departure from the mutation drift equilibrium and the presence of any bottleneck based on heterozygosity excess and heterozygosity deficit. The variance and probability were set at 12.00 and 95%, respectively for the estimation of Bottleneck with 5,000 simulations. Data analysis was done onCitation11 platform with the help of packages such as ‘adegenet’ v2.1.7Citation12 ‘poppr’ v2.9.3Citation13 and ‘hierfstat’ v0.5-11Citation14 ‘polysat’ v1.7Citation15 and ‘PopGenReport’.Citation16 Computation of genetic diversity indices, allele frequencies, and AMOVA were performed through the mentioned R packages. The effective number of alleles (NE) was calculated by using the software GenoDive©2005-2022.Citation17 UPGMACitation18 approach was used to construct a phylogenetic tree using the package ‘ape’ v5.6-2.Citation19 DAPC (Discriminant analysis of Principle components analysis) was performed with the package ‘ada4’Citation20 and ‘adegenet’ v2.1.7.Citation12 Population assignment was done by the ‘ParallelStructure’ package, which is based on STRUCTURE v2.3.4.Citation21 The most likely number of subpopulations was found by the Evanno ΔK methodCitation22 using the package ‘POPHELPER’ v3.0.4.Citation23
Results
The status of any bottleneck in the population was inferred from the sign, standardized, and Wilcoxon tests. There were 14 loci with significant heterozygosity excess for all three models (IAM, TPM, and SMM) (). Probability values for the null hypothesis for bottleneck were calculated through Mode shift analysis that followed L-shaped curve when microsatellite alleles were classified into ten frequency classes ().
Figure 2. L-shaped mode shift curve showing absence of recent genetic bottleneck in Chhattisgarhi population.
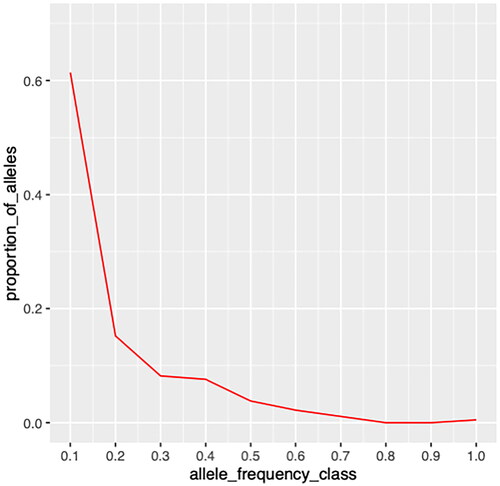
Table 1. Mutation-drift equilibrium, heterozygosity excess under different mutation models in Chhattisgarhi population.
Locus-wise details of overall populations are given (). No. of alleles across all the loci observed in the study were 270. A total of 112, 128, 160, 103, 91, and 92 alleles were found in Chhattisgarhi, Gojri, Kalahandi, Murrah, Nagpuri, and Nili-Ravi populations, respectively. Population-wise values for comparison among the populations are given (). Analysis of molecular variance (AMOVA) revealed 19.05% of total variations were present between studied populations, while 74.14% of variations in the population were within individuals of the population. A 6.80% of variation was attributed to between individuals within the population. The pair-wise FST values were used to illustrate the genetic distance between populations, which significantly differentiated all six buffalo populations, as shown in the FST heat map (). Chhattisgarhi buffaloes were found to have a low genetic distance from Nagpuri and Kalahandi while a higher genetic distance from Murrah and Nili-Ravi. UPGMA tree plot results showed two main clusters among all studied populations (). Discriminant analysis of principal components revealed that the first discriminant function on principal components explained 44.8% of the genetic variance. Populations in the data were grouped into three clusters as represented in the scatter plot (). Population assignment was accomplished in STRUCTURE for K = 2 to 7 and results are presented in the form of a bar plot (). Evanno ΔK method suggested the optimum value for K was 3 (). The proportion of the membership of each pre-defined population in each of the 3 clusters at a K value of 3 is given ().
Figure 3. Heat-map showing pairwise FST among six buffalo populations.
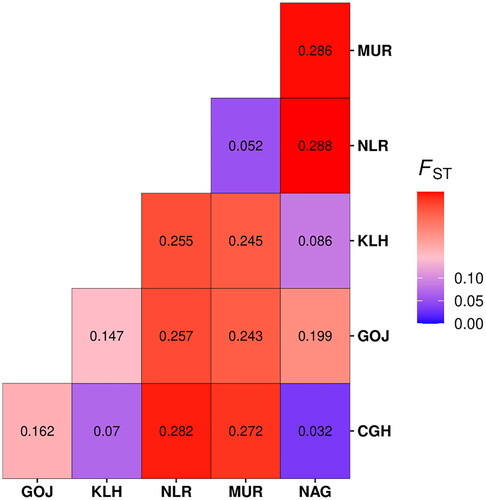
Figure 4. UPGMA tree inferring evolutionary distances of the six buffalo populations.
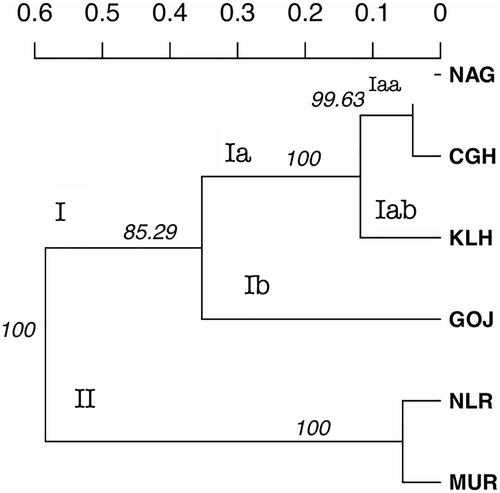
Figure 5. Scatter plot of individuals from buffalo populations clustered through discriminant analysis of principal components (DAPC).
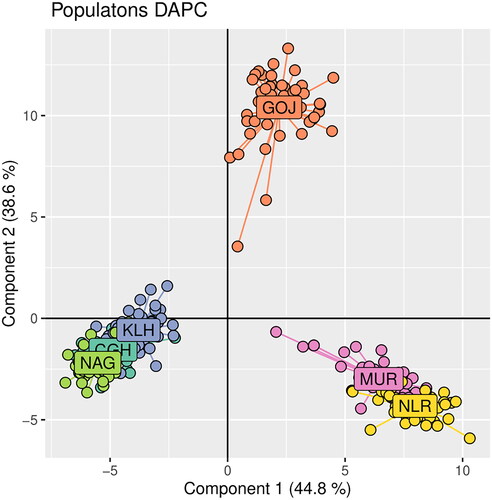
Figure 6. Cluster of individuals from different populations through bayesian genetic approach of STRUCTURE. Bars depict the individuals in a population and the color corresponds to the inheritance from different breeds. The 6 population studied are represented as CGH – Chhattisgarhi, GOJ – Gojri, KLH – Kalahandi, MUR – Murrah, NAG – Nagpuri, and NIR – Nili-Ravi.
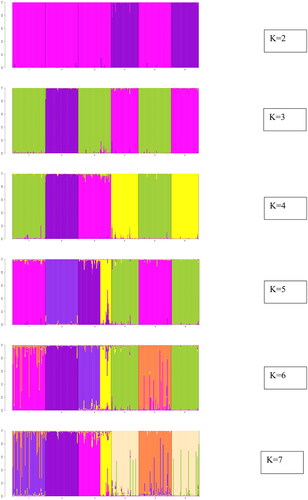
Figure 7. Evano’s plot showing the most likely number of genetic clusters present in the population.
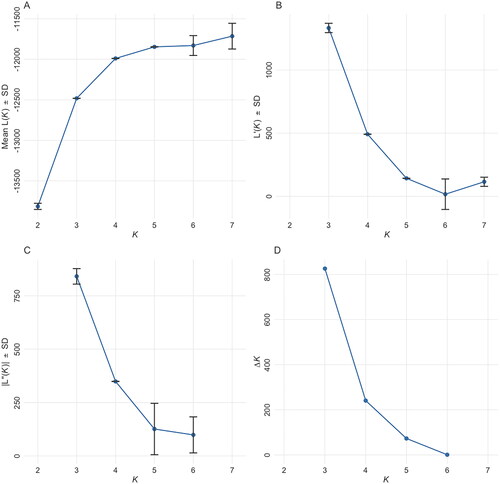
Table 2. Locus-wise genetic indices based on overall microsatellite data of six buffalo populations.
Table 3. Population-wise genetic indices of six buffalo populations.
Table 4. Results of STRUCTURE showing inferred cluster and ancestry of buffalo populations at K = 3.
Discussion
For the Standardized differences test, the p-value for the null hypothesis for mode shift equilibrium was significant for both TPM and SMM models. For the Wilcoxon test, which is a more robust and commonly used test for bottleneck analysis than the other two tests,Citation24 the p-value for the null hypothesis for mode shift equilibrium in both TPM and SMM models is > 0.05 thereby indicating no genetic bottleneck in recent past. Graphical representation of Allelic classes and proportion of allelesCitation25 was also observed to be a normal L-shaped distribution suggesting no evidence of a severe reduction in effective population size in the immediate past, thus no bottleneck.
The mean HE of 0.667 across all loci and populations indicated sufficient polymorphism to measure genetic variation.Citation26 The mean NA per locus was 7.467 for Chhattisgarhi; these were highest in Kalahandi (10.67) and lowest in Nagpuri buffaloes (6.06). The mean no. of alleles per locus in the present study is higher than reported by Mishra et al.Citation27 in Bunny and Murrah populations and by Vijh et al.Citation28 in 12 buffalo populations, however, El-Kholy et al.Citation29 found a higher Mean no. of alleles per locus among three buffalo breeds in Egypt. The mean expected heterozygosity (0.71-0.78) in the study was in the range of 0.608 to 0.753. Kumar et al.Citation30 reported higher mean expected heterozygosity (0.71-0.78) in a study involving eight populations, whereasCitation27 reported lower values (0.57-0.659). In the present study, buffalo populations from different regions depict a significant differentiation, attributable to their genetic distinctiveness. An overall moderate amount of inbreeding in the population was indicated by heterozygote deficiency was evident from the positive mean FIS value. This could be possible due to the mating of close relatives in the herds owned by livestock owners or due to genetic hitchhiking.Citation31 19.05% of variations between populations from results obtained from AMOVA suggest the distinctness of all six breeds. Between populations, variations were almost double thatCitation27 reported among five buffalo populations. As shown in the pair-wise FST heat map Chhattisgarhi buffalo was least differentiated from Nagpuri and Kalahandi, moderately from Gojri and the highest differentiation was found from Nili-Ravi and Murrah based on FST. Mishra et al.Citation26 and Kathiwavan et al.Citation32 reported FST values of 0.145 and 0.083 among the buffalo populations studied, which were lesser than the overall FST value of 0.173 in the present study. These results were also in compliance with the results from the factorial correspondence analysis based on molecular data and phylogenetic tree obtained from the dissimilarity matrix. According to UPGMA tree diagram () with two central clusters I and II, Chhattisgarhi and Nagpuri were grouped under one group (Iaa) and Kalahandi as a separate subgroup (Iab) in the same sub-cluster, while Gojri was placed under the cluster Ib. Murrah and Nili-Ravi were completely clustered differently as second central cluster (II). In the scatter plot of DAPC, Chhattisgarhi buffaloes are clustered with Nagpuri and Kalahandi, whereas Murrah and Nili-Ravi are clustered together. Meanwhile, Gojri was plotted on the opposite side of axis 2. STRUCTURE analysis for K = 2 shows there was no differentiation between Chhattisgarhi, Gojri, Nagpuri, and Kalahandi populations, whereas Murrah and Nili-Ravi populations were grouped under one cluster. For K = 3, Chhattisgarhi, Nagpuri, and Kalahandi buffaloes were grouped under one cluster, Gojri buffaloes as a separate cluster while Murrah and Nili-Ravi were grouped under the third cluster. Similar results for Murrah, Nili-Ravi and Gojri populations were reported by Kathiwavan et al.Citation33 This indicated that studied populations reared in other geographic regions have differentiated and possess unique allelic combinations than those reared in similar geographical areas. Presently the breeding areas of all these similarly grouped populations are overlapping.
Conclusion
Microsatellite loci used in the study were found sufficiently polymorphic, indicating that they were suitable for genetic diversity analysis in buffalo populations. Chhattisgarhi buffalo population is genetically closer to the Nagpuri and Kalahandi buffalo breeds but well differentiated from the Murrah and Nili-Ravi breeds of buffaloes. Hence, based on the findings of the present study it is recommended to State or Central Govt. implementing agencies to formulate an improvement and conservation program, which in long run will establish this breed and shall uplift the sustenance income of the local buffalo-rearing farmers from Central India.
Supplemental Material
Download MS Word (14.4 KB)Acknowledgments
The authors thank the Directors of ICAR-NDRI and ICAR-NBAGR for their support to carry out the study. Technical support received from Mr. Subhash Chander, T-5, NBAGR, is gratefully appreciated.
Disclosure statement
All authors declare that they have no conflict of interest.
Additional information
Funding
References
- Joshi BK, Sodhi M, Mukesh M, Mishra BP. Genetic characterization of farm animal genetic resources of India: a review. Ind J Anim Sci. 2012;82(11):1–8.
- 20th Livestock Census. 2019. All India report. Department of animal husbandry and dairying. dahd.nic.in. https://dahd.nic.in/animal-husbandry-statistics.
- Olschewsky, A.; Hinrichs, D. An Overview of the Use of Genotyping Techniques for Assessing Genetic Diversity in Local Farm Animal Breeds. Animals 2021;11:2016. DOI: 10.3390/ani11072016
- Vohra V, Singh M, Mukherjee K, Kataria RS. Identification and characterization of Chhattisgarhi buffalo population in India. Ind J Anim Sci. 2016;87(2):182.
- FAO. Molecular Genetic Characterization of Animal Genetic Resources. Rome: FAO Animal Production and Health Guidelines; 2011.
- Sambrook J, Russel DW. Molecular Cloning, Animal Laboratory Manual. Cold Spring Harbor, NY: Cold Spring Harbor Laboratory Press; 2001.
- Mishra BP, Kataria RS, Kathiravan P, Singh KP, Sadana DK, Joshi BK. Microsatellite based genetic structuring reveals unique identity of Banni among river buffaloes of Western India. Livestock Science 2010;127(2–3):257–261. DOI: 10.1016/j.livsci.2009.09.011.
- Singh NP, Vohra V, Das R, Verma U, Tantia MS, Kataria RS. Elucidating the genetic diversity using SSR based markers in Gojri buffalo. Ind J Anim Sci. 2019;89(5):522–8.
- Vohra V, Sodhi M, Niranjan SK, et al. Characterization of rare migratory cattle and evaluation of its phylogeny using short-tandem-repeat-based markers. J Appl Anim Res. 2017;45(1):355–363.
- Cornuet JM, Luikart G. Description and power analysis of two tests for detecting recent population bottlenecks from allele frequency data. Genetics. 1996;144(4):2001–2014.
- R 4.1.2. 2022. A Language and Environment for Statistical Computing. Vienna: R Foundation for Statistical Computing. https://www.R-project.org/.
- Jombart T. Adegenet: a R package for the multivariate analysis of genetic markers. Bioinformatics. 2008;24(11):1403–1405.
- Kamvar ZN, Tabima JF, Grünwald NJ. Poppr: an R package for genetic analysis of populations with clonal, partially clonal, and/or sexual reproduction. PeerJ. 2014;2:e281.
- Goudet J. HIERFSTAT, a package for R to compute and test hierarchical F-statistics. Mol Ecol Notes. 2005;5(1):184–186.
- Clark LV, Jasieniuk M. Polysat: An R package for polyploid microsatellite analysis. Molecular Ecology Resources 2011;11:562–566.
- Adamack AT, Gruber B. PopGenReport: simplifying basic population genetic analyses in R. Methods Ecol Evol. 2014;5(4):384–387.
- Meirmans PG. GENODIVE version 3.0: easy-to-use software for the analysis of genetic data of diploids and polyploids. Mol Ecol Resour. 2020;20(4):1126–1131.
- Sokal, Michener. A statistical method for evaluating systematic relationships. University of Kansas Science Bulletin; 1958;38:1409–1438.
- Paradis E, Claude J, Strimmer K. APE: analyses of Phylogenetics and evolution in R language. Bioinformatics. 2004;20(2):289–290.
- Dray S, Dufour A. The ade4 package: implementing the duality diagram for ecologists. J Stat Soft. 2007;22(4):1–20.
- Pritchard JK, Stephens M, Donnelly P. Inference of population structure using multilocus genotype data. Genetics. 2000;155(2):945–959.
- Evanno G, Regnaut S, Goudet J. Detecting the number of clusters of individuals using the software STRUCTURE: a simulation study. Mol Ecol. 2005;14(8):2611–2620.
- Adamack AT, Gruber B. Landgenreport: a new R function to simplify landscape genetic analysis using resistance surface layers. Mol Ecol Resour. 2015;15(5):1172–1178.
- Peery MZ, Kirby R, Reid BN, et al. Reliability of genetic bottleneck tests for detecting recent population declines. Mol Ecol. 2012;21(14):3403–3418.
- Luikart G, Allendorf FW, Cornuet JM, Sherwin WB. Distortion of allele frequency distributions provides a test forrecent population bottlenecks. J Hered. 1998;89(3):238–247.
- Takezaki N, Nei M. Genetic distances and reconstruction of phylogenetic trees from microsatellite DNA. Genetics. 1996;144(1):389–399.
- Mishra BP, Kataria RS, Kathiravan P, Bulandi SS, Singh KP, Sadana DK. Evaluation of genetic variability and mutation drift equilibrium of Banni buffalo using multi locus microsatellite markers. Trop Anim Health Prod. 2009;41(7):1203–1211.
- Vijh RK, Tantia MS, Mishra B, Bharani Kumar ST. Genetic relationship and diversity analysis of Indian water buffalo (Bubalus bubalis. J Anim Sci. 2008;86(7):1495–1502.
- El-Kholy A, Hoda Hassan Z, Amin, H, Mohamed . Genetic diversity in Egyptian buffalo using microsatellite markers. Arab J Biotech. 2007;10:219–232.
- Kumar S, Gupta J, Niraj K, et al. Genetic variation and relationships among eight Indian riverine buffalo breeds. Mol Ecol. 2006;15(3):593–600.
- Mishra BP, Kataria RS, Bulandi SS, Kumar V, Mukesh M. Genetic diversity in river buffalo (Bubalus bubalis) breeds of central India using heterologous bovine microsatellite markers. Journal of Applied Animal Research. 2008;33(2):159–163.
- Kathiravan P, Mishra BP, Kataria RS, Goyal S, Tripathy K, Sadana DK. Short tandem repeat based analysis of genetic variability in Kanarese buffalo of South India. Russian Journal of Genetics 2010;46(8):988–993. DOI: 10.1134/S1022795410080119.
- Vohra V, Singh NP, Chhotaray S, Raina VS, Chopra A, Kataria RS. Morphometric and microsatellite-based comparative genetic diversity analysis in Bubalus bubalis from North India. PeerJ. 2021;9:e11846.