
Abstract
Long non-coding RNAs (lncRNAs) are being studied in farm animals due to their association with traits of economic interest, such as fat deposition. Based on the analysis of perirenal fat transcriptomes, this research explored the relevance of these regulatory elements to fat deposition in suckling lambs. To that end, meta-analysis techniques have been implemented to efficiently characterize and detect differentially expressed transcripts from two different RNA-seq datasets, one including samples of two sheep breeds that differ in fat deposition features, Churra and Assaf (n = 14), and one generated from Assaf suckling lambs with different fat deposition levels (n = 8). The joint analysis of the 22 perirenal fat RNA-seq samples with the FEELnc software allowed the detection of 3953 novel lncRNAs. After the meta-analysis, 251 differentially expressed genes were identified, 21 of which were novel lncRNAs. Additionally, a co-expression analysis revealed that, in suckling lambs, lncRNAs may play a role in controlling angiogenesis and thermogenesis, processes highlighted in relation to high and low fat deposition levels, respectively. Overall, while providing information that could be applied for the improvement of suckling lamb carcass traits, this study offers insights into the biology of perirenal fat deposition regulation in mammals.
Introduction
In recent years, deep sequencing of transcriptomes has revealed the importance of new types of non-coding transcripts, such as long non-coding RNAs (lncRNAs), as regulators of gene expression.Citation1 LncRNAs are defined as RNA molecules longer than 200 nucleotides with low-coding to no coding potential. These RNAs are tissue-specific and have primary sequences that are less conserved across species than mRNAs.Citation2 LncRNAs control gene expression at a supragenomic layer that integrates genomic and epigenomic levels of gene control. In the nucleus, these molecules are involved in chromatin organization, direct transcription, and the modification of nascent RNAs, while in the cytoplasm, they modulate mRNA turnover, storage, and protein translation.Citation3–5
Growing catalogues of lncRNAs are being characterizedCitation6 for farm animals, driven by increasing examples of association between lncRNAs and phenotypes of interest. In this sense, adipose tissue, due to its importance in energy storage and other endocrine functions that help in the regulation of energy balance, appetite, immunity and reproduction, has been one of the key organs used to characterize lncRNA regulation in animals.Citation7
In sheep, several RNA-Seq studies have focused on comparisons between thin-tailed and fat-tailed sheep breeds to characterize the regulatory role of lncRNAs in fat deposition.Citation8–11 These studies demonstrated that lncRNAs play important roles in the biosynthesis of fatty acids in the tail and subcutaneous fat of adult sheep.Citation8,Citation9 However, less research has been conducted on how lncRNAs can regulate fat deposition in lambs. Two previous studies from our research group focused on characterizing the perirenal fat transcriptome of suckling lambs at commercial slaughter weights (10–12 kg).Citation12,Citation13 The choice of this reservoir is based on the fact that it represents a high proportion of the total fat in lamb during preweaning, and it is used as an indicator of carcass quality.Citation14
According to several studies, a major factor influencing the carcass tissue composition of suckling lambs is the breed.Citation15–20 Thus, the first transcriptomic study on perirenal fat from our group compared samples from suckling lambs of two different breeds, Churra and Assaf. These two breeds were selected because at the same standard commercial slaughter weight (11 kg of live weight), they differ in their fat carcass content, with Churra carcasses showing a greater cavity and intermuscular leg fat proportion than Assaf carcasses.Citation17 In the second mentioned study, Alonso-García et al.Citation12 analyzed perirenal transcriptome samples from a single breed (Assaf), comparing animals that, at the same slaughter weight, had different proportions of perirenal fat in the half-carcass.
Hence, considering the availability of the two datasets that focus on the study of fat deposition biological processes in suckling lambs, we hypothesize that there may be common regulatory mechanisms associated with different levels of fat deposition in suckling lambs, both between and within breeds. As previously shown in adult sheep for general fat deposition traitsCitation8,Citation9,Citation21, some of these regulatory mechanisms may be related to lncRNAs influencing gene expression regulation.
The lncRNA catalogues in farming animals remain incomplete compared to the mouse or human annotations.Citation6,Citation22 A common challenge to characterize lncRNAs resides in the limited number of samples analyzed in independent RNA-Seq studies. This is why it has been proposed to utilize expression datasets derived from multiple independent but related studies to accurately annotate and functionally characterize lncRNAs. In sheep, lncRNAs have been characterized across a multitissue datasetCitation23; however, there is only one study using meta-analysis procedures for that purpose.Citation24 Integration of RNA-Seq datasets allows to better determine transcripts and biological processes that could have been overlooked in individual experiments.Citation24 In addition, meta-analysis techniques have the advantage of increasing the available sample size by integrating related datasets and subsequently increasing the power to detect differentially expressed transcripts.Citation25,Citation26
Based on the complementary experimental designs of the two previously cited RNA-Seq studies from our research group related to suckling lamb fat depositionCitation12,Citation13, the objectives of this study are (1) to annotate and characterize the lncRNAs present in the perirenal fat transcriptome of Churra and Assaf suckling lambs using both RNA-Seq datasets and (2) to determine, through a meta-analysis, lncRNA regulatory elements involved in the control of fat deposition in suckling lambs that are commonly shared within breeds at the individual level and between breeds.
Materials and methods
Data collection
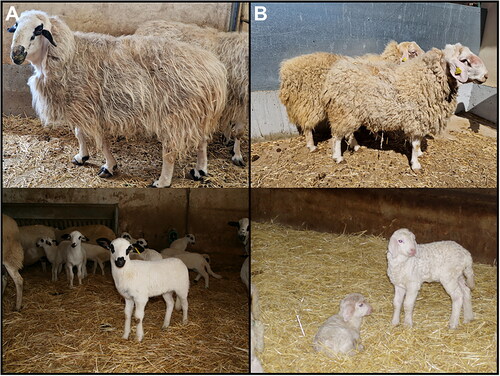
RNA-sequencing (RNA-Seq) datasets from the perirenal fat depot of suckling lambs were retrieved from two studies previously published by our own research group. Hence, we obtained the raw sequences related to the study of Suárez-Vega et al.Citation13 from the Gene Expression Omnibus (GEO) repository (GSE108314 accession number) and the raw sequences analyzed by Alonso-García et al.Citation12 from the BioStudies repository (E-MTAB-11839 accession number). In the study performed by Suárez-Vega et al.Citation13 the perirenal fat transcriptomes of male suckling lambs from the Churra (n = 6) and Assaf (n = 8) breeds were compared, whereas Alonso-García et al.Citation12 analyzed perirenal fat transcriptomes of Assaf male suckling lambs (n = 8). Therefore, RNA-Seq datasets used in the present study were obtained from these two Spanish sheep breeds, Churra and Spanish Assaf (). The transcriptomic information of these 14 samples, which will be referred to as DataSet 1 from this point onwards, was analyzed and discussed in relation to the percentage of perirenal fat in the carcass (PF), which was greater in Churra than in Assaf.Citation13,Citation17 On the other hand, the study reported by Alonso-García et al.Citation12 contrasted the perirenal fat transcriptome of eight male Assaf lambs selected from a larger population (n = 17) based on their divergent phenotypic values for the proportion of kidney knob and channel fat in the half carcass (KKCF) [High-KKCF (n = 4) and Low-KKCF (n = 4)]. This second dataset of eight transcriptome samples will be referred from this point onwards as DataSet 2.
Figure 1. Breeds analyzed in the in the study: (A) Spanish churra sheep; (B) Spanish assaf sheep.
For the two datasets considered, the RNA sources were perirenal fat samples collected at the slaughterhouse when lambs reached the commercial weight to slaughter (between 10 and 12 kg). After being kept in an RNA-stabilization solution (Ambion RNAlater; Life Technologies), the individual perirenal fat samples were subjected to an RNA extraction protocol using the miRNeasy Mini Kit (Qiagen) for both datasets. The sequencing of the samples is described in detail in the corresponding studies.Citation12,Citation13 In summary, the samples for DataSet 1 were sequenced on an Illumina HiSeq 2000 Sequencer (Fasteris SA) to a minimum depth of 30 million paired-end reads, producing stranded paired-end reads of 75 bp. On the other hand, DataSet 2 cDNA libraries were sequenced on a NovaSeq 6000 system (Illumina) to a minimum depth of 30 million paired-end reads, producing stranded paired-end reads of 150 bp.
The carcasses of all the animals included in the present study were subjected to phenotypic characterization following the methods of Colomer Rocher et al.Citation26 which have been described in detail in the corresponding studies.Citation12,Citation13 Among the traits related to fat deposition, the percentage of perirenal fat in the carcass (PF%) was measured in two studies, and this has been the phenotype considered in this group as an indicator of fat deposition level (Supplementary Table 1).
Bioinformatic analysis
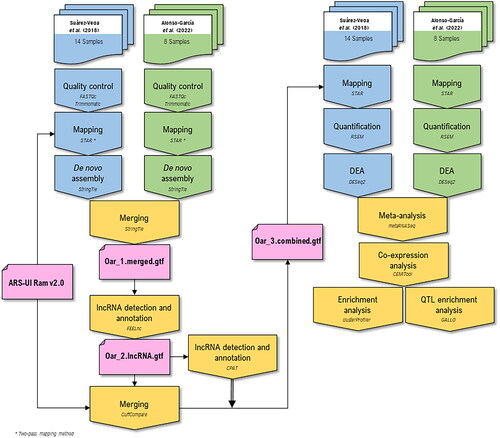
The step-by-step bioinformatics workflow applied in this study to 22 perirenal fat transcriptome samples for the detection of lncRNAs is depicted in . A detailed description of the main stages of this workflow is provided below.
Figure 2. Bioinformatic workflow applied in this work for lncRNA annotation and meta-analysis. The different colors represent the bioinformatic analyses steps applied to the different RNA-seq datasets considered: blue for DataSet 1 (14 RNA-seq samples)Citation13 green for DataSet 2 (8 RNA-seq samples;Citation12 and yellow for both RNA-seq datasets (22 samples). The annotation files are indicated in pink color.
Data alignment
The raw sequences obtained from the databases were aligned using the STAR software (v.2.7.6a)Citation27 against the latest version of the ovine reference genome available at the NCBI (ARS-UI_Ram_v2.0). We used the two-pass alignment method for more sensitive novel junction discovery.Citation28
For the first pass, the index was obtained by changing the –sjdbOverhang parameter depending on the length of the reads (75 or 150 bp, depending on the dataset). The same index was also used for the second-pass alignment. In the 1st pass, the novel junctions were identified and included in the genome indices. For this 1st-pass alignment, we used the STAR options –outFilterType BySJout to reduce the number of ‘spurious’ junctions and retain only those reads, including junctions that passed through the SJ.out.tab files, and –outSAMtype BAM Unsorted SortedByCoordinate to obtain both unsorted and sorted bam files as outputs. In the 2nd pass, all reads were mapped again by considering the original GTF file with the –sjdbGTFfile parameter plus the novel junctions detected in the 1st pass mapping using the option –sjdbFileChrStartEnd. This last option allows the use of the list of annotated junctions (SJ.out.tab files) obtained in the previous mapping step.
After the mapping step, we used the StringTie (v.2.1.4)Citation29 transcriptome assembler to reconstruct the transcriptome of each individual sample using the mapped BAM files from the 2nd pass mapping, and the assembly was guided (option –rf) using the ovine reference genome ARS-UI_Ram_v2.0. Then, individual transcriptome annotation files (gtf files) from each sample were merged using CuffmergeCitation30 to obtain a nonredundant reference annotation file (Oar_1.merged.gtf in ).
lncRNA detection, annotation and transcript quantification
Using the new reference annotation file (Oar_1.merged.gtf), we identified potential novel lncRNAs using FEELnc (v.0.2).Citation31 The detection of lncRNAs using the FEELnc software requires the use of three interdependent modules. The first module (FEELnc_filter) filters those transcripts found in the analyzed datasets that are longer than 200 nucleotides and overlap protein-coding genes (by using -b transcript_biotype = mRNA). Then, the FEELnc_codpot module was used to identify the potential lncRNAs among the reconstructed transcripts. This module applies random forest to compute the coding potential score (CPS) of the transcripts. For this approach, FEELnc_codpot was used to predict ORF coverage, the multi k-mer frequencies and RNA sequencing length. These predictor scores are incorporated into the Random Forest analysis that computes a CPS for each input training transcripts. Then, the software sets an optimal CPS cutoff based on a threshold that maximized the sensitivity (Sn) and specificity (Sp) using 10-fold cross-validation. In our study, using the shuffle option, we fixed the Sn and Sp thresholds to 0.99. The shuffle strategy is based on the idea that lncRNAs are produced from the ‘debris’ of protein-coding genes.Citation32,Citation33 To achieve this, FEELnc shuffled mRNA sequences from the reference annotation while preserving the given k-mer frequency (–kmer = 1,2,3,6,9,12) of the input sequences. The annotation file of the lncRNAs detected in this step (Oar_2.lncRNA.gtf in ) was merged with the reference annotation file using Cuffcompare, resulting in a third annotation file (Oar_3.merged.gtf in ). For the third module (FEELnc_classifier), the novel lncRNAs detected in the previous step were classified into different types (genic, intergenic) and subtypes (containing, nested, overlapping, divergent, convergent, same strand), depending on their closest annotated transcripts in the reference annotation file (ARS-UI_Ram_v2.0). This module aims to identify potential cis-interactions between lncRNAs and target genes.
The Coding Potential Assessment Tool (CPAT) (v.3.0.4)Citation34 was used to confirm that lncRNAs detected by FEELnc had no coding potential and indeed are non-coding transcripts. This software distinguishes between coding and non-coding transcripts from a large pool of candidates using a logistic regression model constructed with four sequence features: open reading frame (ORF) size, ORF coverage, Fickett TESTCODE statistic, and hexamer use bias. First, CPAT was trained with available known protein-coding transcripts (759,400 transcripts annotated as ‘protein_coding’) and non-coding sequences (7,880 transcripts annotated as ‘ncRNAs’) from ARS-UI_Ram_v2.0 ovine genome to build a logistic regression model used to obtain the coding potential cutoff. Then, using 10-fold cross-validation, nonparametric two-graph ROC curves calculated with the ROCR R package (v.1.0.11)Citation35 were used to determine an optimum cutoff value threshold that maximizes the discriminatory power using maximum Sn and Sp (0.975; Supplementary Fig. 1). After obtaining the reference coding potential cutoff, CPAT calculates the CPS for each novel lncRNA detected by FEELnc. Those lncRNAs that had a CPS calculated by CPAT higher than the cutoff were considered coding transcripts and filtered out from the next steps.
Finally, the annotation file containing the lncRNAs identified after the FEELnc_codpot step was merged with the reference annotation file from NCBI (ARS-UI_Ram_v2.0) using Cuffcompare to obtain a complete annotation file that contains the transcripts annotated in the ovine reference genome plus the potential lncRNAs detected in this study (Oar_3.merged.gtf in ). This final annotation file (Oar_3.merged.gtf) was subsequently used for mapping and quantification of the total transcripts. Thus, following the scheme represented in , the samples were remapped using STAR (this time using the default one-step mapping method), and the quantification of transcript expression was performed with RSEM (v.1.3.3)Citation36 by implementing the following options: –estimate-rspd, to know if there is any sequencing bias in the data enabling RSEM to learn from the data how the reads are distributed across a transcript; –calc-ci, for calculating 95% credibility intervals and posterior mean estimates; and –forward-prob, set to 0, for a strand-specific protocol where all upstream reads are derived from the reverse strand.
Meta-analysis of differentially expressed genes
Previously, for the meta-analysis, a phenotypic evaluation of the PF% values of the samples in the two datasets was performed by using logit transformation (logPF). For this transformed trait, we performed independent analyses of variance (ANOVA) using the aov function from the R stats package (v. 4.3.1)Citation37 to determine whether logPF was significantly different between the following comparisons: (1) Churra vs. Assaf samples from DataSet 1; (2) Assaf Low-KKCF vs. Assaf High-KKCF from Dataset 2; (3) Assaf samples from DataSet 1 vs. Low-KKCF samples from DataSet 2, which included the two groups of samples with lower fat deposition levels (LFD group, n = 12); (4) Churra breed samples from DataSet 1 and the High-KKCF samples from DataSet 2, which included the samples from each dataset with higher fat deposition levels (HFD group, n = 10); and (5) a final comparison contrasting the samples defining the LFD group (Assaf samples from DataSet 1 vs. Low-KKCF from DataSet 2) vs. the samples defining the HFD group (Churra samples from Dataset 1 vs. High-KKCF from Dataset 2).
We used the ssizeRNA R package (v.1.3.2)Citation38 to estimate the statistical power expected for each individual dataset based on its sample size. To that aim, we used the function ssizeRNA_vary. Considering a two-group contrast RNA-seq experiment, this function calculates appropriate sample sizes for a desired power where the mean and dispersion of gene expression vary among genes. This analysis used gene expression means and dispersions obtained from a suckling lambs perirenal fat transcriptome reference dataset (the four High-KKCF lambs from DataSet 2). The power calculations according to sample size was performed using the following parameters: a desired power threshold to be achieved (power) = 0.8; false discovery rate (fdr) = 0.05; proportion of non-differentially expressed genes (pi0) = 0.8; total number of genes (nGenes) = 18,733; mean counts in the control group (m) = estimated using the considered reference dataset, dispersion (disp) = estimated using the edgeR R package (v.4.0.16)Citation39 for the reference dataset; and three Fold Change scenarios (FCh = 2, 3 and 4).
Once the phenotypic traits were evaluated and the power of the individual analyses was calculated, we performed a differential expression analysis (DEA) using the RNA-Seq data for each of the considered datasets individually. The transcript quantification files obtained from RSEM were imported to the R environment using the tximport R package,Citation40 and the DEA for each dataset was performed using the R package DESeq2.Citation41 The model design used for the DEA was the same as that used in the corresponding manuscript for analyzing each dataset. Hence, for DataSet1, we compared samples clustered based on their breed, comparing the fat transcriptome between Churra and Assaf suckling lambs. To maintain the consistency and coherence of the results in the original study, the factor age was not included in the model due to a lack of uniformity in the age distribution between the two breeds included in DataSet 1.Citation13 On the other hand, for DataSet2, we compared the transcriptome between High- and Low-KKCF animals, taking into consideration the age of the animals as a categorical variable. Age was not included in the model for DataSet 1, as age and breed were confounding variables. More details on the models used for the DEA are provided in the original manuscript.Citation12,Citation13
Then, using the normalized counts, the raw p-values, the P adjusted value (Padj; using Benjamini and HochbergCitation42 multiple test correction) and the log2FoldChange (log2FCh) obtained from DESeq2 for each dataset, a meta-analysis was performed using the R package metaRNASeq.Citation43 For this meta-analysis, the results of the DEA were grouped according to the previous definitions of the LFD and HFD sample groups. The metaRNAseq package uses two different approaches for the detection of new differentially expressed (DE) genes: Fisher’s method and the inverse normal combination technique (INCT). The genes used for subsequent steps, named keepDE, were those genes identified as DE based on both methods (Padj < 0.05), and the log2FCh sign (+/−) were consistent between both datasets.
After the meta-analysis, Gene Ontology (GO) overrepresentation analyses were performed with the keepDE genes using the clusterProfiler R packageCitation44 and the org.Hs.eg.db R package as a database for GO terms.Citation45 The functional analyses were performed independently for the keepDE genes overexpressed in each of the sample groups, i.e., HFD and LFD, and for each of the GO categories (Biological Process (BP), Molecular Function (MF), and Cellular Component (CC)). GO terms were considered enriched for a q-value cutoff of 0.05 after applying the multiple test correction defined by Benjamini & Hochberg.Citation42
Detection of co-expressed gene modules
To determine potential trans-interactions between lncRNAs and mRNAs, the R package CEMiToolCitation46 was used to identify differentially co-expressed modules of genes. This package uses a weighted gene co-expression network analysis (WGCNA) approach to obtain the co-expressed modules and genes with the highest connectivity, known as hub genes, within each module. Previous to CEMiTool analysis, transcripts were filtered based on their expression using the filter_RNA_seq function from the GWENA R packageCitation47 to retain genes with at least 10 counts in one sample. After filtering, for the co-expression analysis, we used a total of 16,849 remaining genes. Prior to gene filtering by CEMiTool, we applied variance stabilizing transformation (VST; apply_vst = T). Spearman’s method was used to calculate the correlation coefficients, considering a soft thresholding power (β) of 3.
Once the gene co-expressed modules were identified, CEMiTool was used for gene set enrichment analysis (GSEA), from which a p value and a normalized enrichment score (NES) were obtained for each module. NES was calculated using the genes within a module as the gene set and the median z-score values of each phenotype as the rank. This parameter indicates the enrichment score for a module within each group and is normalized by the number of genes included in the module. For each NES, a Benjamini–Hochberg adjusted p-value was calculated, which indicates whether there were significant differences (p-value <0.05) between the expression of the co-expressed genes for each module between the groups analyzed. The co-expressed gene modules detected in this step were filtered to analyze in depth those modules with co-expressed keepDE-lncRNAs detected in the meta-analysis. This information was assessed to gain further insights into the possible relationships between these regulatory elements and the biological processes underlying perirenal fat deposition in suckling lambs.
Functional analysis and QTL annotation
The genes from co-expressed modules containing keepDE-lncRNAs were used for functional analyses. We performed enrichment analysis using the clusterProfiler R package by applying the same parameters described previously. From the enrichment analysis implemented with clusterProfiler and using the the cnetplot function, we obtained the relationships between the enriched terms and the co-expressed genes in these modules. The results of this analysis were combined with the FEELnc classifier information to identify cis-associations between co-expressed genes and new lncRNAs. In addition, the Pearson correlations between the expression of mRNAs and lncRNAs were calculated using the WGCNA R packageCitation48 to detect possible trans-associations. To elucidate the biological role of the DElncRNAs detected in the co-expressed gene modules, gene-term networks based on all the information described previously were created using Cytoscape.Citation49
The DElncRNAs were also subjected to QTL annotation analysis. For this purpose, we used the GALLO R packageCitation50 to exploit the information annotated in the AnimalQTLdb,Citation51 considering the Ovis aries Rambouillet v.2.0 reference genome. We performed QTL annotation using an interval of 5 × 10⁵ bp for all the DElncRNAs detected by the meta-analysis.
Results
Alignment statistics
Approximately 44 million paired-end reads were generated per sample (44 347 682.63 ± 5 738 600.09, mean ± SD) for the samples obtained from DataSet1.Citation13 On average, 36 million (36 052 414.5 ± 4 728 699.86) mapped uniquely to the ovine genome assembly (ARS-UI_Ram_v.2.0), corresponding to 81.3% of the total reads. For DataSet2,Citation12 31 million paired-end reads were generated per sample (31 661 520.25 ± 1 682 935.43), and an average of almost 30 million reads (29 714 380.5 ± 1 585 934.14) mapped uniquely to the same ovine genome assembly. Those uniquely mapped reads accounted for 93.8% of the total reads.
Transcriptomic identification and characterization of novel lncRNAs in the perirenal fat transcriptome of suckling lambs
FEELnc detected 3,953 novel lncRNAs not previously annotated in the ARS-UI_Ram_v.2.0 reference sheep genome, with a CPS lower than 0.45 (Supplementary Fig. 1). Approximately 11% of the novel lncRNAs detected were located in OAR1, OAR2 and OAR3. Similarly, this distribution was also found for mRNAs and lncRNAs already annotated in the reference genome (). Based on the analyses performed with CPAT, a total of 40 from the 3,953 novel lncRNAs detected had CPS higher than the coding potential cutoff (0.975) obtained after the 10-fold cross-validation. These 40 lncRNAs (1.01% of the total of novel lncRNAs) were eliminated from further analysis, continuing the following analyses with 3913 novel lncRNAs.
Figure 3. Long non-coding RNA (lncRNA) characterization. The colors used to represent the different transcript categories (green for protein-coding genes, orange for annotated lncRNAs in the sheep reference genome and purple for novel lncRNAs) are the same for A, B, C and D. (A) Bar graph showing the number of genes (Y-axis) per chromosome in the 26 sheep autosomes (X-axis). For better visualization of the bar graph, a square root transformation has been used on the Y-axis. (B) Density plot showing the length of the genes. The X-axis represents the transcript length in base pairs (bp) and the Y-axis the number of transcripts. (C) Density plot showing the number of exons (X-axis) per transcript in each of the categories of the transcripts considered (Y-axis). (D) Expression levels measured in the logarithm of fragments per kilobase million (Log10(FPKMs); Y-axis) of the three transcript categories. (E) Classification of novel lncRNAs into classes by genomic location according to the sheep reference genome.
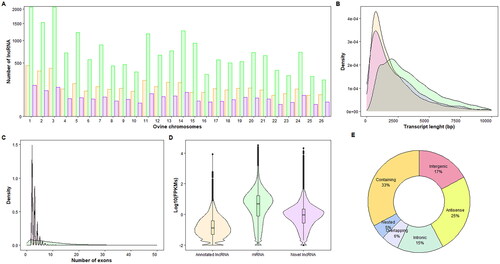
Compared to those lncRNAs annotated in the sheep reference genome (4,442), the average transcript lengths were similar (2,560.5 and 2,406.8 bp for novel and annotated lncRNAs, respectively), whereas mRNAs annotated in the reference genome were larger (3,841.67 bp on average) (). In terms of the number of exons, both the novel lncRNAs and those annotated in the reference genome had between two and 40 exons, with ∼46% having fewer than five exons (2.73 exons on average for novel lncRNAs and 2.94 exons for annotated lncRNAs on average), while protein-coding genes had 9.93 exons on average ().
Interestingly, the novel lncRNAs were slightly more highly expressed than the lncRNAs annotated in the reference genome. Considering expressed transcripts, the median expression for novel lncRNAs was 0.91 FPKMs, and the median expression for annotated lncRNAs was 0.13 FPKMs. However, both the novel and annotated lncRNAs still exhibited lower expression than did the protein-coding genes (median normalized counts = 2.04 FPKMs) (). Of the 3,953 novel lncRNAs detected in this study, 909 had an average expression for all samples higher than 10 normalized counts. FEELnc_classiffier classified the lncRNAs depending on their location with regard to the genes annotated in the reference genome. Of the 3,953 novel lncRNAs detected in this study, 95 were classified as intergenic lncRNAs. The majority of the lncRNAs were classified as ‘genic containing exonic’ (33% of the total lncRNAs classified by the FEELnc_classifier), as shown in . The second category most represented by the detected lncRNAs was ‘antisense’ (25%) (both intronic and exonic), followed by ‘intergenic’ (17%) ().
Meta-analysis of DE genes
In relation to the phenotypic assessment performed for the samples analyzed in the meta-analysis, the average PF% values for the Assaf and Churra animals from DataSet 1 were 1.08 and 1.47, respectively, whereas for the two groups of Assaf suckling lambs contrasted within DataSet 2, the mean PF% values were 1.06 and 2.09 for Low-KKCF and High-KKCF groups, respectively. A box plot distribution for these four groups of samples is shown in Supplementary Fig. 2A. The results of the ANOVA performed for the logPF values in the different considered contrasts are given in Supplementary Fig. 2B. Significant differences were found between the Assaf Low-KKCF and Assaf High-KKCF samples from DataSet 2 (p-value = 0.00277) but not between the Churra and Assaf samples from DataSet 1 (p-value = 0.0665). On the other hand, no significant differences were found when the two groups of samples with lower (Assaf DataSet 1 vs. Assaf Low-KKCF DataSet 2) or higher (Churra DataSet 1 vs. Assaf High-KKCF DataSet 2) fatness levels from the two datasets were compared (p-value = 0.906 and 0.052, respectively). Interestingly, the comparison of the samples grouped as LFD (Assaf from DataSet 1 + Assaf Low-KKCF from DataSet 2) vs. those grouped as HFD (Churra from DataSet 1 + Assaf High-KKCF from DataSet 2) showed a highly significant result (p-value = 0.00109) (Supplementary Fig. 2B). Thus, the phenotypic differences for the logPF trait were maximized when evaluating the two datasets together. Based on these results, we considered the meta-analysis approach proposed here to compare the transcriptome samples included in the LFD group with those included in the HFD group to improve the statistical power of our transcriptomic analysis and to gain a deeper understanding of the gene expression pathways and regulatory lncRNAs underlying fat deposition in suckling lambs.
The power analysis estimated that to achieve a power of 80% in the DEA, thereby detecting 80% of DEGs, when the FCh is set as 2 (log2FCh = 1), at least 9 replicates per group are necessary; for a FCh of 3 (log2FCh = 1.58), a minimum of 5 samples per group are required, and for FCh = 4 (log2FCh = 2), the minimum drops to 4 samples per group (Supplementary Fig. 3). Focusing on the two datasets analyzed herein, for DataSet 1, which has a minimum of 6 replicates per group, the power analysis estimates that approximately the 68, 94 and 99% of the DEGs are detected with log2FCh 1, 1.5 y 2, respectively. Meanwhile, for DataSet 2, which comprises 4 replicates per group, approximately 38, 81, and 94% of DEGs are detectable with log2FCh values of 1, 1.58, and 2, respectively.
After the DEA, we obtained 715 and 153 DE genes for DataSet1 and DataSet2, respectively. Then, exploiting the meta-analysis approach with the metaRNASeq R package, we obtained 632 DE genes using Fisher’s method and 463 using INCT (). For each of the methods used in the meta-analysis, we obtained the Integration-driven Discovery Rate (IDR), which measures the proportion of DE genes found in the meta-analysis that were not identified in any of the individual studies alone. The IDRs were 12.82 and 17.93 for Fisher’s method and INCT, respectively. In addition, we calculated the Integration-driven Revision Rate (IRR) parameter, which measures the proportion of DE genes that were identified in any of the individual studies but not in the meta-analysis. The IRR for Fisher’s method and INCT were 35.63 and 55.61, respectively ().
Figure 4. Summary of the meta-analysis results using fisher’s method and the inverse normal combination technique (INCT). (A) Table showing the number of differentially expressed (DE) genes for each method, the number of DE genes identified in the meta-analysis that were not identified as DE in individual studies (integration driven discoveries, IDD), number of DE genes identified in individual studies but not in meta-analysis (loss) and the Integration-driven discovery Rate (IDR) and the Integration-driven revision Rate (IRR) which are the corresponding proportions of IDD and loss. (B) Venn diagram with the DE genes identified for each of the individual studies, Suárez-Vega et al.Citation13 and Alonso-García et al.Citation12 and for meta-analyses (fisher’s method and INCT). Those DE genes detected in common by both meta-analysis methods are highlighted in red.
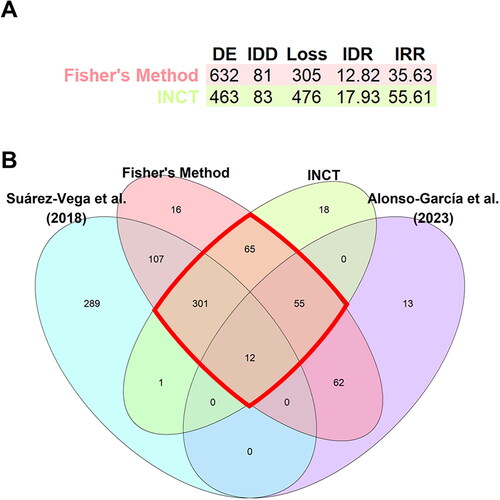
Finally, 250 genes were selected as keepDE genes (genes commonly identified as DE in the meta-analysis by the two analytical methods (padj <0.05) whose log2FCh sign (+/−) was consistent for both datasets; ). From the list of 250 keepDE genes, 214 were mRNAs, 20 were novel lncRNAs and 16 were lncRNAs previously annotated in the sheep reference genome. Among the keepDE genes, 148 had higher expression levels in the HFD group (keepHFD) than in the LFD group. Among these genes, 13 were lncRNAs (six novel lncRNAs and seven already annotated). Among the 102 keepDE genes with higher expression in the LFD (keepLFD) group than in the HFD group, 23 were lncRNAs (14 novel lncRNAs and nine already annotated). Almost all lncRNAs detected as keepDE (34) had a cis-associated protein-coding gene. These cis-associated genes, along with the protein-coding keepDE genes, were included in the functional enrichment analysis.
In the functional enrichment analyses, for the keepHFD genes, we obtained a total of 29 significantly enriched GO terms. By category, we obtained 16 significantly enriched terms in the GO: Biological Process category (GO:BP), where the most significant terms were related to angiogenesis processes (e.g., ‘epithelial cell development’, ‘cellular response to vascular endothelial growth factor stimulus’, ‘regulation of vascular permeability’, ‘vascular endothelial growth factor signalling pathway’, ‘positive regulation of angiogenesis’ and ‘positive regulation of vasculature development’), and 13 significantly enriched terms against the GO: Cellular Component category (GO:CC), where the most significant terms were ‘platelet alpha granule lumen’, ‘stress fiber’ and ‘contractile actin filament bundle’. No significant terms were identified in the GO: Molecular Function (GO:MF) category (Supplementary Table 2).
For the enrichment analysis of the keepLFD, we obtained only one significant term for the GO:MF category, ‘C-acyltransferase activity’ (Supplementary Table 2).
Detection of co-expressed gene modules and functional analysis
Six co-expressed gene modules were detected using CEMiTool. Briefly, the size of the modules ranged from 607 genes (Module 1) to 39 genes (Module 6). There were 21 keepDE genes for Module 1 and seven for Module 3, and the number of keepDE genes was less than five for the remaining modules. Although lncRNAs were found in all the modules identified, only modules 1, 2 and 4 retained keepDE lncRNAs. In addition, modules 1 and 2 had novel lncRNAs among the hub genes identified by CEMiTool. All the information obtained from the co-expression analysis is summarized in .
Figure 5. Summary of the results from CEMiTool co-expression network analysis. (A) Table showing the number of protein coding genes (N PGenes), lncRNAs (N lncRNAs), differential expressed Protein-coding genes (DEPgenes) and DElncRNAs detected and the hub genes for each module. (B) Gene set enrichment analysis (GSEA) for each module of co-expressed genes. Circles represent the normalized enrichment score (NES) obtained for each module in each group, High fat deposition (HFD) and low fat deposition (LFD). For Module 1 no significant NES differences between groups were found.
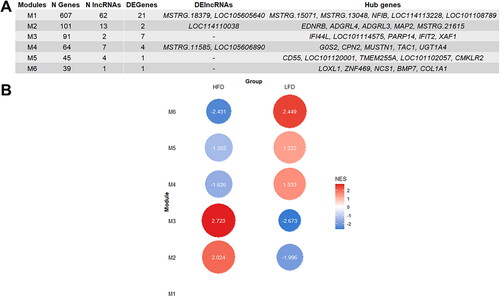
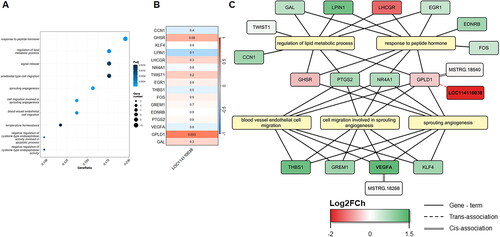
Based on the GSEA, significant differences between the HFD and LFD groups were obtained for all modules except for Module 1 (). As part of the study of the regulatory function of lncRNAs, co-expressed gene modules that included keepDE lncRNAs were further analyzed. Modules 2 and 4 were the only modules containing keepDE lncRNAs for which, based on the NES, significant differences in gene expression levels between the HFD and LFD groups were detected (). For Module 2, which had overall higher gene expression in the HFD group (NES = 2.024), we found 113 significantly enriched GO terms (q-value < 0.05), all of which belonged to the GO:BP category. The most significant terms were ‘cell migration involved in sprouting angiogenesis’ and ‘sprouting angiogenesis’ (see details in Supplementary Table 3). This module included one keepDE lncRNA, LOC114110038 (), which is trans-associated (p-value = 0.003, Pearson’s correlation = 0.6) with the GPLD1 gene. This gene is related to GO terms such as ‘response to peptide hormone’, ‘regulation of lipid metabolic process’ and ‘sprouting angiogenesis’ (). Remarkably, Module 2 included the novel lncRNA MSTRG.18268, which is cis-associated with the VEGFA gene. This gene was identified as a keepDE gene in our meta-analysis ().
Figure 6. Functional enrichment analysis for co-expressed genes in Module 2. (A) Dot-plot of the 10 most significantly enriched terms (q-value <0.05). (B) Heatmap of the pearson’s correlation between the DElncRNA in the X-axis and the co-expressed protein-coding genes in Module 2 in the Y-axis based on their expression level. (C) Gene network and the five most enriched terms. The keepDE genes detected in the meta-analysis are highlighted in bold.
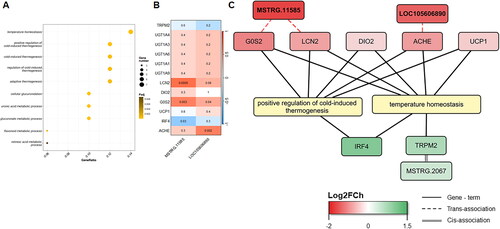
On the other hand, for Module 4, which showed overall greater expression in the LFD group (NES = 1.533) (), 19 terms were found to be significantly enriched. Of these significant GO terms, 10 belonged to the GO:BP category, and the most significant term in this category was ‘cellular glucuronidation’. The remaining significantly enriched terms belonged to the GO:MF category, and the most significantly enriched term was ‘glucuronosyltransferase activity’ (Supplementary Table 3). Module 4 included two keepDE lncRNAs (), MSTRG.11585 and LOC105606890, which were trans-associated with genes included within the GO terms ‘positive regulation of cold-induced thermogenesis’ and ‘temperature homeostasis’ ().
Figure 7. Functional enrichment analysis for co-expressed genes in Module 4. (A) Dot-plot of the 10 most significantly enriched terms (q-value <0.05). (B) Heatmap of the Pearson’s correlation between the DElncRNAs in the X-axis co-expressed and the co-expressed protein-coding genes in Module 4 in the Y-axis based on their expression level. (C) Gene network and the five most enriched terms. The keepDE genes detected in the meta-analysis are highlighted in bold.
Finally, the QTL annotation performed with the GALLO R package for the genomic intervals harboring the 37 keepDE lncRNAs identified corresponded with QTLs previously reported in sheep, especially the QTL class of Meat and Carcass (47.06%), followed by the Milk (26.47%), Health (17.65%), and Production (5.88%) QTL classes. Considering the interest in the correspondence between the 37 identified keepDE lncRNAs and sheep-reported QTLs from the Meat and Carcass categories, detailed information on these correspondences is given in Supplementary Table 4. As a remarkable coincidence from this table, the keepDE lncRNA LOC114110038 included Module 2, which is located in the region of sheep chromosome 21 where several QTLs associated with fatty acid composition (i.e., palmitic, arachidonic, linoleic acids, etc.) have been annotated (see details in Supplementary Table 4). In addition, the novel MSTRG.11585 lncRNA, belonging to Module 4, was located in a region of chromosome 11 associated with QTLs involved in ‘internal fat amount’ in sheep (see details in Supplementary Table 4).
Discussion
In recent years, RNA-Seq has emerged as a valuable tool for identifying key genes involved in adipose tissue development and metabolism. Regulatory elements such as lncRNAs have been implicated in fat deposition in sheep, particularly in relation to tail fat, in some specific breeds.Citation8,Citation10,Citation11,Citation52 However, their role in perirenal fat deposition has not been thoroughly studied. Perirenal fat, constituting approximately 11.4% of total fat, is significant in suckling lambs and serves as an indicator of carcass quality.Citation18 Therefore, the characterization of lncRNAs in perirenal fat carried out in the present study provides insight into the regulatory mechanisms influencing fat deposition in lambs and offers valuable information on the molecular factors influencing fatness-related quality traits.
In the present study, a total of 3,953 lncRNAs were identified using FEELnc software; from them, approximately 99% (3,913) were confirmed as non-coding transcripts by the CPAT software, highlighting the accuracy of the detection of lncRNAs with FEELnc. These results are similar to those previously reported for subcutaneous fat in sheep (4,464)Citation9. However, these findings differ from those in tail fat, where the novel lncRNAs detected were more heterogeneous (<500 in Bakhtiarizadeh and SalamiCitation8, 5,722 in He et al.Citation52 and 9,082 in Ma et al.Citation10). The distribution of protein-coding genes and both novel and annotated lncRNAs across ovine chromosomes showed a concentration on the first three chromosomes. There was a clear correlation (Pearson correlation = 0.72) between the number of annotated mRNAs and number of novel lncRNAs on each chromosome, suggesting a relationship in their distribution. This distribution pattern was consistent with studies in adipose tissue and other tissues in sheep.Citation52–54 The lncRNAs annotated in the perirenal fat also shared typical characteristics already known for lncRNAs, including transcript length, exon number, and expression levels. Regarding transcript length and number of exons, known and novel lncRNAs identified in the perirenal fat of suckling lambs had similar transcript lengths (), generally shorter than those of mRNAs, and an average of two exons. These results are consistent with findings in other sheep studies.Citation8,Citation24,Citation54–56 In terms of expression, novel lncRNAs showed higher transcript expression levels than previously annotated lncRNAs. In addition, protein-coding genes were consistently more highly expressed than lncRNAs, which agrees with previous results in sheep.Citation9,Citation10 Overall, the fact that our results are consistent with common features of lncRNAs observed in other sheep research provides support for the robustness of the lncRNAs identified in the perirenal fat transcriptome of suckling lambs.
Statistical analyses evaluating the power of the DEA underscore the critical importance of the number of replicates in achieving sufficient power to detect DEGs in individual datasets. The power analysis results presented here in reference to perirenal fat transcriptome samples, demonstrated that to achieve a detection power of 80% of the DEGs, for a log2FCh of one, a high number of replicates per group would be required (n = 9). However, for log2FCh values of 1.5 or above, with four replicates we would be able to detect more than 80% of the DEGs. When increasing the number of samples in a study is not possible, the use of a meta-analysis provides the opportunity to increase the power for the identification of key genes by combining independent studies focused on a common biological question.Citation57 This approach improves the reliability and robustness of the results because it integrates the signals of moderate significance from each individual study while controlling for false positives.Citation58,Citation59 In the meta-analysis performed herein, the IDRs increased by 12.82 and 17.93%, respectively, for both p-value combination approaches, indicating a clear improved detection power reached by our meta-analysis when compared to DEA (). In addition, the meta-analysis implemented in the present study appeared to discard false-positive DE genes detected in smaller sample pools, with IRRs of 35.63 and 55.61% for Fisher’s method and INCT, respectively.
Both the keepDE genes, which were more highly expressed in the HFD group, and the Module 2 genes were related to angiogenesis processes (Supplementary Tables 2 and 3). The process of forming new blood vessels, known as angiogenesis, is crucial to adipogenesisCitation60 and is a rate-limiting step in fat tissue expansion.Citation61 Angiogenesis-related GO terms were previously found to be enriched in lambs with a greater fat percentage in our previous work comparing High-KKCF and Low-KKCF Assaf suckling lambs.Citation12 Despite the fact that in a previous study comparing the perirenal fat transcriptome of Churra and Assaf suckling,Citation13 this term was not found to be enriched, several other significantly enriched terms related to vessel formation were found to be enriched in Churra lambs. For example, signaling mechanisms generated as a result of cell adhesion interactions related to ‘focal adhesion’ were enriched in the Churra transcriptome samples analyzed by Suárez-Vega et al.Citation13 Focal adhesion is a process that is crucially important as a primary driver of angiogenesis.Citation62 In addition, closely related to angiogenesis, the term ‘ERK1 and ERK2 cascade’ was also significantly enriched in the Churra samples analyzed by Suárez-Vega et al.Citation13
Moreover, the term ‘regulation of lipid metabolic process’ was significantly enriched in both the Churra lambs in the Suárez-Vega et al.Citation13 group and the HFD group in the present meta-analysis. The regulation of lipid metabolism involves genes related to angiogenesis, such as GPLD1, which is trans-associated with the LOC114110038 DElncRNA (). LOC114110038 lncRNA was a keepDE more highly expressed in the HFD group than in the LFD group, and its expression was positively correlated with the expression of the GPLD1 gene. Glycosylphosphatidylinositol phospholipase D1 (GPLD1) is an enzyme that cleaves glycosylphosphatidylinositol and has proven to influence glypican 4, a novel adipokine associated with obesity and insulin resistance in humans.Citation63 Previous studies have shown that serum GPLD1 levels are positively correlated with triglyceride serum levels.Citation64 In ruminants, the role of GPLD1 is still unclear. Delosière et al.Citation65 hypothesized that this protein, along with AHSG, could mediate increased glucose uptake in non-mammary tissues.
As shown in , LOC114110038 DElncRNA was more highly expressed in the LFD group; however, it interacted with co-expressed genes in Module 2, which had a greater NES in the HFD group. This finding could imply a potential role for LOC114110038 in the inhibition of angiogenesis. This function should be confirmed in further studies, as this lncRNA could be key in the regulation of angiogenesis in the development of adipose tissue in suckling lambs. In addition to its trans-association with GPLD1, LOC114110038 is associated with many QTLs in the sheep genome that are related to meat fatty acid content (i.e., docosapentaenoic acid, arachidonic acid, and gadoleic acid, among others). Hence, LOC114110038 seems to be a promising lncRNA related to fat deposition regulation processes and should be validated in further studies.
On the other hand, the more highly expressed keepDE genes in the LFD group than in the HFD group were associated with ‘C-acyltransferase activity’ and ‘monocarboxylic acid transmembrane transporter activity’. The term ‘C-acyltransferase activity’ was previously found to be associated with a lower amount of perirenal fat in the comparison between Assaf and Churra suckling lambs.Citation13 On the other hand, the monocarboxylate transporter 1 (MCT1) is a carrier of short-chain fatty acids, ketone bodies, and lactate in several tissues.Citation66 It has been demonstrated that partial inactivation of the MCT1 gene in mice leads to specific adaptations preventing the development of diet-induced obesity, hepatic steatosis and insulin resistance.Citation66 In addition, when performing the co-expression network analysis, we detected that Module 4 had a greater NES in the LFD group than in the HFD group. The enriched terms associated with Module 4 were closely related to body temperature regulation via thermogenesis. Previous studies on suckling lambs highlighted thermogenesis as an important process associated with fat tissues in suckling lambs.Citation12,Citation13,Citation67
For the co-expressed genes in Module 4, we detected two DElncRNAs, MSTRG.11585 and LOC105606890. These DElncRNAs were trans-associated with the G0S2, LCN2, and ACHE genes ().
The G0S2 gene was found to be significantly trans-associated with the MSTRG.11585 lncRNA (p-value = 0.003, Pearson correlation coefficient = 0.61). The expression of the G0/G1 switch 2 (G0S2) gene has a positive relationship with adipocyte differentiationCitation68 and lipolysis through the inhibition of adipose triglyceride lipase (ATGL).Citation69 El-Assaad et al.Citation70 demonstrated that G0S2 is a physiological regulator of adiposity and energy metabolism in a mouse model. G0S2-knockout mice presented enhanced ATGL activity, enhanced lipid metabolism and increased thermogenesis. This gene is also a Module 4 hub gene, as shown in , implying that it is a gene with high connectivity within the module and is likely to play an important role in adipose tissue in the LFD group. Closely related to thermogenesis and trans-associated with the MSTRG.11585 lncRNA, is the LCN2 gene (p-value = 0.0005, Pearson correlation coefficient = 0.68). In murine models, overexpression of lipocalin 2 (LCN2) in white adipose tissue led to significant upregulation of UCP1 and genes involved in mitochondrial oxidation, improving thermogenic adaptation.Citation71,Citation72 The functions of these two genes might be regulated by MSTRG.11585 due to the positive correlation of this DElncRNA with both genes, so MSTRG.11585 could activate the regulatory cascade of thermogenesis in perirenal adipose tissue. Notably, UCP1 is a thermogenic protein that is thought to be associated only with brown fat mitochondria but has also been shown to be present in beige fat.Citation73
The other DElncRNA of Module 4 was LOC105606890, which was trans-associated with the ACHE gene (p-value = 0.002, Pearson correlation coefficient = 0.62). The main function of AChE is the hydrolysis of acetylcholine (ACh). ACh is a parasympathetic neurotransmitter that has the ability to prevent adipose tissue inflammation by inhibiting the synthesis and release of proinflammatory and inflammatory immune cells.Citation74 In animal model studies, obesity has been linked to increased AChE activity.Citation75 The acetylcholine signaling pathway has an important effect on beige thermogenesis.Citation76 Taken together, these findings suggest that the upregulation of AChE function and G0S2/LCN2 by the LOC105606890 and MSTRG.11585 lncRNAs, respectively, in the LFD samples, together with the presence of UCP1 in Module 4, could imply a greater energy expenditure in LFD lambs, potentially marked by activated thermogenic adipocytes.
In conclusion, the present study implemented RNA-Seq technology to explore the role of lncRNAs in perirenal fat deposition in suckling lambs. The findings revealed a total of 3,953 novel lncRNAs in the perirenal fat of suckling lambs. The distribution of these genes across chromosomes, their typical characteristics, and their expression patterns agreed with common features observed in other sheep studies. The meta-analysis approach applied here, which combines data from two independent transcriptomic datasets, demonstrated increased detection power and filtered out false-positive DE genes, enhancing the reliability of the results. Key genes associated with angiogenesis-related processes were identified in HFD lambs by both meta-analysis and the co-expression network analysis. Notably, the lncRNA LOC114110038 has emerged as a potential regulator that inhibits angiogenesis. In contrast, genes more highly expressed in the LFD were linked to specific activities such as ‘C-acyltransferase activity’ and ‘monocarboxylic acid transmembrane transporter activity’. The co-expression network analysis for Module 4, which was more highly expressed in the LFD samples, revealed an association with body temperature regulation via thermogenesis and identified differentially expressed lncRNAs (MSTRG.11585 and LOC105606890) with trans-associations to key genes (G0S2, LCN2, ACHE) involved in thermogenic processes. These results may suggest a potential increase in energy expenditure in LFD lambs.
Overall, this study provides comprehensive insights into the regulatory mechanisms influencing perirenal fat deposition in suckling lambs that might be commonly shared within and between breeds, highlighting the significant role of lncRNAs in these processes.
SupplementaryFigure1.png
Download PNG Image (55.7 KB)
SupplementaryTable1.xlsx
Download MS Excel (135.4 KB)SupplementaryTable4.xlsx
Download MS Excel (14.1 KB)SupplementaryFigure2.png
Download PNG Image (43.4 KB)
SupplementaryTable2.xlsx
Download MS Excel (14.2 KB)SupplementaryTable3.xlsx
Download MS Excel (24.1 KB)Supplementary_Tables.docx
Download MS Word (52.5 KB)SupplementaryFigure3.png
Download PNG Image (181.3 KB)
Disclosure statement
No potential conflicto of interest was reported by the autor(s).
Additional information
Funding
References
- Do DN, Suravajhala P. Editorial: role of non-coding RNAs in animals. Animals. 2023;13(5):805.
- Jathar S, Kumar V, Srivastava J, Tripathi V. Technological developments in lncRNA biology. Adv Exp Med Biol. 2017;1008:283–323.
- Dykes IM, Emanueli C. Transcriptional and post-transcriptional gene regulation by long non-coding RNA. Genom Proteom Bioinformat. 2017;15(3):177–186.
- Karakas D, Ozpolat B. The role of LncRNAs in translation. Noncoding RNA. 2021;7(1):16.
- Wei J-W, Huang K, Yang C, Kang C-S. Non-coding RNAs as regulators in epigenetics. Oncol Rep. 2017;37(1):3–9.
- Lagarrigue S, Lorthiois M, Degalez F, Gilot D, Derrien T. LncRNAs in domesticated animals: from dog to livestock species. Mamm Genome. 2022;33(2):248–270.
- Waki H, Tontonoz P. Endocrine functions of adipose tissue. Annu Rev Pathol. 2007;2(1):31–56.
- Bakhtiarizadeh MR, Salami SA. Identification and expression analysis of long noncoding RNAs in fat-tail of sheep breeds. G3. 2019;9(4):1263–1276.
- Liu T, Feng H, Yousuf S, Xie L, Miao X. Differential regulation of mRNAs and lncRNAs related to lipid metabolism in Duolang and small tail Han sheep. Sci Rep. 2022;12(1):11157.
- Ma L, Zhang M, Jin Y, et al. Comparative transcriptome profiling of mRNA and lncRNA related to tail adipose tissues of sheep. Front Genet. 2018;9(SEP):365.
- Su X-H, He H-Y, Fang C, Liu L-L, Liu W-J. Transcriptome profiling of LncRNAs in sheep tail fat deposition. Anim Biotechnol. 2021;34(4):900–910.
- Alonso-García M, Suárez-Vega A, A. S. Fonseca P, et al. Transcriptome analysis of perirenal fat from Spanish Assaf suckling lamb carcasses showing different levels of kidney knob and channel fat. Front Vet Sci. 2023;10:1150996.
- Suárez-Vega A, Arranz JJ, Pérez V, de la Fuente LF, Mateo J, Gutiérrez-Gil B. Early adipose deposits in sheep: comparative analysis of the perirenal fat transcriptome of Assaf and Churra suckling lambs. Anim Genet. 2018;49(6):605–617.
- Flamant JC, Boccard R. Estimation de la qualité de la carcasse des agneaux de boucherie. Ann Zootech. 1966;15(1):89–113.
- Beriain MJ, Horcada A, Purroy A, Lizaso G, Chasco J, Mendizabal JA. Characteristics of Lacha and Rasa Aragonesa lambs slaughtered at three live weights. J Anim Sci. 2000;78(12):3070–3077.
- Caro I, Alaiz-Rodríguez R, González-Castro V, Quinto EJ, Mateo J. Conformation characteristics of suckling lambs carcasses from the Spanish local breeds Churra and Castellana and the non-native breed Assaf determined using digital photographs. Small Ruminant Research. 2018;160:89–94.
- Mateo J, Caro I, Carballo DE, Gutiérrez-Méndez N, Arranz JJ, Gutiérrez-Gil B. Carcass and meat quality characteristics of Churra and Assaf suckling lambs. Animal. 2018;12(5):1093–1101.
- Miguélez E, Zumalacárregui JM, Osorio MT, Beteta O, Mateo J. Carcass characteristics of suckling lambs protected by the PGI “lechazo de Castilla y León” European quality label: EFFECT of breed, sex and carcass weight. Meat Sci. 2006;73(1):82–89.
- Miguélez E, Zumalacárregui JM, Osorio MT, Figueira AC, Fonseca B, Mateo J. Quality traits of suckling-lamb meat covered by the protected geographical indication “Lechazo de Castilla y León” European quality label. Small Ruminant Research. 2008;77(1):65–70.
- Sañudo C, Campo MM, Sierra I, María GA, Olleta JL, Santolaria P. Breed effect on carcase and meat quality of suckling lambs. Meat Sci. 1997;46(4):357–365.
- Han F, Li J, Zhao R, et al. Identification and co-expression analysis of long noncoding RNAs and mRNAs involved in the deposition of intramuscular fat in Aohan fine-wool sheep. BMC Genomics. 2021;22(1):98.
- Kosinska-Selbi B, Mielczarek M, Szyda J. Review: long non-coding RNA in livestock. Animal. 2020;14(10):2003–2013.
- Bush SJ, Muriuki C, McCulloch MEB, Farquhar IL, Clark EL, Hume DA. Cross-species inference of long non-coding RNAs greatly expands the ruminant transcriptome. Genet Sel Evol. 2018;50(1):20.
- Bilbao-Arribas M, Jugo BM. Transcriptomic meta-analysis reveals unannotated long non-coding RNAs related to the immune response in sheep. Front Genet. 2022;13:1067350.
- Toro-Domínguez D, Villatoro-García JA, Martorell-Marugán J, Román-Montoya Y, Alarcón-Riquelme ME, Carmona-Sáez P. A survey of gene expression meta-analysis: methods and applications. Brief Bioinform. 2021;22(2):1694–1705.
- Colomer Rocher F, Morand-Fehr P, Kirton AH, Delfa Belenguer R, Sierra Alfranca I. 1988. Métodos normalizados Para el estudio de los caracteres cuantitativos y cualitativos de las canales caprinas y ovinas. INIA, Madrid (España).
- Dobin A, Davis CA, Schlesinger F, et al. STAR: Ultrafast universal RNA-seq aligner. Bioinformatics. 2013;29(1):15–21.
- Veeneman BA, Shukla S, Dhanasekaran SM, Chinnaiyan AM, Nesvizhskii AI. Two-pass alignment improves novel splice junction quantification. Bioinformatics. 2015;32(1):43–49.
- Pertea M, Pertea GM, Antonescu CM, Chang TC, Mendell JT, Salzberg SL. StringTie enables improved reconstruction of a transcriptome from RNA-seq reads. Nat Biotechnol. 2015;33(3):290–295.
- Trapnell C, Williams BA, Pertea G, et al. Transcript assembly and quantification by RNA-Seq reveals unannotated transcripts and isoform switching during cell differentiation. Nat Biotechnol. 2010;28(5):511–515.
- Wucher V, Legeai F, Hédan B, et al. FEELnc: a tool for long non-coding RNA annotation and its application to the dog transcriptome. Nucleic Acids Res. 2017;45(8):e57.
- Ponting CP, Oliver PL, Reik W. Evolution and functions of long noncoding RNAs. Cell. 2009;136(4):629–641.
- Ulitsky I. Evolution to the rescue: using comparative genomics to understand long non-coding RNAs. Nat Rev Genet. 2016;17(10):601–614.
- Wang L, Park HJ, Dasari S, Wang S, Kocher J-P, Li W. CPAT: coding-potential assessment tool using an alignment-free logistic regression model. Nucleic Acids Res. 2013;41(6):e74–e74–e74.
- Sing T, Sander O, Beerenwinkel N, Lengauer T. ROCR: visualizing classifier performance in R. Bioinformatics. 2005;21(20):3940–3941.
- Li B, Dewey CN. RSEM: Accurate transcript quantification from RNA-Seq data with or without a reference genome. BMC Bioinformatics. 2011;12(1):323.
- R Core Team. 2023. R: A Language and Environment for Statistical Computing. R Foundation for Statistical Computing, Viena (Austria).
- Bi R, Liu P. Sample size calculation while controlling false discovery rate for differential expression analysis with RNA-sequencing experiments. BMC Bioinformatics. 2016;17(1):146.
- Robinson MD, McCarthy DJ, Smyth GK. edgeR: a Bioconductor package for differential expression analysis of digital gene expression data. Bioinformatics. 2010;26(1):139–140.
- Soneson C, Love MI, Robinson MD. Differential analyses for RNA-seq: transcript-level estimates improve gene-level inferences. F1000Res. 2015;4:1521.
- Love MI, Huber W, Anders S. Moderated estimation of fold change and dispersion for RNA-seq data with DESeq2. Genome Biol. 2014;15(12):550.
- Benjamini Y, Hochberg Y. Controlling the false discovery rate: a practical and powerful approach to multiple testing. J Royal Statist Soc Series B. 1995;57(1):289–300. https://www.jstor.org/stable/2346101
- Rau A, Marot G, Jaffrézic F. Differential meta-analysis of RNA-seq data from multiple studies. BMC Bioinformatics. 2014;15(1):91.
- Wu T, Hu E, Xu S, et al. clusterProfiler 4.0: A universal enrichment tool for interpreting omics data. Innovation. 2021;2(3):100141.
- Carlson M. org.Hs.eg.db: genome wide annotation for human. R Package Version 3.8.2. 2019;
- Russo PST, Ferreira GR, Cardozo LE, et al. CEMiTool: a bioconductor package for performing comprehensive modular co-expression analyses. BMC Bioinformatics. 2018;19(1):56.
- Lemoine G. GWENA: Pipeline for augmented co-expression analysis. (R package version 1.10.0). 2023.
- Langfelder P, Horvath S. WGCNA: an R package for weighted correlation network analysis. BMC Bioinformatics. 2008;9(1):559.
- Shannon P, Markiel A, Ozier O, et al. Cytoscape: a software environment for integrated models of biomolecular interaction networks. Genome Res. 2003;13(11):2498–2504.
- Fonseca PAS, Suárez-Vega A, Marras G, Cánovas Á. GALLO: an R package for genomic annotation and integration of multiple data sources in livestock for positional candidate loci. Gigascience. 2020;9(12):giaa149.
- Hu ZL, Park CA, Reecy JM. Bringing the Animal QTLdb and CorrDB into the future: meeting new challenges and providing updated services. Nucleic Acids Res. 2022;50(D1):D956–D961.
- He X, Wu R, Yun Y, et al. Transcriptome analysis of messenger RNA and long noncoding RNA related to different developmental stages of tail adipose tissues of sunite sheep. Food Sci Nutr. 2021;9(10):5722–5734.
- Chitneedi PK, Weikard R, Arranz JJ, Martínez-Valladares M, Kuehn C, Gutiérrez-Gil B. Identification of regulatory functions of LncRNAs associated with T. circumcincta infection in adult sheep. Front Genet. 2021;12:685341.
- Yang H, Wang F, Li F, et al. Comprehensive analysis of long noncoding RNA and mRNA expression patterns in sheep testicular maturation. Biol Reprod. 2018;99(3):650–661.
- Bao G, Li S, Zhao F, et al. Comprehensive transcriptome analysis reveals the role of lncRNA in fatty acid metabolism in the longissimus thoracis muscle of Tibetan sheep at different ages. Front Nutr. 2022;9:847077.
- Yue Y, Guo T, Yuan C, et al. Integrated analysis of the roles of long noncoding RNA and coding RNA expression in sheep (Ovis aries) skin during initiation of secondary hair follicle. PLOS One. 2016;11(6):e0156890.
- Hosseini SF, Bakhtiarizadeh MR, Salehi A. Meta-analysis of RNA-Seq datasets highlights novel genes/pathways involved in fat deposition in fat-tail of sheep. Front Vet Sci. 2023;10:1159921.
- Keel BN, Lindholm-Perry AK. Recent developments and future directions in meta-analysis of differential gene expression in livestock RNA-Seq. Front Genet. 2022;13:983043.
- Yoon S, Baik B, Park T, Nam D. Powerful p-value combination methods to detect incomplete association. Sci Rep. 2021;11(1):6980.
- Cao Y. Adipose tissue angiogenesis as a therapeutic target for obesity and metabolic diseases. Nat Rev Drug Discov. 2010;9(2):107–115.
- Sun K, Kusminski CM, Scherer PE. Adipose tissue remodeling and obesity. J Clin Invest. 2011;121(6):2094–2101.
- Ramjaun AR, Hodivala-Dilke K. The role of cell adhesion pathways in angiogenesis. Int J Biochem Cell Biol. 2009;41(3):521–530.
- Zhang K, Zhu H, Wang L, Yang H, Pan H, Gong F. Serum glypican4 and glycosylphosphatidylinositol-specific phospholipase D levels are associated with adipose tissue insulin resistance in obese subjects with different glucose metabolism status. J Endocrinol Invest. 2021;44(4):781–790.
- Kurtz TA, Fineberg NS, Considine RV, Deeg MA. Insulin resistance is associated with increased serum levels of glycosylphosphatidylinositol-specific phospholipase D. Metabolism. 2004;53(2):138–139.
- Delosière M, Bernard L, Viala D, Fougère H, Bonnet M. Milk and plasma proteomes from cows facing diet-induced milk fat depression are related to immunity, lipid metabolism and inflammation. Animal. 2023;17(6):100822.
- Lengacher S, Nehiri-Sitayeb T, Steiner N, et al. Resistance to diet-induced obesity and associated metabolic perturbations in haploinsufficient monocarboxylate transporter 1 mice. PLOS One. 2013;8(12):e82505.
- Basse AL, Dixen K, Yadav R, et al. Global gene expression profiling of brown to white adipose tissue transformation in sheep reveals novel transcriptional components linked to adipose remodeling. BMC Genomics. 2015;16(1):1–19.
- Zandbergen F, Mandard S, Escher P, et al. The G0/G1 switch gene 2 is a novel PPAR target gene. Biochem J. 2005;392(Pt 2):313–324.
- Yang X, Lu X, Lombès M, et al. The G0/G1 switch gene 2 regulates adipose lipolysis through association with adipose triglyceride lipase. Cell Metab. 2010;11(3):194–205.
- El-Assaad W, El-Kouhen K, Mohammad AH, et al. Deletion of the gene encoding G0/G1 switch protein 2 (G0s2) alleviates high-fat-diet-induced weight gain and insulin resistance, and promotes browning of white adipose tissue in mice. Diabetologia. 2015;58(1):149–157.
- Deis JA, Guo H, Wu Y, Liu C, Bernlohr DA, Chen X. Adipose Lipocalin 2 overexpression protects against age-related decline in thermogenic function of adipose tissue and metabolic deterioration. Mol Metab. 2019;24:18–29.
- Meyers K, López M, Ho J, Wills S, Rayalam S, Taval S. Lipocalin-2 deficiency may predispose to the progression of spontaneous age-related adiposity in mice. Sci Rep. 2020;10(1):14589.
- Shabalina IG, Petrovic N, de Jong JMA, Kalinovich AV, Cannon B, Nedergaard J. UCP1 in Brite/Beige adipose tissue mitochondria is functionally thermogenic. Cell Rep. 2013;5(5):1196–1203.
- Pavlov VA, Tracey KJ. Neural circuitry and immunity. Immunol Res. 2015;63(1–3):38–57.
- Tvarijonaviciute A, Ceron JJ, Tecles F. Acetylcholinesterase and butyrylcholinesterase activities in obese Beagle dogs before and after weight loss. Vet Clin Pathol. 2013;42(2):207–211.
- Meng W, Xiao T, Liang X, et al. The miR-182-5p/FGF21/acetylcholine axis mediates the crosstalk between adipocytes and macrophages to promote beige fat thermogenesis. JCI Insight. 2021;6(17).