
Abstract
Apoptosis-inducing factor mitochondrion-associated 2 (AIFM2) has been identified as a gene with anti-ferroptosis properties. To explore whether AIFM2 exerts anti-ferroptosis role in yaks (Bos grunniens), we cloned yak AIFM2 gene and analyzed its biological characteristics. The coding region of AIFM2 had 1122 bp and encoded 373 amino acids, which was conserved in mammals. Next, RT-qPCR results showed an extensive expression of AIMF2 in yak tissues. Furthermore, we isolated yak skin fibroblasts (YSFs) and established a bisphenol A (BPA)-induced ferroptosis model to further investigate the role of AIFM2. BPA elevated oxidative stress (reactive oxygen species, ROS) and lipid peroxidation (malondialdehyde, MDA and BODIPY), and reduced cell viability and antioxidant capacity (glutathione, GSH), with the severity depending on the dosage. Of note, a supplement of Ferrostatin-1 (Fer), an inhibitor of ferroptosis, restored the previously mentioned indicators. Subsequently, we constructed an AIFM2 overexpression vector and designed AIFM2 specific interfering siRNAs, which were transfected into YSFs. The results showed that overexpressing AIFM2 alleviated ferroptosis, characterizing by significant changes of cell viability, ROS, BODIPY, MDA and GSH. Meanwhile, interfering AIFM2 aggravated ferroptosis, demonstrating the critical anti-ferroptosis role of the yak AIFM2 gene. This study shed light on further exploring the molecular mechanism of AIFM2 in plateau adaptability.
Introduction
The yak (Bos grunniens) predominantly inhabits the Himalayas and its surrounding areas, displaying the remarkable adaptability to thrive and reproduce in challenging highland environments. As a distinctive livestock species in those areas, yaks are integral to local herbivorous animal husbandry practices.Citation1 Compared to other animals, yaks are more susceptible to harsh environmental conditions including extreme cold, hypoxia, intense ultraviolet radiation, and inadequate nutrition, which can cause abnormal cell death and lead to the occurrence of various diseases.Citation2
Cell death can be mainly classified into non-programmed death and programmed cell death (PCD), with the latter encompassing apoptosis, necrosis, autophagy, ferroptosis, etc.Citation3 Among these, ferroptosis is a newly discovered form of iron-dependent PCD, with excessive accumulation of iron ions and lipid peroxidation as the principal hallmarks.Citation4 Ferroptosis has shown involvement in the development of various diseases like Alzheimer’s disease (AD),Citation5 stroke,Citation6 and ischemia-reperfusion injury,Citation7 making it a popular research topic in the field of PCD. Exploring the mechanisms involved in the resistance of ferroptosis in yak cells is beneficial for improving their survivals and resolving the potential molecular mechanisms of ferroptosis.
Multiple pathways have been found to resist ferroptosis. Specifically, glutathione peroxidase 4 (GPX4), the key enzyme that can specifically alleviate lipid peroxidation, is regarded as a marker of anti-ferroptosis.Citation8,Citation9 GTP cyclohydrolase-1(GCH1) is another key regulatory factor regulating ferroptosis resistance via controlling the production of tetrahydrobiopterin (BH4).Citation10 It has been discovered that dihydroorotate dehydrogenase (DHODH) plays a pivotal role in conferring anti-ferroptosis properties specifically within the mitochondrial inner membrane, working in concert with the GPX4 system to effectively combat ferroptosis.Citation11 Previous research indicated that DHODH exerts anti-ferroptosis role in bisphenol S-induced ferroptosis model in yak skin fibroblasts.Citation12
Of note, growing evidences reveal that Apoptosis-inducing factor mitochondrion-associated 2 (AIFM2), a member of the apoptosis-inducing factor (AIF) family, plays an important role in anti-ferroptosis.Citation13,Citation14 AIFM2, also known as ferroptosis inhibitor protein 1 (FSP1), works as a key regulatory in various cells, such as human breast cellsCitation15 and pleural mesothelioma cells.Citation16 In addition, AIFM2 protects cells from harmful lipid peroxidation and ferroptosis through the ESCRT-III pathway,Citation17 and non-canonical vitamin K cycle.Citation18 In brief, researches conducted thus far has demonstrated the anti-ferroptosis effects of AIFM2 in both animal models and human cells. However, the gene sequence of yak AIFM2 has not been acquired to date. The functional mechanism of AIFM2 in combating ferroptosis in yak cells remains uncertain.
Bisphenol A (BPA) is considered an environmental estrogen, functioning as an endocrine disruptor that poses significant health risks to both humans and farm animals.Citation19 BPA targets the endocrine system of mammals to exsert its deleterious effects, which leads to adverse effects such as metabolic dysregulation, cardiovascular abnormalities, reproductive upsets, and neurological disorders.Citation20,Citation21 Mechanistically, BPA primarily disrupts cellular metabolism by inducing an elevated production of reactive oxygen species (ROS) and promoting membrane lipid peroxidation, ultimately resulting in cellular apoptosis.Citation22 Researches have shown that BPA can cause ferroptosis in renal tubular epithelial cells,Citation23 interstitial cells,Citation24 and human myocardial cellsCitation25 to affect the normal function of cells. The findings suggest that BPA can potentially induce detrimental effects by eliciting cell ferroptosis, indicating its possible involvement in the modulation of ferroptosis in yak skin fibroblasts (YSFs).
In the present study, we aimed to obtain and analyze the coding region sequence of the yak AIFM2 gene through cloning and subsequent bioinformatics analysis. Simultaneously, we employed enzymatic and tissue block methods to isolate yak fetal skin fibroblasts (YSFs) and established a ferroptosis model induced by BPA to investigate the involvement of the AIFM2 gene in yak cells. To attain this objective, we designed an AIFM2 gene overexpression vector and small interfering RNA (siRNA), which were transfected into YSFs respectively. After co-treatment with BPA, we assessed the indicators of ferroptosis, such as cell viability, oxidative stress, and lipid peroxidation. The obtained results furnished a theoretical and experimental foundation for further delving into the role of AIFM2 in anti-ferroptosis and provided valuable insights for enhancing the survival prospects of plateau yaks.
Materials and methods
The animal experiments were checked and approved by the Ethics Committee of Southwest Minzu University (smu-202309002) and performed in accordance with the Animal Care and Use Program Guidelines of the Sichuan Province, China.
Animals
The heart, liver, spleen, lung, and kidney samples from four yaks were obtained from a slaughterhouse located in Hongyuan County, Sichuan Province, China. The samples were finely minced using sterile scissors, rinsed thoroughly with physiological saline, and then transferred to freezing tubes. The collected samples were brought back to the laboratory in a liquid nitrogen container and stored in a refrigerator at −80 °C until use. Fetal samples were obtained from yaks at approximately three months of pregnancy. Briefly, intact uterus containing live fetus were isolated from slaughtered female yaks, and soaked in pre-cooled physiological saline, and transported back to the laboratory within 6 h. Tissues and cells from yak fetuses were isolated in the cell chamber under a sterile environment.
Cloning the coding region of the yak AIFM2 gene
Referring to the predicted mRNA sequence of wild yak AIFM2 (GenBank No.: XM_014480967.1) in GenBank, we designed polymerase chain reaction (PCR) primers for AIFM2 using Primer Premier 5.0 software (Premier, Canada). All primers were synthesized by Beijing Tsingke Biotech Co., Ltd. (Beijing, China). The specific primers were shown in Table S1. We used yak liver cDNA as a template, 20 μL PCR amplification reaction was performed containing 1 μL of cDNA template, 1 μL of forward and reverse primers each, 10 μL of 2 × Phanta Mastar Mix (Vazyme, P525-AA, China) and 7 μL of ddH2O. The PCR program was conducted as follows: pre-denaturation at 95 °C for 5 min, denaturation at 98 °C for 30 s, annealing at 60 °C for 20 s and extension at 72 °C for 30 s, 35 cycles from denaturation to extension, and final extension step at 72 °C for 5 min. The PCR products were separated by 2% agarose gel and purified by Fast Pure Gel DNA Extraction Mini Kit (Vazyme, DC301-01). The purified products were sent to a company (Qingke Inc.) for Sanger sequencing to obtain the sequence of the coding region of the yak AIFM2 gene.
Bioinformatics analysis of yak AIFM2 gene
We analyzed the biological characteristics of the coding region of yak AIFM2 gene. The open reading framework was performed using NCBI ORF Finder (https://www.ncbi.nlm.nih.gov/orffinder/). Homology comparison of the nucleotide and amino acid sequences were performed using DNAMAN. ExPASy (https://web.expasy.org/protparam/)was used to complete protein physicochemical property analysis. The hydrophobicity, transmembrane structure, phosphorylation site and N-glycosylation site were predicted by ProtScale (https://web.expasy.org/protscale/), TMHMM2.0 (https://services.healthtech.dtu.dk/service.php?TMHMM2.0), NetPhos3.1 (https://www.cbs.dtu.dk/services/NetPhos/) and NetNGlyc1.0 (http://www.cbs.dtu.dk/services/NetNGlyc/), respectively. We utilized a predictive approach to determine the secondary and tertiary structures of the AIFM2 proteins by using SOPMA (https://npsa-prabi.ibcp.fr/cgi-bin/npsa_automat.pl?page=npsa_sopma.html) and SWISS-MODEL(https://swissmodel.expasy.org/interactive).
Total RNA extraction and real time quantitative PCR (RT-qPCR)
Total RNA was extracted from each tissue using Total RNA Isolation reagent (Biosharp, BS258A, China), and the quality of RNA was evaluated using a UV-visible spectrophotometer (Shimadzu, BioSpec-nano, Japan). Subsequently, the HiScript II Q RT SuperMix for qPCR (+gDNA wiper) reverse transcription kit (Vazyme, R223-01) was used to reverse-transcribe RNA into complementary DNA (cDNA). The cDNA obtained from the yak heart, liver, spleen, lung, and kidney were used as the template for RT-qPCR to determine the mRNA expression level of AIFM2 in each tissue. The mRNA expression level of BAX, BCL-2 and GPX4 in YSFs transfected with AIFM2 gene overexpression vector and small interfering RNA (siRNA) respectively were also determined by RT-qPCR. The reaction system consisted of a 10 μL mixture, including 1 μL of cDNA template, 5 μL of 2 × ChamQ SYBR qPCR Master Mix (Vazyme, Q311-02), 0.5 μL of forward and reverse primers each, and 3 μL ddH2O. The reaction program was conducted as follows: pre-denaturation at 94 °C for 30 s, followed by 40 cycles of denaturation at 94 °C for 10 s, and annealing at 60 °C for 15 s. A melting curve analysis was conducted by gradually increasing the temperature from 65 °C to 95 °C, with a temperature increment of 0.5 °C every 5 s. GAPDH was used as the reference gene and the RT-qPCR results were analyzed by using the 2−Δct or 2−ΔΔct method. All primers for RT-qPCR were provided in Table S1.
Isolation and culture of yak skin fibroblasts (YSFs)
The yak fetuses were subjected to disinfection using 75% ethanol for 10 min, followed by the dissection of skin tissues into smaller pieces in a sterile environment. The samples were washed repeatedly by PBS with 2% penicillin/streptomycin (P/S) (Gibco, C20012500BT, China) to remove external contaminants. The tissues were then minced in cell culture medium [DMEM/F12 (Gibco, C11330500BT) containing 10% FBS (Newzerum, FBS-NZ500, New Zealand) and 2% P/S)] to minimize cell damage. To identify an efficient method for cell separation, we conducted a comparative study between the tissue block method and the enzymatic method to establish the primary cell line of YSFs. By using the tissue block method, about 20 tissue fragments were evenly distributed on the bottom of a T25 cell culture flask and subsequently inverted and incubated for 3 h in a culture incubator at 37 °C with 5% CO2. Afterwards, the flasks were reverted to a horizontal position and the cell culture medium was added to facilitate further cultivation. The flasks were then placed in a humidified incubator for incubation. For the enzymatic method, the tissues were finely minced until they formed a paste-like consistency. Subsequently, 0.25% trypsin (Hyclone, SH30042.02, US) was introduced for digestion, allowing it to act for 15 min or until no visible fragments were present. Following that, the mixture was transferred to a humidified environment and collagenase I (Solarbio, C8140, China) was added, resulting in a final concentration of 0.5 mg/mL. The digestion process lasted approximately 1 h. After that, the solution was centrifuged at 3000 rpm for 5 min. Following the removal of the supernatant, cells were resuspended and plated into petri dishes for cultivation in the humidifier. When the primary cells reached 90% confluence, they were trypsinized and passaged at the ratio of 1:3.
Immunofluorescence staining
The fibroblasts were cultured on glass coverslips. When the cell density reached 90%, the cells were washed with PBS and fixed with 4% PFA for 20 min. After three additional washes with PBS, the cells were permeabilized with 0.1% Triton X-100 for 20 min. Next, the cells were washed twice with PBS and were separately incubated with VIMENTIN antibody (mouse IgG, 1:200 dilution, Santa, sc-6260, US) and H3K27me3 antibody (mouse IgG, 1:200 dilution, Affinity, DF6941, China) overnight at 4 °C. The following day, after three PBS washes, the cells were incubated with Goat Anti-Mouse IgG (H + L) (1:500 dilution, Affinity, S0017) at room temperature in the dark for 1 h. After washing with PBS twice, cells were stained with Hoechst (Solarbio, C0031) for 10 min and subsequently imaged using a fluorescence microscope (Zeiss, LSM800, Germany).
Establishment of BPA-induced ferroptosis model in YSFs
The YSFs were cultured in a humidified environment with 5% CO2 at 37 °C using the cell culture medium. Once the cell confluence reached 70%, the fibroblasts were treated with varying concentrations of bisphenol A (BPA) (Ctrl, 100, 150, 200, and 250 μM) (Aladdin, B108652, China). The morphology of cells under different concentrations of BPA were observed using a microscope at 12, 24, and 48 h. Cell viability was determined using the Cell Counting Kit-8 (Biosharp, BS350B) at 12, 24, and 48 h after drug treatment. Based on the above results, the optimal BPA treatment time, 24 h, was selected for subsequent experiments. After 24 h treatment, intracellular GSH and MDA levels were measured by the Glutathione Assay Kit (Biosharp, BL874B) and the MDA Assay Kit (Biosharp, BL904A). Cellular oxidation levels were assessed by fluorescent staining using the DCFH-DA Reactive Oxygen Species ROS Probe (UElandy, R6033, China) and BODIPY 581/591 C11 (Cayman Chemical, 27086, Germany). The optimal BPA concentration was determined based on the above comprehensive results. To verify the BPA-induced ferroptosis model in YSFs, fibroblasts were then co-treated with BPA and different concentrations of Ferrostatin-1 (1, 10 and 100 μM) (Aladdin, F408509), a potent ferroptosis inhibitor.
Construction of pcDNA3.1 (+) – AIFM2 overexpression vector and design of AIFM2-specific small interfering RNA (siRNA)
To generate the AIFM2 overexpression vector, we employed the ClonExpress® II One Step Cloning Kit (Vazyme, C112) as instructed by the manufacturer. Specifically, we utilized the online tool (http://www.vazyme.com) to design AIFM2-specific homologous recombination primers which were subsequently synthesized by Qingke Inc. The primer sequences were showed in Table S1. Then, PCR amplification was performed using homologous recombination primers, and the products were purified using a gel recovery kit (Vazyme, DC301-01) to obtain the AIFM2-insertion fragment. Meanwhile, the pcDNA3.1 (+) vector was linearized with EcoRI (NEBiolabs, R0101V, US) and Xhol (NEBiolabs, R0146V). The digestion system consisted of 50 μL, including 1 μg of pcDNA3.1(+), 1 μL of EcoRI, 1 μL of Xhol, 5 μL of 10 × rCutSmart, and ddH2O. The reaction mixture was incubated at 37 °C for 10 min, followed by heat inactivation at 65 °C for 20 min. Then, the linearized vector was purified following the instruction of the gel recovery kit (Vazyme, DC301-01). The recombination reaction system was prepared on ice, including 109 ng linearized vector, 45 ng insert fragment, 4 μL 5 × CE II Buffer, 2 μL Exnase II, and ddH2O was added to make up the volume to 20 μL. The reaction was carried out at 37 °C for 30 min and the product was stored at 4 °C. Then, the recombination products were transformed into chemically competent cells DH5α (Vazyme, C502-02). The cells were incubated in a shaking culture at ambient conditions for 12 h, followed by plating them onto Luria-Bertani (LB) solid medium supplemented with ampicillin (100 μg/mL). After 20 h of cultivation in a bacteriological incubator at 37 °C, the bacterial colonies were further propagated in an LB medium, and the presence of positive bacteria was confirmed through PCR and Sanger sequencing conducted by Qingke Inc. Following the acquisition of the positive colonies containing the pcDNA3.1 (+) – AIFM2 overexpression vector, the cells were cultured in an LB medium to enable amplification. Subsequently, the target vectors were extracted and purified utilizing the Plasmid MiniPrep Kit (Vazyme, DC203-01). The extracted plasmids were verified by agarose gel electrophoresis and used for subsequent experiments. Specific siRNA targeting AIFM2 were designed based on the AIFM2 gene sequence and synthesized by a company (GenePharma, Shanghai, China). The siRNA sequences were provided in Table S2.
siRNA and plasmid transfection
According to the instructions provided by the manufacturer of OriFect Transfection Reagent (Oriscience, CC101, China), the preparation of the OriFect-nucleic acid complex was conducted as follows: 1 μL of OriFect enhancer, 1 μg of plasmid DNA (or siRNA), 1 μL of OriFect transfection reagent, and supplemented with serum-free medium (Gibco, C11995500BT) up to a total volume of 100 μL. The AIFM2-specific siRNA and overexpression vector plasmid were transfected into YSFs separately. The cell status was observed and the culture medium was replaced to remove the transfection complex within the following 6 h. After 24 h of incubation, the samples were collected and the mRNA expression level of the AIFM2 gene was verified using RT-qPCR. The highest efficiency of siRNA was selected for subsequent experiments.
Western blot analysis
The overexpression vector and the AIFM2-specific siRNA with the best interference efficiency were transfected into YSFs. Cells were collected in 1.5 mL centrifuge tubes, washed three times with PBS and fully lysed by RIPA lysate (Solarbio, P6730) containing protease inhibitors (Solarbio, R0020). Then the protein concentration was determined by the BCA Protein Assay Kit (Enhanced) (Beyotime, P0010, China). Proteins were denatured and used for sampling. Sample proteins (20 μg) were separated by electrophoresis in 12% SDS-PAGE gel (Beyotime, P0285) and then electrotransferred to PVDF membranes (Millipore, ISEQ00010, USA). The membranes were incubated at 4 °C overnight with primary antibodies after blocking with 5% skimmed milk powder for 1 h at room temperature, including AIFM2 (rabbit IgG, 1:1000 dilution, Proteintech, 20886-1-AP, China) and β-ACTIN (rabbit IgG, 1:1000 dilution, Cell Signaling Technology, 4967S, USA) separately. Thereafter, the membranes were washed thrice with TBST (Biosharp, BL315B) and incubated in HRP-labeled goat anti-rabbit IgG (1:2000 dilution, Beyotime, A0208) in the dark for 1 h. After washing the membranes three times with TBST, the targeted bands were subjected to chemiluminescence detection on a machine (iBrightCL1000, Thermo) using the BeyoECL Star Kit (Beyotime, P0018AC). Image J software (Image J, NIH, USA) was used to quantify protein intensity.
Cell Counting Kit-8 assay
The cell viability of YSFs was measured using the Cell Counting Kit-8 (Biosharp, BS350B). The OD value at 450 nm was measured using a spectrophotometer (Thermo, 153000183, USA). Cell viability was calculated under different treatments according to the instructions: cell viability = [OD (treatment) – OD (blank)]/[OD (control) – OD (blank)] × 100%.
Detection of GSH and MDA content
The GSH and MDA levels in YSFs were measured using the Glutathione Assay Kit (Biosharp, BL874B) and the MDA Assay Kit (Biosharp, BL904A), respectively. The OD values at 412 nm and 532 nm were measured using a spectrophotometer (Thermo). The protein concentration of the samples was determined using the BCA Protein Assay Kit (Enhanced) (Beyotime, P0010), and the OD value at 562 nm was measured using a spectrophotometer. The molar concentrations of GSH and MDA were calculated based on standard curves, and the final GSH and MDA contents were expressed as protein content per unit weight (the final content is expressed as μmol/mg prot).
Reactive Oxygen Species (ROS) and lipid peroxidation fluorescence staining
To assess the oxidative levels of YSFs, we performed fluorescent staining using the DCFH-DA Reactive Oxygen Species (ROS) probe (Solarbio, D6470) and BODIPY 581/591 C11 (Cayman Chemical, 27086, Germany). These probes were specifically designed to detect cellular oxidative activity. Additionally, we stained the nucleus using the Hoechst reagent (Solarbio, C0031) with the concentration of 10 μM for 10 min. The concentrations used for the DCFH-DA Reactive Oxygen Species (ROS) probe and BODIPY 581/591 C11 were 10 μM and 2 μM, respectively. The cells were then incubated in a humidified environment at 37 °C for 30 min and 50 min, respectively. The fluorescence images were acquired using a Zeiss fluorescence microscope, and the fluorescence intensity was quantified using Image J software (NIH).
Statistical analysis
Statistical comparisons were conducted using Student’s unpaired t-test or one-way ANOVA analysis of variance (Tukey’s multiple comparison test as post hoc test). The results were represented as mean ± standard deviation (SD). Statistical significance was determined at a threshold value of p < 0.05. Each experimental group consisted of a minimum of three replicates.
Results
Cloning the coding region of yak AIFM2 gene
In the present study, 2% agarose gel electrophoresis was used to obtain the PCR amplification products of the yak AIFM2 gene (Fig. S1A). Sanger sequencing analysis demonstrated that the coding region of the yak AIFM2 gene comprised 1122 base pairs (bp), which translated to a total of 373 amino acids (Fig. S1B). The nucleotide sequences of the yak AIFM2 gene were analyzed and compared with those of other mammalian species. Our results revealed that the coding region of the yak AIFM2 gene exhibited the highest degree of nucleotide homology (97.75%) with cattle (Bos taurus). Moreover, it showed over 94% sequence similarity with scimitar (Oryx dammah), Buffalo (Bubalus bubalis), goat (Capra hircus), sheep (Ovis aries) and wapiti (Cervus canadensis), indicating a high level of conservation of the AIFM2 gene among mammals (Table S3).
Physiochemical properties and functional analysis of yak predicted AIFM2 protein
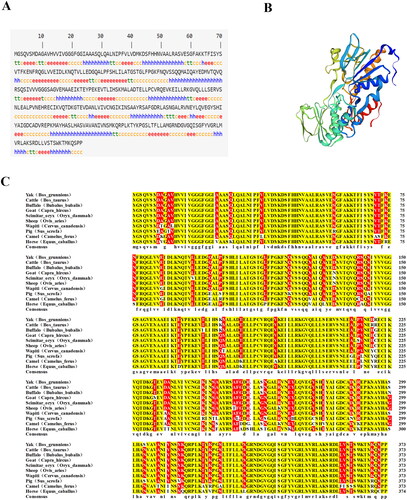
We obtained the sequence of the coding region of the yak AIFM2 gene and analyzed its biological characteristics. According to ExPASy prediction, the molecular weight of yak AIFM2 protein was 131615.81. The aliphatic coefficient, isoelectric point and instability coefficient were 41.37, 6.95 and 45.70, respectively. The yak AIFM2 protein consisted of a mixture of 20 different amino acids, which included glycine (Gly), cysteine (Cys), alanine (Ala), and threonine (Thr). These amino acids accounted for approximately 25.2%, 20.9%, 19.3%, and 15.3% of the protein, respectively. Additionally, the yak AIFM2 protein contained 37 positively charged amino acids and 35 negatively charged amino acids, resulting in an overall positive charge. The average hydrophilicity index of the protein was 0.639, indicating a moderately hydrophobic nature of the yak AIFM2 protein (Fig. S2A). Furthermore, our prediction suggested the presence of a transmembrane domain in the yak AIFM2 protein (Fig. S2B). The protein also harbored multiple phosphorylation sites, with threonine (Thr), serine (Ser), and tyrosine (Tyr) being the primary sites of phosphorylation (Fig. S2C). However, there was no indication of N-glycosylation sites in the protein (Fig. S2D). The secondary structure prediction revealed that the structure of the yak AIFM2 protein was primarily composed of random coil (36.46%) and alpha helix (31.99%). The remaining portion included beta turn (7.77%) and extended strand (23.86%) (). The predicted results for the tertiary structure of yak AIFM2 proteins were basically consistent with those for the secondary structure (). Furthermore, the amino acid sequences of yak AIFM2 proteins were compared to those of other mammalian species (). Based on the results, it was observed that the yak AIFM2 protein displayed a high level of amino acid homology with cattle (Bos taurus), scimitar (Oryx dammah), Buffalo (Bubalus bubalis), goat (Capra hircus), sheep (Ovis aries), wapiti (Cervus canadensis), pig (Sus scrofa), camel (Camelus ferus) and horse (Equus caballus). This finding further reinforced the notion that the yak AIFM2 protein exhibited significant conservation across mammalian species.
Figure 1. Structure prediction of the yak AIFM2 protein and its amino acid sequence alignment. (A) Secondary structure prediction of the yak AIFM2 protein. Alpha-helix, beta-turn, extended strand, and random coil are marked in blue, green, red, and yellow, respectively. (B) Tertiary structure prediction of the yak AIFM2 protein. (C) Amino acid sequence alignment of the yak AIFM2 protein and other species. Identical and similar residues are highlighted in yellow and red, respectively.
mRNA expression profile of AIFM2 gene in tissues of the yak
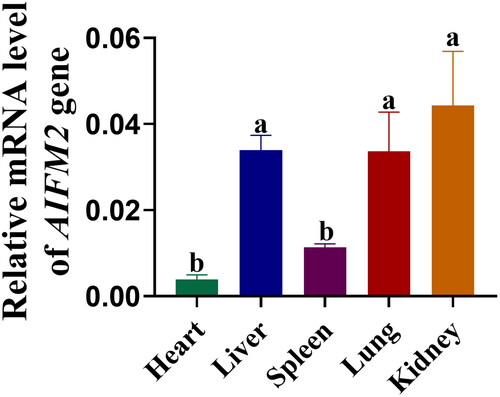
To obtain the expression profile of the AIFM2 gene in the yak, we subsequently measured its mRNA levels in various tissues including the heart, liver, spleen, lungs, and kidneys using the RT-qPCR. The findings showed a broad expression pattern of the AIFM2 gene across different tissues of yaks. Notably, the gene exhibited significantly higher expression levels in the liver, lungs, and kidneys compared to the heart and spleen (p < 0.05) ().
Figure 2. mRNA Expression profile of AIFM2 gene in tissues of yak. The RT-qPCR results were analyzed using the 2−Δct method.Citation26 Different letters upon panels mean significant difference.
Isolation, culture and identification of yak skin fibroblasts (YSFs)
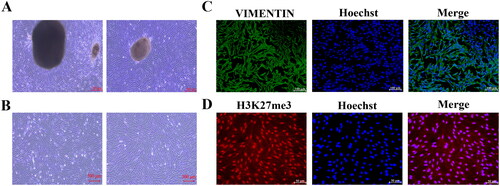
To identify the effective approach for establishing the primary cell line from yak fetus skin, we conducted a comparison between the tissue block method and the enzymatic method for isolating YSFs. The findings demonstrated that the tissue block method exhibited superior growth of primary fibroblasts after 8 days of cultivation. These fibroblasts displayed diverse morphologies including triangular and circular shapes (). Conversely, the enzymatic method resulted in the rapid proliferation of primary cells within 5 days of cultivation, demonstrating the characteristic morphology of fibroblasts (). Immunofluorescence analysis revealed that YSFs obtained through the enzymatic method exhibited the specific expression of the fibroblast marker protein VIMENTIN () and histone H3 lysine 27 trimethylation (H3K27me3), an epigenetic modification associated with cellular status (). Therefore, our current study demonstrated that the enzymatic method was highly effective in yielding YSFs with the characteristic features of fibroblast cells.
Figure 3. Isolation, culture, and identification of YSFs. (A) Bright-field observation photographs of fibroblasts isolated and cultured using tissue block method. Scale = 500 μm. (B) Bright-field observation photographs of fibroblasts isolated and cultured by enzymatic method. Scale = 500 μm. (C) Immunofluorescence staining of VIMENTIN in enzymatic method-derived YSFs. Scale = 100 μm. (D) Immunofluorescence staining of H3K27me3 in enzymatic method-derived YSFs. Scale = 50 μm.
Establishment of BPA-induced toxicity model of YSFs
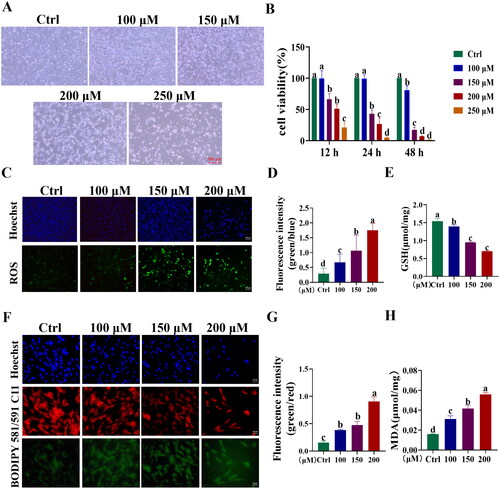
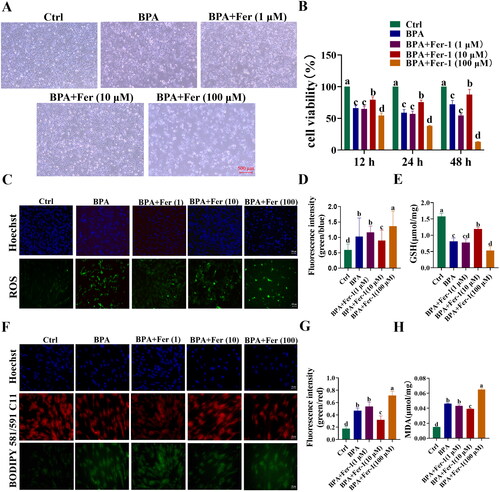
Subsequently, we developed a BPA-induced toxicity model in YSFs to investigate the potential involvement of the AIFM2 gene in yak cells. Initially, YSFs were exposed to various concentrations of BPA (Ctrl, 100, 150, 200, and 250 μM), after which cellular morphology and viability were examined and assessed at 12, 24, and 48 h. Bright-field images demonstrated that as the concentration of BPA increased, the number of apoptotic cells gradually increased (). Comparing to the group control (Ctrl), BPA impaired the cell viability with a dosage-dependent manner, and we found a significant decrease in cell viability after treatment with 150 μM BPA in YSFs (p < 0.01) (). Moreover, we observed a progressive elevation in the levels of reactive oxygen species (ROS) in response to BPA exposure (p < 0.05) (). Furthermore, we observed a gradual decline in the cellular glutathione (GSH) content as the dosage of BPA increased (p < 0.05) (). Moreover, the levels of lipid peroxidation including BODIPY581/591 C11 (p < 0.05) () and MDA (p < 0.05) () were also increased gradually with the increasing of BPA concentrations. These findings suggested that BPA exerted dose-dependent cytotoxic effects on YSFs. Based on these results, 150 μM was the optimal concentration for successfully inducing the ferroptosis model and we chose to treat the YSFs with 150 μM of BPA for 24 h to proceed with the subsequent experiments.
Figure 4. Establishment of BPA-induced toxicity model of YSFs. YSFs were treated with different concentrations of BPA (Ctrl, 100, 150, 200, and 250 μM) for 24 h. (A) Representative images of bright field for YSFs after BPA treatment. Scale = 500 μm. (B) Cell viability of YSFs after BPA treatment. (C) Representative images of reactive oxygen species (ROS) staining for YSFs after BPA treatment. Scale = 100 μm. (D) Ratio of fluorescence intensity statistics (green/blue) corresponding to ROS staining. (E) Content of GSH in YSFs after BPA treatment. (F) Representative images of BODIPY 581/591 C11 staining after BPA treatment. Scale = 50 μm. (G) Ratio of fluorescence intensity statistics (green/red) corresponding to BODIPY 581/591 C11 staining. (H) Content of MDA in YSFs after BPA treatment. Different letters upon panels mean significant difference.
Validation of BPA-induced ferroptosis in YSFs
To provide additional evidence that BPA induces ferroptosis in YSFs, we employed Ferrostatin-1 (Fer), a well-documented small molecule inhibitor that has been extensively investigated for its potent inhibitory effect on ferroptosis in both in vivo and in vitro settings.Citation27 To examine the role of Fer in the context of BPA-induced ferroptosis, we co-treated YSFs with BPA (150 μM) and Fer. Bright-field images and cell viability assays demonstrated that, in comparison to the BPA-treated group, the co-treatment of YSFs with 10 μM Fer significantly decreased the number of deceased cells and restored cell viability (p < 0.05) (). Notably, this effect was not observed with 1 μM or 100 μM Fer concentrations (). Additionally, the level of ROS in group BPA + Fer (10 μM) was significantly reduced (p < 0.05) comparing with the group BPA (), and the GSH content was significantly increased (p < 0.05) (), indicating that Fer (10 μM) alleviated the oxidative damage induced by BPA in YSFs. Moreover, 10 μM Fer significantly reduced the level of BODIPY 581/91 C11 (p < 0.05) () and MDA (p < 0.05) () in YSFs, suggesting its ability to alleviate lipid peroxidation triggered by BPA. In conclusion, our findings demonstrated the successful establishment of a BPA-induced ferroptosis model in YSFs, thereby confirming the potent ferroptosis-inducing capability of BPA in yak cells.
Figure 5. Validation of BPA-induced ferroptosis in YSFs. YSFs were treated with BPA (150 μΜ) and Fer (1, 10, 100 μΜ) for 24 h. (A) Representative images of bright field for YSFs after BPA and Fer treatment. Scale = 500 μm. (B) Cell viability of YSFs after BPA and Fer treatment. (C) Representative image of ROS staining for YSFs after BPA and Fer treatment. Scale =100 μm. (D) Ratio of fluorescence intensity statistics (green/blue) corresponding to ROS staining. (E) GSH content in YSFs after BPA and Fer treatment. (F) Representative images of BODIPY 581/591/C11 staining for YSFs after BPA and Fer treatment. Scale = 50 μm. (G) Ratio of fluorescence intensity statistics (green/red) corresponding to BODIPY 581/591 C11 staining. (H) Content of MDA in YSFs after BPA and Fer treatment. Different letters upon panels mean significant difference.
Overexpression of yak AIFM2 gene alleviates BPA-induced ferroptosis in YSFs
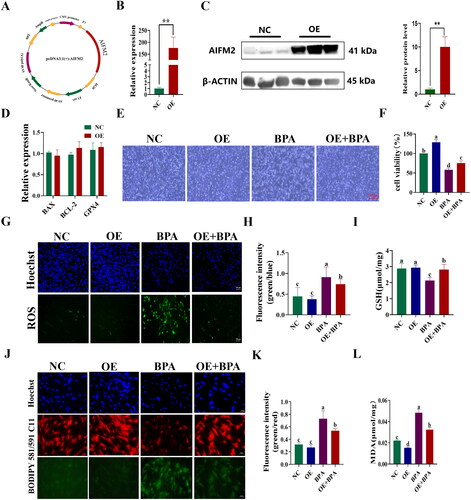
Firstly, we confirmed the successful construction of the pcDNA3.1(+)-AIFM2 overexpression (OE) vector using the homologous recombination method (). Notably, in group OE, the yak AIFM2 gene exhibited a significant up-regulation at the mRNA level, approximately 200-fold higher than the control group (NC) (p < 0.01) (). Similarly, at the protein level, the expression of yak AIFM2 protein in group OE exhibited a significant up-regulation compared to the group NC (p < 0.01) (). RT-qPCR results showed that the mRNA levels of BAX, BCL-2 and GPX4 in group OE were not significantly different from those of the group NC (). Subsequently, to investigate the role of the AIFM2 gene in BPA-induced ferroptosis in YSFs, we transfected the OE vector into YSFs. After 24 h, the corresponding groups were treated with cell culture medium containing 150 μM BPA for an additional 24 h. The bright-field results clearly demonstrated that the overexpression of yak AIFM2 gene obviously decreased the number of apoptotic cells () and significantly increased cell viability (p < 0.05) in BPA-exposed YSFs, as compared to the BPA-treated group (). Moreover, the level of ROS was markedly reduced (p < 0.05) (), and the content of GSH was significantly increased (p < 0.05) () in group OE + BPA compared to the BPA-treated group. This finding indicated that overexpression of the yak AIFM2 gene effectively mitigated BPA-induced oxidative stress in YSFs. Moreover, compared to the group treated with BPA alone, the levels of BODIPY 581/591 C11 (p < 0.05) () and malondialdehyde (MDA) (p < 0.05) () in group OE + BPA were significantly decreased, indicating that overexpression of the yak AIFM2 gene had the potential to mitigate BPA-induced lipid peroxidation. These findings suggested that the overexpression of the yak AIFM2 gene effectively reduced BPA-induced ferroptosis in YSFs.
Figure 6. Overexpression of AIFM2 gene alleviates BPA-induced ferroptosis in YSFs. NC: YSFs with pcDNA3.1 (+) transfection. OE: YSFs with pcDNA3.1 (+)-AIFM2 transfection. BPA: YSFs with 150 μM BPA treatment. OE + BPA: YSFs with pcDNA3.1 (+) – AIFM2 transfection and BPA treatment. (A) Construction of pcDNA3.1 (+) – AIFM2 overexpression vector. (B) Relative expression level of AIFM2 in YSFs transfected with pcDNA3.1 (+) – AIFM2. RT-qPCR results were analyzed using the 2−ΔΔct method. (C) Verification of AIFM2 overexpression at protein level. (D) Relative expression level of BAX, BCL-2 and GPX4 in YSFs transfected with pcDNA3.1 (+) – AIFM2. RT-qPCR results were analyzed using the 2−ΔΔct method. (E) Representative photos of bright field for YSFs after pcDNA3.1 (+) – AIFM2 transfection and/or BPA treatment. Scale = 500 μm. (F) Cell viability of YSFs after pcDNA3.1 (+) – AIFM2 transfection and/or BPA treatment. (G) Representative images of reactive oxygen species (ROS) staining for YSFs after pcDNA3.1 (+) – AIFM2 transfection and/or BPA treatment. Scale = 100 μm. (H) Ratio of fluorescence intensity statistics (green/blue) corresponding to ROS staining. (I) Content of GSH in YSFs after pcDNA3.1 (+) – AIFM2 transfection and/or BPA treatment. (J) Representative image of BODIPY 581/591/C11 staining for YSFs after pcDNA3.1 (+) – AIFM2 transfection and/or BPA treatment. Scale = 50 μm. (K) The ratio of fluorescence intensity statistics (green/red) corresponding to BODIPY 581/591 C11 staining. (L) Content of MDA in YSFs after pcDNA3.1 (+) – AIFM2 transfection and/or BPA treatment. Different letters upon panels mean significant difference.
Interference with AIFM2 gene exacerbates BPA-induced ferroptosis in YSFs
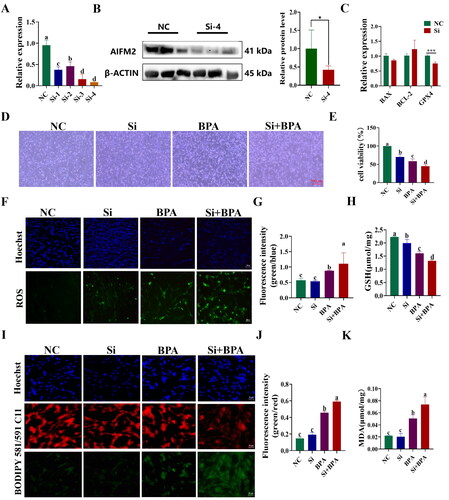
To further investigate the anti-ferroptosis role of the yak AIFM2 gene, YSFs were transfected with AIFM2-specific siRNAs (Si 1-4), and the interference efficiency was assessed using RT-qPCR and Western blot. Compared to the non-targeting negative control (NC), the mRNA level of AIFM2 was significantly diminished following siRNAs transfection (p < 0.01) (). Among the siRNAs tested, siRNA-4 (Si-4) exhibited the highest interference efficiency and was chosen for further experiments. The yak AIFM2 protein in group Si-4 exhibited a significant down-regulation compared to the group NC (p < 0.05) (). RT-qPCR results showed that the mRNA levels of BAX and BCL-2 in group Si were not significantly different from those of the group NC, but the mRNA levels of GPX4 in group Si exhibited a significant down-regulation compared to the group NC (p < 0.05) (). Consistent with the transfection method used for the OE vector, siRNA was transfected into YSFs for 24 h, followed by the addition of culture medium containing 150 μM BPA for another 24 h of treatment. Bright-field results revealed that, compared to the BPA-treated group, interfering with the AIFM2 gene significantly augmented the number of apoptotic cells () and caused a notable decrease in cell viability (p < 0.05) in BPA-cultured YSFs (). Furthermore, when compared to the BPA-treated group, interfering with the AIFM2 gene significantly elevated the levels of reactive oxygen species (ROS) (p < 0.05) () and markedly reduced the content of glutathione (GSH) (p < 0.05) () in the Si + BPA group, indicating that interfering with the AIFM2 gene increased oxidative stress. Moreover, after interfering AIFM2 gene in BPA-treated YSFs, the level of BODIPY (p < 0.05) () and MDA (p < 0.05) () were significantly increased compared to the BPA-treated group, indicating an increasement of lipid peroxidation. In conclusion, our study provided evidence that interfering with the AIFM2 gene enhanced BPA-triggered ferroptosis in YSFs and further confirmed the protective role of the AIFM2 gene against ferroptosis in yak cells.
Figure 7. Interference with AIFM2 gene exacerbates BPA induced ferroptosis in YSFs. NC: YSFs with Non-targeted negative control transfection. Si: YSFs with siRNA-4 transfection. BPA: YSFs with 150 μM BPA treatment. Si + BPA: YSFs with siRNA-4 transfection and BPA treatment. (A) Relative expression level of AIFM2 after specific siRNAs interference in YSFs. The RT-qPCR results were analyzed using 2−ΔΔCt method. (B) Validation of AIFM2 inteference at protein level. (C) Relative expression level of BAX, BCL-2 and GPX4 in YSFs transfected with siRNA-4. RT-qPCR results were analyzed using the 2−ΔΔct method. (D) Representative photos of bright field for YSFs after siRNA-4 transfection and/or BPA treatment. Scale = 500 μm. (E) Cell viability of YSFs after siRNA-4 transfection and/or BPA treatment. (F) Representative images of ROS for YSFs after siRNA-4 transfection and/or BPA treatment. Scale = 100 μm. (G) Ratio of fluorescence intensity statistics (green/blue) corresponding to ROS staining. (H) Content of GSH in YSFs after siRNA-4 transfection and/or BPA treatment. (I) Representative image of BODIPY 581/591/C11 staining for YSFs after siRNA-4 transfection and/or BPA treatment. Scale = 50 μm. (J) Ratio of fluorescence intensity statistics (green/red) corresponding to BODIPY 581/591 C11 staining. (K) Content of MDA in YSFs after siRNA-4 transfection and/or BPA treatment. Different letters upon panels mean significant difference.
Discussion
The apoptosis-inducing factor (AIF) family represented a group of death effectors that can induce apoptosis independently of caspase activation.Citation28 AIFM2 (FSP1), a member of AIF, played a crucial role in the regulation of mitochondrial function, cell apoptosis, lipid peroxidation, and other related processes.Citation13 To gain insights into the functions of yak AIFM2, we cloned the coding sequence of the AIFM2 gene from yak liver and carried out a comprehensive bioinformatic analysis. The coding region of the yak AIFM2 gene spanned 1122 bp, which translated to a protein of 373 amino acids. Moreover, we have observed extensive expression of the AIFM2 gene in numerous tissues of yaks, suggesting its potential involvement in various biological processes. This study marked the inaugural investigation into the functional significance of the AIFM2 gene in yaks.
In addition to its well-known involvement in apoptosis, recent researches have revealed that AIFM2 serves as a regulator of ferroptosis.Citation13,Citation14 To investigate the anti-ferroptosis efficacy of AIFM2 in yak cells, we established a ferroptosis model in YSFs using BPA. Initially, we revealed that the enzymatic method exhibited higher efficiency than the tissue block method to isolate YSFs. An immunofluorescence technique utilizing the fibroblast-specific protein marker VIMENTINCitation29 and an epigenetic modification indicative of cell status H3K27me3Citation30 was employed to confirm the identity of fibroblasts. As anticipated, the results demonstrated the expression of VIMENTIN in fibroblasts, along with the presence of histone H3K27me3. Next, we established the ferroptosis model by BPA in vitro. Numerous studies have reported that exposure to BPA induced a decline in cellular viability and triggered alterations in cell morphology as prominent characteristics.Citation23,Citation24 In this study, YSFs were exposed to various concentrations of BPA, resulting in an elevated rate of cell fatalities, aggravated condition, and reduced cellular viability. These findings paralleled previous results highlighting the harmful impact of BPA in triggering different types of cell death, thereby unveiling the detrimental role of BPA in organisms. However, the negative effects of BPA on cells go far beyond that, it has been shown that exposure of skeletal muscle cells to high concentrations of BPA leads to mitochondrial dysfunction.Citation31 BPA exposure leads to hormonal disruption and mitochondrial dysfunction in males, mainly characterized by altered mitochondrial dynamics and impaired mitochondrial activity, which ultimately leads to reduced bear fertility.Citation32 However, these specific mechanisms remain to be further explored.
The lipid peroxidation is a crucial hallmark of ferroptosis and has been considered a key indicator in studies.Citation23,Citation25 Emergence of ferroptosis was frequently evidenced by alterations in levels of lipid peroxidation markers, such as BODIPY and MDA.Citation25 Likewise, incubating cells with BPA in the current study resulted in a rise in lipid peroxidation indicators, comprising ROS, BODIPY, and MDA. Previous studies have found that the occurrence of certain forms of ferroptosis can be alleviated by ferroptosis inhibitors, such as Ferrostatin-1.Citation24 It has been reported that Fer exerts its resistance to ferroptosis mainly through its antioxidant function.Citation33 However, this anti-ferroptosis function of Fer depends on the experimental conditions.Citation33–35 Hence, in the present study, we treated the BPA-cultured YSFs with different dose of Fer (1, 10, and 100 μM). The findings indicated that 10 µM Fer was the most effective in inhibiting ferroptosis. However, 1 μM Fer was insufficient in achieving the desired inhibitory effect, possible due to its low dosage. Conversely, 100 μM Fer, proved as an extensive dose in this study, not only failed to inhibit ferroptosis but also resulted in detrimental effects, including decreased cell viability and increased cell death. The specific reasons for these results remain to be further explored. Collectively, these results provided further evidence supporting the role of BPA in triggering ferroptosis in YSFs.
Emerging researches have delved into exploring the mechanisms underlying the attenuation of ferroptosis, highlighting the involvement of different pathways in counteracting this intricate process. Among these, AIFM2 (FSP1) exerted its anti-ferroptosis function through multiple pathways, including the FSP1-CoQ10-NAD(P)H pathway,Citation14 ESCRT-III dependent membrane repair mechanismCitation15 and vitamin K cycle.Citation18 Using the lentivirus transfection method, Wu et al. showed that overexpression of AIFM2 (FSP1) through PI3K/AKT/GSK3β pathway significantly enhanced the ability to reverse ferroptosis, which were manifested by the increase of cell viability and the decrease of ROS and MDA levels.Citation36 In our experiment, the mRNA levels of BAX, BCL-2 and GPX4 in group OE were not significantly different from those of the group NC. The results suggested that overexpression of the AIFM2 gene did not significantly affect the cellular state, which further ensured the reliability of the results of subsequent experiments in the ferroptosis model induced by BPA. Then we observed that overexpression of the AIFM2 gene in BPA-treated YSFs resulted in a significant increase in cell viability and GSH content. Moreover, it led to a decrease in the levels of ROS, BODIPY, and MDA. These findings indicated that activation of the AIFM2 gene effectively reduced BPA-induced lipid peroxidation and ferroptosis.
Furthermore, in order to verify the functions of AIFM2, we conducted additional experiments by interfering with the AIFM2 gene. Interestingly, the results revealed that the mRNA levels of BAX and BCL-2 in group Si were not significantly different from those of the group NC, but the mRNA levels of GPX4 in group Si exhibited a significant down-regulation compared to the group NC. It was shown that cells with down-regulated GPX4 expression were more susceptible to ferroptosis,Citation37 and the significant down-regulation of GPX4 expression after knockdown of AIFM2 implied an important role for AIFM2 in resisting ferroptosis. Consistently, knockdown of the AIFM2 gene in BPA-treated YSFs led to a significant decrease in cell viability and GSH content compared to the BPA-treated group. In contrast, the levels of ROS, BODIPY, and MDA were significantly increased. These findings suggested that the reduction of AIFM2 exacerbated lipid peroxidation and promoted ferroptosis in BPA-exposed YSFs. The results highlighted the crucial role of AIFM2 in anti- ferroptosis.
In summary, we successfully cloned the coding region of the yak AIFM2 gene and extensively investigated its role in countering ferroptosis in YSFs. Our findings not only offered both experimental and theoretical evidences for understanding the mechanisms underlying ferroptosis resistance, but also provided valuable insights for potential therapeutic strategies targeting reproductive system disorders in both humans and animals, as well as for enhancing reproductive efficiency in yaks. It is worth to mention that only three-month-old yak fetal samples were used in this experiment when exploring the function of the yak AIFM2 gene in resisting ferroptosis. Considering the individual and age differences of the animals, this is a limitation in this study, and the role of the AIFM2 gene in yaks remains to be further investigated.
Conclusion
The coding region of the yak AIFM2 gene spanned 1122 bp, encoding a protein consisting of 373 amino acids. The yak AIFM2 gene exhibited a high degree of conservation across mammalian species and was expressed widely in various tissues of yaks. The results highlighted the crucial role of the yak AIFM2 gene in countering ferroptosis, as demonstrated in our BPA-induced ferroptosis model using YSFs.
CRediT authorship contribution statement
Yueyue Li: Conceptualization, Formal analysis, Investigation, Methodology, Writing-original draft. Hongmei Xu: Formal analysis, Investigation, Methodology. Zifeng Ma: Methodology, Validation. Qiao Li: Methodology, Data curation. Yan Xiong: Formal analysis, Methodology. Xianrong Xiong: Formal analysis, Methodology. Jian Li: Formal analysis, Methodology. Daoliang Lan: Formal analysis, Investigation, Methodology. Wei Fu: Conceptualization, Formal analysis, Methodology, Project acquisition, Collaboration and manuscript correction.
Supplement_Figures-.docx
Download MS Word (986.6 KB)Supplementary Tables.xlsx
Download MS Excel (13.3 KB)Acknowledgments
The authors acknowledge contributions from Ke Yang (Translation Study Center of Chinese Minzu Literature of Southwest Minzu University) for the final version of the manuscript.
Disclosure statement
We certify that there is no conflict of interest with any financial organization regarding the material discussed in the manuscript. All authors declare no conflicts of interest.
Additional information
Funding
References
- Ayalew W, Chu M, Liang C, Wu X, Yan P. Adaptation mechanisms of Yak (Bos grunniens) to high-altitude environmental stress. Animals. 2021;11(8):2344.
- Zhang J, Cui Y. Integrative analysis identifies potential ferroptosis-related genes of hypoxia adaptation in yak. Front Vet Sci. 2022;9:1022972.
- Bertheloot D, Latz E, Franklin BS. Necroptosis, pyroptosis and apoptosis: an intricate game of cell death. Cell Mol Immunol. 2021;18(5):1106–1121.
- Wiernicki B, Dubois H, Tyurina YY, et al. Excessive phospholipid peroxidation distinguishes ferroptosis from other cell death modes including pyroptosis. Cell Death Dis. 2020;11(10):922.
- Bao WD, Pang P, Zhou XT, et al. Loss of ferroportin induces memory impairment by promoting ferroptosis in Alzheimer’s disease. Cell Death Differ. 2021;28(5):1548–1562.
- Tang D, Chen X, Kang R, Kroemer G. Ferroptosis: molecular mechanisms and health implications. Cell Res. 2021;31(2):107–125.
- Wang K, Chen XZ, Wang YH, et al. Emerging roles of ferroptosis in cardiovascular diseases. Cell Death Discov. 2022;8(1):394.
- Yang WS, SriRamaratnam R, Welsch ME, et al. Regulation of ferroptotic cancer cell death by GPX4. Cell. 2014;156(1-2):317–331.
- Kim DH, Kim WD, Kim SK, Moon DH, Lee SJ. TGF-β1-mediated repression of SLC7A11 drives vulnerability to GPX4 inhibition in hepatocellular carcinoma cells. Cell Death Dis. 2020;11(5):406.
- Kraft VAN, Bezjian CT, Pfeiffer S, et al. GTP cyclohydrolase 1/tetrahydrobiopterin counteract ferroptosis through lipid remodeling. ACS Cent Sci. 2020;6(1):41–53.
- Mishima E, Nakamura T, Zheng J, et al. DHODH inhibitors sensitize to ferroptosis by FSP1 inhibition. Nature. 2023;619(7968):E9–E18.
- Xu H, Li Y, Li Q, et al. Cloning and characterization of Yak DHODH gene and its functional studies in a bisphenol S-induced ferroptosis model of fetal fibroblasts. Animals. 2023;13(24):3832.
- Bersuker K, Hendricks JM, Li Z, et al. The CoQ oxidoreductase FSP1 acts parallel to GPX4 to inhibit ferroptosis. Nature. 2019;575(7784):688–692.
- Doll S, Freitas FP, Shah R, et al. FSP1 is a glutathione-independent ferroptosis suppressor. Nature. 2019;575(7784):693–698.
- Nogi Y, Kanno T, Nakano T, et al. AMP converted from intracellularly transported adenosine upregulates p53 expression to induce malignant pleural mesothelioma cell apoptosis. Cell Physiol Biochem. 2012;30(1):61–74.
- Dai E, Zhang W, Cong D, Kang R, Wang J, Tang D. AIFM2 blocks ferroptosis independent of ubiquinol metabolism. Biochem Biophys Res Commun. 2020;523(4):966–971.
- Shi ZZ, Tao H, Fan ZW, Song SJ, Bai J. Prognostic and immunological role of key genes of ferroptosis in pan-cancer. Front Cell Dev Biol. 2021;9:748925.
- Mishima E, Ito J, Wu Z, et al. A non-canonical vitamin K cycle is a potent ferroptosis suppressor. Nature. 2022;608(7924):778–783.
- Yujiao C, Meng Z, Shanshan L, Wei W, Yipeng W, Chenghong Y. Exposure to Bisphenol A induces abnormal fetal heart development by promoting ferroptosis. Ecotoxicol Environ Saf. 2023;255:114753.
- Gan J, Gu T, Hong L, Cai G. Ferroptosis-related genes involved in animal reproduction: An Overview. Theriogenology. 2022;184:92–99.
- Gao M, Fan K, Chen Y, Zhang G, Chen J, Zhang Y. Understanding the mechanistic regulation of ferroptosis in cancer: the gene matters. J Genet Genomics. 2022;49(10):913–926.
- Wei X, Yi X, Zhu XH, Jiang DS. Posttranslational modifications in ferroptosis. Oxid Med Cell Longev. 2020;2020:8832043.
- Hémon A, Louandre C, Lailler C, et al. SLC7A11 as a biomarker and therapeutic target in HPV-positive head and neck squamous cell carcinoma. Biochem Biophys Res Commun. 2020;533(4):1083–1087.
- Mao H, Zhao Y, Li H, Lei L. Ferroptosis as an emerging target in inflammatory diseases. Prog Biophys Mol Biol. 2020;155:20–28.
- Hadian K. Ferroptosis suppressor protein 1 (FSP1) and coenzyme Q10 cooperatively suppress ferroptosis. Biochemistry. 2020;59(5):637–638.
- Sankar S, Maruthai K, Bobby Z, Adhisivam B. MicroRNA expression in neonates with late-onset sepsis – A cross-sectional comparative study. Immunol Invest. 2022;51(6):1647–1659.
- Bao L, Zhao C, Feng L, et al. Ferritinophagy is involved in Bisphenol A-induced ferroptosis of renal tubular epithelial cells through the activation of the AMPK-mTOR-ULK1 pathway. Food Chem Toxicol. 2022;163:112909.
- Tsuchiya A, Kanno T, Saito M, et al. Intracellularly transported adenosine induces apoptosis in [corrected] MCF-7 human breast cancer cells by accumulating AMID in the nucleus. Cancer Lett. 2012;321(1):65–72.
- Souders CA, Bowers SLK, Troy A. Cardiac fibroblast: the renaissance cell. Circ Res. 2009;105(12):1164–1176.
- Krämer M, Dees C, Huang J, et al. Inhibition of H3K27 histone trimethylation activates fibroblasts and induces fibrosis. Ann Rheum Dis. 2013;72(4):614–620.
- Ahmed F, Chehadé L, Garneau L, Caron A, Aguer C. The effects of acute BPA exposure on skeletal muscle mitochondrial function and glucose metabolism. Mol Cell Endocrinol. 2020;499:110580.
- Ryu DY, Pang WK, Adegoke EO, Rahman MS, Park YJ, Pang MG. Bisphenol-A disturbs hormonal levels and testis mitochondrial activity, reducing male fertility. Hum Reprod Open. 2023;2023(4):hoad044.
- Liu P, Feng Y, Li H, et al. Ferrostatin-1 alleviates lipopolysaccharide-induced acute lung injury via inhibiting ferroptosis. Cell Mol Biol Lett. 2020;25(25):10.
- Xiao Z, Kong B, Fang J, et al. Ferrostatin-1 alleviates lipopolysaccharide-induced cardiac dysfunction. Bioengineered. 2021;12(2):9367–9376.
- Xie J, Ye Z, Li L, et al. Ferrostatin-1 alleviates oxalate-induced renal tubular epithelial cell injury, fibrosis and calcium oxalate stone formation by inhibiting ferroptosis. Mol Med Rep. 2022;26(2):256.
- Wu Y, Shi H, Zheng J, et al. Overexpression of FSP1 ameliorates ferroptosis via PI3K/AKT/GSK3β pathway in PC12 cells with oxygen-glucose deprivation/reoxygenation. Heliyon. 2023;9(8):e18449. e18449.
- Imai H, Matsuoka M, Kumagai T, Sakamoto T, Koumura T. Lipid peroxidation-dependent cell death regulated by GPx4 and ferroptosis. Curr Top Microbiol Immunol. 2017;403:143–170.