
Abstract
Objective
To explore mental health associations during eating disorder (ED) treatment. Based on the dual-continua model of mental health, general and ED-specific psychopathology, as well as emotional, psychological, and social well-being were considered as mental health domains.
Method
Network analyses with panel data were applied to explore within- (temporal and contemporaneous networks) and between-person effects in a sample of 1250 female ED patients during 12 months of outpatient treatment. The associations between the domains and their centrality were examined. Autoregressive and cross-lagged effects were also estimated.
Results
ED psychopathology was the most central domain in the temporal network. ED psychopathology changes predicted further ED psychopathology changes and small changes in the other domains. Weak bi-directional associations were found between changes in the well-being domains and general psychopathology. In contrast to the temporal network, ED psychopathology was the least central and psychological well-being the most central domain in the contemporaneous and between-subjects networks. This suggests a central role of psychological well-being for experiencing mental health within time points.
Conclusions
ED psychopathology may change relatively independent from other mental health domains. Well-being domains may be considered as more stable aspects of mental health.
Clinical or methodological significance of this article: Panel data network analyses may provide additional knowledge about how mental health changes during treatment. We found that eating disorder psychopathology may change relatively independently from other mental health domains (temporal effects), while psychological well-being may be considered a more stable and influential domain for experiencing mental health within time points (contemporaneous effects). In line with current evidence, our findings corroborate that a strong focus on ED symptom change should be considered a primary aim of treatment. In addition, an important secondary aim of treatment could be to focus on promoting mental well-being.
Eating disorders (EDs), such as anorexia nervosa (AN), bulimia nervosa (BN), and binge eating disorder (BED), are psychiatric disorders with a lifetime prevalence of over 8% for women and 2% for men (Galmiche et al., Citation2019). EDs lead to impaired quality of life and an increased risk for somatic complications and mortality (van Hoeken & Hoek, Citation2020). Also, psychiatric co-morbidity rates of over 70% are reported in ED patients (Keski-Rahkonen & Mustelin, Citation2016). The specific symptoms of an ED are dependent on the type and concern disordered behaviours, such as restricting or bingeing, compensatory behaviours such as self-induced vomiting, and cognitive and emotional disturbances around eating, weight and body shape (American Psychiatric Association, Citation2013). ED treatments show modest effects in terms of how many patients achieve remission on core symptoms (Grenon et al., Citation2019; van Hoeken & Hoek, Citation2020).
A better understanding of how symptoms interact and change over time may give direction on how to improve treatments. One innovative scientific approach to explore symptom associations and change is the application of psychometric network theory. Psychometric network theory suggests that psychopathological symptoms become self-sustaining in psychiatric disorders by actively maintaining and reinforcing each other (Borsboom, Citation2017). These self-sustaining patterns lead to a network of symptoms becoming stuck in a “disorder state” (Borsboom, Citation2017). Knowledge of how symptoms maintain or reinforce each other during treatment may be crucial for understanding which symptoms to address (Jordan et al., Citation2020).
A psychometric network gives a visual overview of how symptoms (described as nodes in a network) are associated with each other (described as edge-weights) (Epskamp et al., Citation2014). Also, the centrality of the nodes can be measured in terms of how well connected a node is to other nodes (Bringmann et al., Citation2019). Centrality implicates the influence of a node in a network compared to the other nodes (Epskamp et al., Citation2014). There is a rapidly growing body of psychometric network studies in ED patients, leading to a better understanding of how symptoms are related to each other. These studies have either focused on the associations among ED symptoms (within and across ED types), or on a combination of ED symptoms and co-morbidity, such as trauma, social anxiety or general psychopathology (i.e. general distress, anxiety and mood symptoms). Overall, similar central ED symptoms were found across studies, such as shape and weight over-evaluation (Elliott et al., Citation2020; Levinson et al., Citation2017). Also, influential co-morbid symptoms across studies were found in ED patients, such as feeling overwhelmed, nervousness, concentration difficulties, low self-esteem (Smith et al., Citation2019), depression, anxiety, interpersonal sensitivity and ineffectiveness (Monteleone et al., Citation2019).
Networks were estimated recently in ED patients with a focus on mental health (de Vos et al., Citation2021). These networks were based on a general framework for mental health consisting of psychopathology (i.e. ED specific and general psychopathology) and domains of mental well-being (de Vos et al., Citation2021). The World Health Organization (WHO) explains mental health not merely as the absence of psychopathology but also as the presence of mental well-being (Promoting Mental Health. Concepts, Emerging Evidence, Practice, Citation2004). This has been operationalized as the dual-continua model of mental health (Keyes, Citation2005). A substantial body of research shows that psychopathology and well-being are not two extreme ends of a single continuum but distinct yet related continua, suggesting that both should be addressed in a mental health framework (Bohlmeijer & Westerhof, Citation2020). The importance of a broader focus on mental health in treatment is growingly recognized (Bohlmeijer & Westerhof, Citation2020). Mental well-being can be defined in several ways but is often explained in three domains: emotional, psychological, and social (Keyes, Citation2005). Former research on the mental health network in ED patients showed that psychological well-being was the most central domain, and ED psychopathology was only weakly related to well-being (de Vos et al., Citation2021). Also, a more detailed network on a symptom level was estimated, consisting of psychopathology (6 ED specific and 16 general symptoms) and 14 well-being symptoms. Feeling depressed, feeling worthless in life, purpose in life, and self-acceptance were the most influential nodes in the symptom network (de Vos et al., Citation2021).
Psychometric network theory suggests that changes in influential symptoms may lead to more substantial changes in overall mental health than changes in peripheral nodes (Borsboom, Citation2017). The rationale is, therefore, that the most central nodes should be of primary importance in treatment. There is, however, discussion about the actual practical implications of centrality in networks (Bringmann et al., Citation2019). Network studies in EDs primarily used cross-sectional study designs depicting average associations across patients at one time-point. Cross-sectional studies do not allow to test for changes and symptom-to-symptom effects over time. In other words, a network estimated on a cross-sectional dataset may provide information about how symptoms are related overall in a group or on a population level. However, they do not depict associations over time within patients. Therefore, based on current studies, it cannot be concluded which symptoms maintain or influence other symptoms over time. Interpreting average associations on a population level as within-subjects processes may lead to wrong conclusions (Hamaker, Citation2012).
Clinicians are in general interested in how changes occur in their patients (within-subjects effects) instead of general effects across patient groups (between-subject effects). Clinicians may wonder which symptoms to address during treatment to achieve recovery in their patients effectively or which psychopathological or well-being symptoms should be treated first or simultaneously. For instance, is it more efficient to promote self-acceptance or purpose in life first before patients can change their ED behaviours or vice versa, or is this individually different? These questions are highly relevant in ED patients because disparate evidence-based treatments give similar results in terms of effectiveness (Grenon et al., Citation2019), while they have very different theoretical assumptions about what leads to change. It is largely unclear how symptoms are related and change over time in patients from a psychometric network perspective.
Appropriate statistical methods to estimate networks and network dynamics over time have only become available recently (Epskamp, Citation2020). Epskamp introduced a novel framework to examine psychometric network effects over time with panel and time-series data (Epskamp, Citation2020). In the panel-data model, average within-subjects effects and between-subjects effects (relationships between stable means) are estimated in separate networks. This allows to explore how, on average, symptoms interact with or maintain other symptoms over time within ED patients and separately explore average associations between symptoms on a sample level.
In sum, ED treatments show modest effectiveness, and understanding symptom associations over time in patients may provide relevant clues to improve treatments. Change should be considered within a broad mental health framework, depicting both psychopathological symptoms and mental well-being. Novel network analysis has recently become available to explore mental health networks over time, but no studies have been published to date in ED patients using panel data. This study aimed to explore mental health networks over time during outpatient treatment in a large and representative sample of patients with EDs. We used an explorative, data-driven approach with novel network methodology (Epskamp, Citation2020) to estimate average within- and between-person symptom associations over time.
Methods
Research Design and Procedure
A panel data design with multiple measurements was used. Data was collected at xxxx, a specialized ED treatment centre with locations across the Netherlands (xxxx). The measurements are based on routine outcome monitoring (ROM) data, collected every three months during a year of ED outpatient treatment. A total of five time points were used, including a baseline measure at the start of treatment. ROM data consists of self-report questionnaires that patients repeatedly fill in to monitor treatment progress. Clinicians discuss the results in a multidisciplinary team consisting of a psychiatrist, clinical psychologist, family therapist and dietician, and separately with the patient. The questionnaires were sent automatically and digitally via Questmanager, a software programme for patient-reported outcomes. Patients were given two weeks to fill in the questionnaires by default. However, this could be extended for another two weeks if necessary. This observational study did not lead to any extra workload for patients. Patients were informed about the aims of the study and signed an informed consent stating that they could withdraw their approval to include their data for research purposes. The study was approved by the Psychology Ethics Committee of the University of Twente.
Patients followed outpatient treatment with sessions once or twice a week with a psychologist. The treatment centre used no pre-set length of treatment, and the majority of patients were in treatment for longer than a year. The procedure to terminate a treatment involved a session with the multidisciplinary team, and a separate conversation with the patient, to discuss whether the treatment goals were met and whether it would have added value to continue treatment. Also, patients could end treatment for a variety of reasons. The following methods were used in treatment; insight oriented therapy, cognitive behavioural therapy, emotion-regulation and food/weight management. Primary therapists were licensed practitioners/psychologists who were recovered themselves from an ED and trained to use their experiential knowledge in treatment.
Participants
Participants were patients diagnosed with an ED by a psychiatrist in collaboration with a clinician and dietician at intake. The inclusion criteria were (1) a minimum age of 17 (criterion to apply for treatment), (2) a primary ED diagnosis, (3) being able to understand and fill in the questionnaires, (4) consent to participate in the research. Patients did not enter treatment if they met one or more of the following conditions during intake: severe and active auto-mutilation, active psychosis, active suicidal ideation, or acute somatic complications. In total, 1426 patients entered outpatient treatment between March 2015 and January 2020 and followed at least the first six months of treatment. Fifty-five patients did not give consent, 39 patients had filled in no (n = 2), or only one measurement (n = 37). Because only 33 patients were men, they were excluded, leading to 1250 included patients. Three hundred and ninety-five patients were diagnosed with AN (31.6%), 272 with BN (21.8%), 94 with BED (7.5%) and 489 with other specified feeding and eating disorders (OSFED, 39.1%). Patients’ characteristics for the complete sample and each ED type can be found in .
Table 1. Characteristics of patients
Instruments and Node Selection
The following questionnaires were administered to the patients: the Eating Disorder Examination Questionnaire (EDE-Q) (Fairburn & Beglin, Citation1994), the Mental Health Continuum Short Form (MHC-SF) (Lamers et al., Citation2011) and the Outcome Questionnaire (OQ-45) (Jong et al., Citation2008). The EDE-Q measures ED pathology (EDP) with 22 attitudinal items divided over four subscales, eating concern (EAT), restraint (RES), shape concern (SHA) and weight concern (WEI) and a global scale. The frequency of symptoms was measured over the past 28 days with two 7-point Likert scale ranges from 0 (not 1 day) to 6 (every day), and from 0 (not at all) to 6 (extremely). Lower scores are indicative of lower EDP. The EDE-Q is an excellent indicator for measuring the severity of EDP (Aardoom et al., Citation2012).
The MHC-SF measures overall mental well-being and three subdomains, emotional (EWB), psychological (PWB) and social well-being (SWB), with 14 items (Keyes, Citation2002; Lamers et al., Citation2011). The presence of well-being was measured over the past month with a 6-point Likert scale ranging from 0 (never) to 5 (always). Higher scores are indicative of higher well-being. The Dutch MHC-SF has demonstrated good construct validity (Lamers et al., Citation2011).
The OQ-45 measures symptomatic distress (SD), social role, and interpersonal functioning. The SD scale was used for this study to measure general psychopathology (GPP) (Warmerdam et al., Citation2017). The frequency of symptoms was measured over the past week with a 5-point Likert scale, ranging from 0 (never) to 4 (always). Based on earlier work on mental health network analysis in ED patients (de Vos et al., Citation2021) and the assumptions of the dual continua model (Keyes, Citation2005), the domains of well-being (EWB, PWB and SWB) and psychopathology (EDP, GPP) were considered as nodes in the overall mental health network. For the measurement of GPP, a modified 16-item scale of the OQ-45 SD scale was used according to the earlier network study (de Vos et al., Citation2021). Items unrelated to GPP (physical complaints) or which showed a substantial topological overlap with well-being were excluded from the modified scale. We were primarily interested in measuring psychopathology and wanted to prevent potentially inflated correlations in the network because of topological overlap (de Vos et al., Citation2021). An example item of a physical complaint is: “I have sore muscles”. An example of topological overlap between items of the SD scale and the MHC-SF is: “I am satisfied with my life” versus; “How often did you feel satisfied with life”. All excluded items can be found in the study of de Vos et al. (Citation2021). The internal consistency of the scales on each time-point can be found in .
Table 2. Scales, abbreviations and internal consistency at each time-point.
Missing Data Strategy
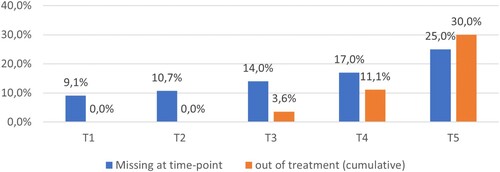
Missing values in longitudinal studies may be intermittent missing data or dropouts during treatment (Yang & Shoptaw, Citation2005). Intermittent missing data can be considered as occasionally missed data points, for instance, a patient who missed a measurement because he or she was on vacation. Dropouts are missing data of patients who stopped treatment due to whatever reason, which is especially relevant in observational data in outpatient treatment. See for an overview of the missing data at each time-point and the patients that went out of treatment (cumulative). Intermittent missing data was relatively stable across the time-points (T1 = 9.1%, T2 = 10.7%, T3 = 14%, T4 = 13.9% and T5 = 15.5%). The effects of dropouts are present at T4 and T5, with respectively 3.6% and 7.6%. Note that patients who stopped treatment around a time point may still have filled in the questionnaires.
Figure 1. Percentages of patients who missed a measure or went out of treatment. Note: Percentages of missing data at a time-point are based on the number of patients in treatment at each time-point (T), while the cumulative out of treatment patients were based on the number of patients included in the study. T1 = the measurement at the start of treatment, and T2 – T5 are recurring measurements every three months.
While intermittent missing data may be considered as missing (completely) at random (MCAR/MAR), this may not be the case for dropout data. For non-simulated longitudinal data, it is difficult or even impossible to discern if data are missing at random or not missing at random (NMAR) (Coertjens et al., Citation2017). Even if the MCAR assumption is met, it is suggested to test the stability of the models’ results under different subsamples, assuming MCAR, MAR and NMAR (Coertjens et al., Citation2017). Isvoranu and Epskamp (Citation2021) suggest to apply data-driven bootstrap methods to check the stability of the results by taking multiple subsamples of the data. In this study, the full information maximum likelihood (FIML) estimator (Cham et al., Citation2017) was used to address missing data, assuming M(C)AR (Jordan et al., Citation2020). A simulation study showed that FIML performed well on several stability benchmarks (i.e. specificity, sensitivity and precision) when estimating psychometric networks (Isvoranu & Epskamp, Citation2021). In addition, 1000 bootstraps of 75% randomly selected subsamples of the final models were run to test the stability. The bootstrap results were compared with the estimated models to check the stability of the included edge-weights.
Analysis
Change scores Average scores of the mental health domains were calculated. Further, the reliable change index (RCI) was measured as the score at twelve months minus the start of treatment divided by the standard error of measurement, calculated with the internal consistency (see , T1 and T5 for the values of each scale) and SD. The proportion of patients with normal health status (i.e., scoring within one SD of the community norms on the domains) was additionally calculated. To measure the average change over time, linear growth curve models were applied to estimate the average slope (rate of change) using the r package Lavaan, version 0.6-7 (Rosseel, Citation2021). Missing data were addressed with FIML estimator, and linear model fit was checked with the root mean square error of approximation (RMSEA) and the incremental fit statistics comparative fit index (CFI), and Tucker-Lewis index (TLI) (Shi & Lee, Citation2019).
Background on network analysis
Mental health domains were represented as nodes in the psychometric networks and the (partial) correlations between nodes as edge weights (Epskamp et al., Citation2014). A network can be either undirected when the edge-weights are represented without a direction or causal relationships between nodes, or directed when the edge-weights are directional, assuming causal associations (i.e. nodes predicting other nodes) (Fried et al., Citation2017). Undirected networks can be estimated in a group of people in cross-sectional data, while directed networks require longitudinal data (Epskamp, Citation2020). Undirected networks provide information about the structure of psychopathology and which nodes are considered influential (centrality) in the network. The relative influence of the nodes (domains) in the networks can be examined with strength centrality (S), which is a measure of a node’s overall involvement in the network, calculated as the sum of all absolute connections to other nodes (McNally, Citation2016). For directed networks, the in-strength and out-strength were calculated. The out-strength is a measure of how strongly a node influences other nodes, and the in-strength is a measure of how strongly a node is influenced by other nodes.
Model estimation: panel-gvar
Panel-gvar models were fitted using version 0.9 of the Psychonetrics package (Epskamp, Citation2021). The panel-gvar is a graphical vector auto-regression model (GVAR) (Epskamp, Citation2020). The (lag-1) GVAR model is a generalization of the Gaussian graphical model (GMM) for time series (single subject design) or panel data (multiple subjects) (Epskamp, Citation2020). The panel-gvar is a multi-level model (measurement occasions nested within individuals) with random effects on the mean structure. The panel-gvar models three separate networks depicting temporal and contemporaneous within-person effects, and between-person effects.
Temporal network
Within-person dependencies are modelled via regression on the previous measurement in the GVAR, which can be used to estimate a directed (temporal) network because it encodes predictive effects over time (Epskamp, Citation2020). In a temporal network, autoregressive effects (changes in a variable are predicted by the same variable) and cross-lagged effects (changes in a variable are predicted by another variable) are estimated.
Contemporaneous network
In addition, the covariance structure can be modelled as a GGM after controlling for the previous measurement occasion, depicting within-person (contemporaneous) network estimates within time points (Epskamp, Citation2020). Contemporaneous networks show within-person associations between nodes in the same measurement window that cannot be explained by temporal effects (Epskamp et al., Citation2018). These relationships between nodes, in our case mental health domains, plausibly unfold faster than over a three months time-frame of measurement, such as moment to moment associations.
Between-subjects network
A GMM network can also be formed on the between-subjects effects level (relationships between stable means) when using panel data. This network explains how variables are related on average across the time points (stationary means) (Epskamp, Citation2020). Between-subject networks are similar to psychometric networks predominantly used in cross-sectional studies, except that the between-subjects network depicts how the variables are related on average across the time points instead of within a single measurement. Networks were estimated in three steps based on the example study of Epskamp (Citation2020). First, an unrestrained model was estimated without any penalties for edge-weight inclusion using the FIML estimator. Model fit was checked with the chi-square goodness of fit test, RMSEA and CFI, the Akaike information criterion (AIC), and the Bayesian information criterion (BIC). However, a good model fit was expected because of the data-driven exploratory approach, in contrast to testing a more confirmatory model. Next, a pruned model was estimated in which edges that were not significant at α = 0.01 were fixed to zero. Third, using a stepwise search approach, a model with an optimal BIC value was fitted. The overall fit was then inspected for all three models. The model with the lowest BIC and adequate overall fit (i.e. CFI ≥ 0.95, RMSEA ≤ 0.06) was chosen as the final model. Partial correlations of the contemporaneous and between-subject networks, as well as autoregressive temporal effects were considered weak when .10, moderate when .30 or strong when .50 to interpret the edge-weights (Cohen, Citation1988). The recommendations of Orth et al. (Citation2022) were followed for the cross-lagged correlations in the temporal networks. Edge-weight correlations were considered weak when .03, medium when .07 and strong when .12.
Results
Change Scores
shows the mean scores at each time-point, the proportion of patients achieving reliable change, scoring within community norms (normal health status) at 12 months of treatment, and the average change (slope) for the health domains. Good model fit for a linear growth curve was found for EWB (RMSEA = 0.053, CFI = 0.99, TLI = 0.99), PWB (RMSEA = 0.050, CFI = 0.99, TLI = 0.99), SWB (RMSEA = 0.048, CFI = 0.99, TLI = 0.99), and adequate model fit for GPP (RMSEA = 0.066, CFI = 0.99, TLI = 0.99), and EDP (RMSEA = 0.090, CFI = 0.98, TLI = 0.98). Statistically significant slopes were found for all mental health domains (see ), indicating that patients’ mental health improved across the domains during treatment. EDP was the mental health domain in which most patients showed a reliable improvement (54.5%) and SWB the domain with the fewest patients improving (0.4%). The majority of the patients were labelled with a normal health status on the well-being domains at twelve months of treatment, while this was only the case for 24.9% of the patients on the EDP domain.
Table 3. Summary statistics of the mental health domains.
Estimating Psychometric Networks and Bootstrap Results
Mental health network
We estimated a series of networks to exploratively examine mental health associations over time. Networks were estimated with the overall mental health domains. shows the model fit indices. All three models showed significant deviation between model-implied and observed data according to the χ2 tests (see ). However, a good overall fit was found for all models (RMSEA = 0.036, CFI = 0.98). The unrestrained model showed the lowest AIC value (47849.60), while the pruned step-up model showed the lowest BIC value (48089.81). Therefore, the most parsimonious model (the pruned step-up model) was selected as the final model.
Table 4. Model fit indices of the mental health models.
Networks and node centrality
The estimated mental health domains networks can be found in , and shows the edge-weights and centrality of the nodes for each network.
Figure 2. Mental health networks. Note: The node descriptions can be found in .
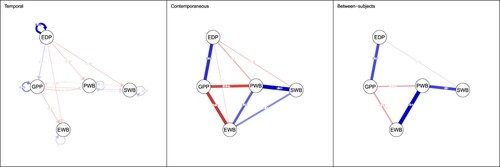
Table 5. Estimated partial correlations and centrality results of the final mental health networks.
The temporal network shows several pathways (directed partial correlations) with medium effect sizes between the domains. EDP shows only outgoing pathways, with a positive medium partial correlation to GPP (r = .11, p < .01) and negative medium partial correlations to all well-being (emotional, r = -.08, p < .01; psychological/social, r = -.09, p < .01) domains over time. This results in the highest out-strength (S = 1.33) and lowest in-strength (S = −1.71) A strong autoregressive correlation was found for EDP (r = .46, p < .01). These results indicate that changes EDP lead to further changes in EDP, and relatively small improvements in the overall mental health network. Bi-directional associations were found in other domains, but changes in these domains did not lead to improvements in EDP over time. GPP shows the second-highest out-strength with medium strength pathways to well-being (emotional, r = -.11, p < .01; psychological, r = -.10, p < .01; social, r = -.08, p < .01). No pathways between EWB and PWB were found.
The contemporaneous network shows average within-person effects within time-points, or on a time span briefer than a three month interval, while controlling for temporal effects. Moderate partial correlations were found for the following edge-weights PWB by SWB (r = .38, p < .01), GPP by EDP (r = .31, p < .01) and GPP by EWB (r = .30, p < .01). PWB (S = 1.26) and GPP (S = 0.67) showed the strongest strength centrality. Interestingly, EDP had the lowest strength centrality (S = −1.21) in the contemporaneous network.
The between-subjects network shows the average relationships between stable means. Strong partial correlations were found for the following edge-weights PWB by EWB (r = .67, p < .01), PWB by SWB (r = .50, p < .01), and GPP by EPD (r = .47, p < .01). PWB had the highest strength centrality (S = 1.55) and EDP (S = −0.92) the lowest.
Bootstraps results
Overall, the bootstraps consistently included the edge-weights of the final model, especially for the contemporaneous model. Although there were some edge-weights with lower inclusion rates (around 500) for EDP to EWB (n = 517) in the temporal network and EDP by WB (n = 504) in the between-subjects network. Of note is the edge-weight EDP by EWB in the contemporaneous network, which was included in only 289 of the 1000 bootstraps. All bootstrap results can be found in the supplements.
Extended mental health network
Given the relatively stable bootstrap results of the final mental health model and the solid out-strength centrality of EDP in the temporal network, we were interested in how the underlying EDP domains were more specifically interrelated and related to the other domains. Therefore, an extended model was estimated, replacing EDP with the subscales of the EDE-Q (EAT, SHA, WEI and RES) to examine the relationships between well-being, GPP and EDP in more depth. See for an overview of the abbreviations of the domains. The extended mental health models also showed significant deviation between model-implied and observed data according to the χ2 tests (see ). The pruned step-up solution was considered as the final model, with a good fit (RMSEA = 0.029, CFI = 0.98) with the lowest AIC (73745.10) and BIC (74181.22) value.
Networks and node centrality
The extended network shows which EDP nodes are connected with other nodes (i.e. GPP and well-being) and how they are interconnected. Overall, the networks show two separate clusters, a well-being cluster including PWB and an EDP cluster.
The temporal network shows overall weakly connected nodes. RES and EAT influence the other EDP nodes (WEI and SHA) and GPP and PWB over time. Hence, they have the highest out-strength (RES, S = 1.16; EAT, S = 1.13) combined with a low in-strength centrality for RES (S = −1.96). The highest in-strength was found for SHA (S = 1.50). See for the estimated partial correlations and centrality measures and for the networks.
Figure 3. Extended mental health networks. Note: The node descriptions can be found in .
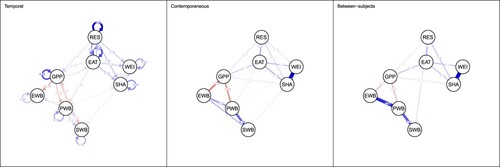
Table 6. Estimated partial correlations and centrality results of the final mental health networks.
The contemporaneous network further shows somewhat stronger partial correlations within time-points. A strong correlation was found for WEI by SHA (r = .66, p < .01) and a moderate correlation for PWB by SWB (r = .39,p < .01). SHA was the most central node (S = 1.25), followed by WEI (S = .84) and PWB (S = 0.81).
The between-subjects network shows a similar pattern across patients compared to the basic mental health network, depicting that the EDP nodes (RES, EAT, and SHA) are primarily connected to GPP and not to the well-being nodes. PWB is the most central (S = 1.69), followed by SHA (S = 1.18).
Bootstrap results
The bootstrap results of the extended mental health network indicated a bit less stability compared to the basic mental health networks. Several edge-weights were included less than 500 times in the bootstraps, such as GPP to EAT (n = 357), PWB to EWB (n = 376), SHA to PWB (n = 440) in the temporal network, and EWB by SHA (n = 211), PWB by WEI (n = 384), WEI by GPP (n = 458) in the contemporaneous, and GPP by RES (n = 478) in the between-subjects network. However, the final model did not seem to miss highly relevant edge-weights. Only GPP by SHA was selected relatively frequently in the bootstraps (n = 520) while not included in the final model of the between-subjects network. Overall, this network needs to be interpreted more cautiously.
Discussion
We used a novel network analysis approach with panel data to model mental health interactions during ED outpatient treatment. A model was first examined with the following main domains of mental health in a network; eating disorder psychopathology (EDP), general psychopathology (GPP), emotional (EWB), psychological (PWB) and social well-being (SWB). Then, a more detailed model was explored in a second step, including the following subdomains of EDP; eating concern (EAT), dietary restraint (RES), shape concern (SHA) and weight concern (WEI). For both models, average within-person (temporal and contemporaneous) and between-person effects were estimated. The associations between, as well as the centrality of, the domains, were assessed. Additionally, in the temporal networks, autoregressive and cross-lagged predictive effects (i.e. the direction of the associations) were examined.
Mental Health Networks
Average within-person effects on the temporal level showed significant weak to medium predictive effects between the mental health domains. However, there may be individual differences in temporal associations between the domains. Also, since this is the first study to explore networks in panel data, no comparisons can be made with other ED studies. EDP was the most central domain in terms of predictive effects towards other domains over one year of treatment, followed by GPP. Improvements in EDP (decreasing severity) led to minor improvements in GPP and the well-being domains, while there were no effects from the other domains towards EDP. Weak to medium (bi-directional) effects were found between the other domains. Considering the high out-strength and low in-strength for EDP over a year of treatment, EDP changes appear not to require changes in other mental health domains during outpatient treatment first. More so, improvements in EDP in the short term led to further improvements in EDP in the longer term (i.e. strong autoregressive effects). These autoregressive effects were also present in the other domains but to a lesser extent. The moderately strong autoregressive effect of EDP corresponds with research indicating the importance of early symptom improvement in treatment (Nazar et al., Citation2017).
PWB was the most influential domain in the contemporaneous and between-subjects networks, while EDP had the lowest centrality of all domains in these networks. The contemporaneous network suggests that PWB plays a stable and essential role in experiencing mental health within time points after controlling for temporal effects. These seemingly contradictory results may be explained in several ways. Reliable change in well-being was only detected in a small group, and a substantial portion of patients reported adequate well-being. When there is no substantial average change, predictive associations may not be detected over time. This may have to do with the content of treatment, which may have been primarily focused on changing EDP. Another explanation could be that well-being dimensions are more stable aspects of mental health over time. In explaining concepts of positive mental health, Marie Jahoda (Citation1958) noted that mental well-being should either be considered a relatively constant and enduring function of personality or a momentary function of personality and environment (Jahoda, Citation1958). Well-being has been strongly linked to personality trait facets in the general population (Anglim et al., Citation2020) and recently in patients with EDs (Vos, et al., Citation2021). In addition, a longitudinal study examining interactions between personality problems, GPP and EDP over a two-year follow-up after ED inpatient treatment (Rø et al., Citation2005) found that personality changes were only detected at the two-year time point and were not apparent in the first follow-up year. It was also found that ED symptom changes preceded personality changes. When considering well-being as a more stable function of mental health, these results correspond well with the findings of our study. However, it has been found that mental well-being can be changed in clinical samples with interventions (Chakhssi et al., Citation2018) and investigating interventions in ED samples is warranted. In addition, personality trait facets may help in maintaining a stable mental well-being. Personality presents in individuals as stable habitual patterns and changes are often considered a complicated process, although it can be changed with interventions, and it does change across the lifespan (Anglim et al., Citation2020). Our findings suggest that it is warranted to promote well-being, particularly psychological well-being in ED patients, to sustain overall mental health.
Extended Mental Health Networks
The extended mental health networks depict how the specific ED domains were related to other domains and interrelated over time. Temporal pathways from EDP to the well-being domains were weak and primarily found for dietary restraint and eating concern. Also, they both predicted changes in shape and weight concern with medium to strong effect sizes. The cognitive maintenance model on which CBT-E is based provides hypotheses on the likely mechanism of change (Fairburn et al., Citation2003). A dysfunctional self-evaluative system is considered the core psychopathology of EDs, where self-worth is based on weight and shape concerns. Being overly concerned with weight and shape is hypothesized to maintain dietary restraint and eating concern. This leads to distorted eating habits, such as bingeing, compensatory behaviours or restricting, which further leads to increased concerns about weight and shape, resulting in a self-perpetuating cycle (Fairburn et al., Citation2003). Our study suggests that changes in dietary restraint and eating concerns precede changes in shape and weight concern, which may be important to break through the self-perpetuating cycle. Cross-sectional ED symptom network studies have consistently reported shape and weight concern, among other symptoms, as central nodes (Elliott et al., Citation2020), corresponding with our contemporaneous and between-subjects network results. This study adds that changes in these domains are predicted by dietary restraint and eating concern within patients. However, shape and weight concern had higher strength centrality in the extended contemporaneous and between-subjects networks than PWB. The high correlations between both primarily cause this.
The dual continua model proposes that psychopathology and well-being are two distinct but related aspects of mental health (Keyes, Citation2005). The weak effects between EDP and well-being in the contemporaneous and between-subjects network correspond with earlier work examining associations in a cross-sectional network study (de Vos et al., Citation2021). The networks in this study show two distinct clusters, a cluster with well-being domains, including GPP and a cluster with the EDP subdomains. This suggests that GPP may be more strongly related to well-being, while specific ED psychopathology seems to form a distinct cluster, which appears to change independently over time. In a study examining the dual-continua model, associations between GPP and well-being were higher in clinical samples, such as patients with depression, anxiety, and personality disorders, compared to the general population (Franken et al., Citation2018). Considering the dual-continua model for treatment, a primary focus on EDP and separately on promoting well-being and alleviating GPP seems to be warranted. Alternatively, a sequential treatment approach may be investigated. For instance, the effectiveness could be examined to apply well-being-focused interventions after EDP has improved or when patients do not improve on symptoms during regular treatment. Treating EDP before focusing on other mental health aspects or underlying issues, such as personality functioning has been substantiated before (Jansen, Citation2006). A combined or sequential treatment is also in line with a recent model for sustainable mental health that postulates that mental illness and mental well-being are equally vital outcomes of mental health care (Bohlmeijer & Westerhof, Citation2020).
Strengths and Limitations
The strengths of this study were the large number of patients consistently measured over a year of outpatient treatment, the novel method of analysis providing detailed insight about symptom-to-symptom associations over time and the relatively low systemic dropout. There are, however, several limitations that should be addressed. The EDE-Q measures how many times patients experience specific ED cognitions and behaviour in the last 28 days. On the other hand, the MHC-SF measures how people feel in general about certain statements in the last month. These statements are arguably more abstract, and the MHC-SF may therefore not be as responsive to detect differences as the EDE-Q. Entering more abstract and stable aspects of mental health together with specific psychopathological symptoms in a single network may have led to biases in measurement and subsequently detecting (temporal) associations. We did not test for measurement error by including a measurement model in the network analyses as suggested by Epskamp (Citation2020). Also, the assumptions underlying centrality indices in psychometric networks are debated, and some authors consider centrality unsuitable as a measure of node importance (Bringmann et al., Citation2019). Therefore, we have chosen to use the Strength centrality measure, given that this measure is considered most appropriate in psychological networks with both positive and negative edges (i.e. edges between well-being and psychological symptoms) compared to betweenness and closeness centrality (Bringmann et al., Citation2019). Although our fit indices indicate that the assumption of stationarity is met, we did find change over time and stationarity is unlikely to hold in practice according to Epskamp (Citation2020). There are urrently no clear guideliness for how to proceed in panel data network analysis when the assumption of stationarity is violated (Epskamp, Citation2020).
It was unclear how treatment has influenced the results and how domain interactions over time would have presented with different treatments or in a natural course. We consider symptom-to-symptom effects as predictive effects over time, also termed as Granger causality applied in time-series (Epskamp et al., Citation2018). However, Granger causality does not necessarily address true causality or a predictive effect in the meaning that a change in one domain can be used as a proof of causation of change in another domain. Although we assume that a temporal link acts as a causal relationship, this link may also have occurred for other reasons (Epskamp et al., Citation2018). While we have identified average temporal pathways between mental health domains in ED patients, there may still be substantial variability within patients. Studies examining mental health associations with time series, such as experience sampling in individual patients, are suggested. Also, we did not test for differences in mental health associations between the specific ED types because we had insufficient power.
Conclusion and Implications
Given the novel methodology and temporal associations with weak to medium effect sizes, we conclude that EDP may change relatively independently from other mental health domains (temporal effects). PWB may be considered a stable and influential domain for experiencing mental health within time points (contemporaneous effects). These findings may have implications for understanding change during outpatient treatment. Considering the primary focus of most clinicians on addressing ED symptoms during treatment, these results indicate that changes in EDP lead to further changes in EDP and potential subsequent changes in well-being and GPP. For stable mental health, focusing on promoting mental well-being, specifically PWB and alleviating GPP may also be warranted.
Treatments for promoting psychological well-being have been developed (Bohlmeijer & Westerhof, Citation2020), but further evaluation of their impact on ED patients is recommended. Research should also focus on replicating these results and examine the variability in (temporal) associations in individual patients with time series.
Disclosure Statement
No potential conflict of interest was reported by the author(s).
Data Availability
The data that support the findings of this study are available on request from the corresponding author. The data are not publicly available due to restrictions e.g. their containing information that could compromise the privacy of research participants.
References
- Aardoom, J. J., Dingemans, A. E., Slof Op’t Landt, M. C. T., & Van Furth, E. F. (2012). Norms and discriminative validity of the eating disorder examination questionnaire (EDE-Q). Eating Behaviors, 13(4), 305–309. https://doi.org/10.1016/j.eatbeh.2012.09.002
- American Psychiatric Association. (2013). Diagnostic and statistical manual of mental disorders (DSM-5®).
- Anglim, J., Horwood, S., Smillie, L. D., Marrero, R. J., & Wood, J. K. (2020). Predicting psychological and subjective well-being from personality: A meta-analysis. Psychological Bulletin, 146(4), 279–323. https://doi.org/10.1037/bul0000226
- Bohlmeijer, E. T., & Westerhof, G. J. (2020). A new model for sustainable mental health: Integrating well-being into psychological treatment. In J. N. Kirby, & P. Gilbert (Eds.), Making an impact on mental health: The applications of psychological research. Routledge/Taylor & Francis Group.
- Borsboom, D. (2017). A network theory of mental disorders. World Psychiatry, 16(1), 5–13. https://doi.org/10.1002/wps.20375
- Bringmann, L. F., Elmer, T., & Epskamp, S. (2019). What do centrality measures measure in psychological networks? Journal of Abnormal Psychology, 136(1), 1–34.
- Chakhssi, F., Kraiss, J. T., Sommers-Spijkerman, M., & Bohlmeijer, E. T. (2018). The effect of positive psychology interventions on well-being and distress in clinical samples with psychiatric or somatic disorders: A systematic review and meta-analysis. BMC Psychiatry, 18(1), https://doi.org/10.1186/s12888-018-1739-2
- Cham, H., Reshetnyak, E., Rosenfeld, B., & Breitbart, W. (2017). Full information maximum likelihood estimation for latent variable interactions with incomplete indicators. Multivariate Behavioral Research, 52(1), 12–30. https://doi.org/10.1080/00273171.2016.1245600
- Coertjens, L., Donche, V., De Maeyer, S., Vanthournout, G., & Petegem, P. V. (2017). To what degree does the missing-data technique influence the estimated growth in learning strategies over time? A tutorial example of sensitivity analysis for longitudinal data.
- Cohen, J. (1988). Statistical power analysis for the behavioral sciences. Erlbaum.
- de Vos, J. A., Radstaak, M., Bohlmeijer, E. T., & Westerhof, G. J. (2021). The psychometric network structure of mental health in eating disorder patients. European Eating Disorders Review, 29, 559–574. https://doi.org/10.1002/erv.2832
- Elliott, H., Jones, P. J., & Schmidt, U. (2020). Central symptoms predict posttreatment outcomes and clinical impairment in anorexia nervosa: A network analysis. Clinical Psychological Science, 8(1), 139–154. https://doi.org/10.1177/2167702619865958
- Epskamp, S. (2020). Psychometric network models from time-series and panel data. Psychometrika, 85(1), 206–231. https://doi.org/10.1007/s11336-020-09697-3
- Epskamp, S. (2021). Package ‘psychonetrics.’ https://doi.org/10.31234/osf.io/8ha93.
- Epskamp, S., Rhemtulla, M., & Waldorp, L. J. (2014). Network psychometrics, 1–14.
- Epskamp, S., van Borkulo, C. D., van der Veen, D. C., Servaas, M. N., Isvoranu, A. M., Riese, H., & Cramer, A. O. J. (2018). Personalized network modeling in psychopathology: The importance of contemporaneous and temporal connections. Clinical Psychological Science, 6(3), 416–427. https://doi.org/10.1177/2167702617744325
- Fairburn, C. G., & Beglin, S. (1994). Assessment of eating disorders: Interview or self-report questionnaire? International Journal of Eating Disorders, 16(4), 363–370. https://doi.org/10.1002/1098-108X(199412)16:4<363::AID-EAT2260160405>3.0.CO;2-#
- Fairburn, C. G., Cooper, Z., & Shafran, R. (2003). Cognitive behaviour therapy for eating disorders: A “transdiagnostic” theory and treatment. Behaviour Research and Therapy, 41(5), 509–528. https://doi.org/10.1016/S0005-7967(02)00088-8
- Franken, K., Lamers, S. M. A., Ten Klooster, P. M., Bohlmeijer, E. T., & Westerhof, G. J. (2018). Validation of the mental health continuum-short form and the dual continua model of well-being and psychopathology in an adult mental health setting. Journal of Clinical Psychology, 1–16.
- Fried, E. I., van Borkulo, C. D., Cramer, A. O. J., Boschloo, L., Schoevers, R. A., & Borsboom, D. (2017). Mental disorders as networks of problems: A review of recent insights. Social Psychiatry and Psychiatric Epidemiology, 52(1), 1–10. https://doi.org/10.1007/s00127-016-1319-z
- Galmiche, M., Déchelotte, P., Lambert, G., & Tavolacci, M. P. (2019). Prevalence of eating disorders over the 2000-2018 period: A systematic literature review. The American Journal of Clinical Nutrition, 109(5), 1402–1413. https://doi.org/10.1093/ajcn/nqy342
- Grenon, R., Carlucci, S., Brugnera, A., Hammond, N., Ivanova, I., Mcquaid, N., … Tasca, G. A. (2019). Psychotherapy for eating disorders: A meta-analysis of direct comparisons. Psychotherapy Research, 29, 833–845. https://doi.org/10.1080/10503307.2018.1489162
- Hamaker, E. L. (2012). Why researchers should think “within-person”: A paradigmatic rationale. In M. R. Mehl, & T. S. Conner (Eds.), Handbook of research methods for studying daily life (pp. 43–61). Guilford Publications.
- Isvoranu, A., & Epskamp, S. (2021). Continuous and ordered categorical data in network psychometrics: Which estimation method to choose? PsyArXiv, 1–16.
- Jahoda, M. (1958). Current concepts of positive mental health. Joint commission on mental health and illness monograph series. Vol 1. Basic Books.
- Jansen, A. (2006). Eerst de eetstoornis, dan de persoonlijkheidsproblematiek? Kind En Adolescent Praktijk, 5(4), 165–168. https://doi.org/10.1007/BF03059612
- Jong, K. D., Nugter, M., Lambert, M., & Burlingame, G. (2008). Handleiding voor afname en scoring van de Outcome Questionnaire (OQ− 45.2) [Manual for administering and scoring of the Outcome Questionnaire]. Salt Lake City, UT: OQ … .
- Jordan, D. G., Winer, E. S., & Salem, T. (2020). The current status of temporal network analysis for clinical science: Considerations as the paradigm shifts? Journal of Clinical Psychology, 76(9), 1591–1612. https://doi.org/10.1002/jclp.22957
- Keski-Rahkonen, A., & Mustelin, L. (2016). Epidemiology of eating disorders in Europe: Prevalence, incidence, comorbidity, course, consequences, and risk factors. Current Opinion in Psychiatry, 29(6), 340–345. https://doi.org/10.1097/YCO.0000000000000278
- Keyes, C. L. M. (2002). The mental health continuum: From languishing to flourishing in life. Journal of Health and Social Behavior, 43(2), 207–222. https://doi.org/10.2307/3090197
- Keyes, C. L. M. (2005). Mental illness and/or mental health? Investigating axioms of the complete state model of health. Journal of Consulting and Clinical Psychology, 73(3), 539–548. https://doi.org/10.1037/0022-006X.73.3.539
- Lamers, S. M. A., Westerhof, G. J., Bohlmeijer, E. T., Ten Klooster, P. P. M., & Keyes, C. L. M. (2011). Evaluating the psychometric properties of the mental health Continuum-Short Form (MHC-SF). Journal of Clinical Psychology, 67(1), 99–110. https://doi.org/10.1002/jclp.20741
- Levinson, C. A., Zerwas, S., Calebs, B., Forbush, K., Kordy, H., Watson, H., … Bulik, C. M. (2017). The core symptoms of bulimia nervosa, anxiety, and depression: A network analysis. Journal of Abnormal Psychology, 126(3), 340–354. https://doi.org/10.1037/abn0000254
- McNally, R. J. (2016). Can network analysis transform psychopathology? Behaviour Research and Therapy, 86, 95–104. https://doi.org/10.1016/j.brat.2016.06.006
- Monteleone, A. M., Mereu, A., Cascino, G., Criscuolo, M., Maria, P. S. Y., Castiglioni, C., … Zanna, V. (2019). Re-conceptualization of anorexia nervosa psychopathology: A network analysis study in adolescents with short duration of the illness. International Journal of Eating Disorders, 52(11), 1263–1273. https://doi.org/10.1002/eat.23137
- Nazar, B. P., Gregor, L. K., Albano, G., Marchica, A., Coco, G. L., Cardi, V., & Treasure, J. (2017). Early response to treatment in eating disorders: A systematic review and a diagnostic test accuracy meta-analysis. European Eating Disorders Review, 25(1999), 67–79. https://doi.org/10.1002/erv.2495
- Orth, U., Meier, L. L., Bühler, J. L., Dapp, L. C., Krauss, S., Messerli, D., & Robins, R. W. (2022). Effect size guidelines for cross-lagged effects. Psychological Methods, Advance online publication.
- Promoting Mental Health. Concepts, Emerging Evidence, Practice. (2004). Geneva: World Health Organization.
- Rø, Ø, Martinsen, E. W., Hoffart, A., Sexton, H., & Rosenvinge, J. H. (2005). The interaction of personality disorders and eating disorders: A two-year prospective study of patients with longstanding eating disorders. International Journal of Eating Disorders, 38(2), 106–111. https://doi.org/10.1002/eat.20166
- Rosseel, Y. (2021). The Lavaan tutorial (Vol. 48).
- Shi, D., & Lee, T. (2019). Understanding the model size effect on SEM fit indices.
- Smith, K. E., Mason, T. B., Crosby, R. D., Cao, L., Leonard, R. C., Wetterneck, C. T., … Hospital, M. (2019). A comparative network analysis of eating disorder psychopathology and co-occurring depression and anxiety symptoms before and after treatment. Psychological Medicine, 49(2), 314–324. https://doi.org/10.1017/S0033291718000867
- van Hoeken, D., & Hoek, H. W. (2020). Review of the burden of eating disorders. Current Opinion in Psychiatry.
- Vos, J. A. D., Radstaak, M., Bohlmeijer, E. T., & Westerhof, G. J. (2021). Exploring associations between personality trait facets and emotional, psychological and social well – being in eating disorder patients. Eating and Weight Disorders - Studies on Anorexia, Bulimia and Obesity.
- Warmerdam, L., Barendregt, M., & de Beurs, E. (2017). Risk adjustment of self-reported clinical outcomes in Dutch mental health care. Journal of Public Health.
- Yang, X., & Shoptaw, S. (2005). Assessing missing data assumptions in longitudinal studies: An example using a smoking cessation trial. Drug and Alcohol Dependence, 77(3), 213–225. doi:10.1016/j.drugalcdep.2004.08.018