
Abstract
Objective:
To develop and validate a very brief version of the 24-item Real Relationship Inventory–Client (RRI-C) form.
Method:
Two independent samples of individual psychotherapy patients (Nsample1 = 700, Nsample2 = 434) completed the RRI-C along with other measures. Psychometric scale shortening involved exploratory factor analysis, item response theory analysis, confirmatory factor analysis (CFA), and multigroup CFA. Reliability and convergent and discriminant validity of the scale and subscales were also assessed.
Results:
The 8-item RRI-C (RRI-C-SF) preserves the two-factor structure: Genuineness (k = 4, α = .86) and Realism (k = 4, α = .87), which were correlated at r = .74. CFA provided the following fit indices for the bifactor model: X2/df = 2.16, CFI = .99, TLI = .96, RMSEA = .07, and SRMR = .03. Multigroup CFA showed that the RRI-C-SF was invariant across in-person and remote session formats. The RRI-C-SF demonstrated high reliability (α = .91); high correlation with the full-length scale (r = .96); and excellent convergent and discriminant validity with measures of other elements of the therapeutic relationship, personality characteristics, current mental health state, and demographic-clinical variables. Clinical change benchmarks were calculated to serve as valuable tools for both research and clinical practice.
Conclusion:
The RRI-C-SF is a reliable measure that can be used for both research and clinical purposes. It enables a nuanced assessment of the genuineness and the realism dimensions of the real relationship.
Clinical and Methodological Significance of this Article: This article details the development and validation of an 8-item short form of the Real Relationship Inventory–Client form which showed excellent psychometric properties, high content coverage, and strong criterion validity. The correlation between the short and full-length scores was r = .96, while that between the subscales (genuineness and realism) of the short form was r = .74. The RRI-C short form appears useful in both research and clinical settings.
The existence of a real relationship between patients and therapists as an element of the overall therapeutic relationship has been recognized since the inception of psychotherapy (Gelso, Citation2011). It is a transtheoretical phenomenon (Gelso & Silberberg, Citation2016) defined as “the personal relationship existing between two or more people as reflected in the degree to which each is genuine with the other and perceives the other in ways that befit the other” (Gelso, Citation2009, pp. 254–255). The strength of the real relationship depends on the combined magnitude (how much) and valence (from positive to negative) of its two fundamental elements: realism and genuineness. Realism refers to the degree to which one realistically experiences and perceives the other, while genuineness refers to the degree of authenticity demonstrated toward the other and the extent to which one is truly themselves (Gelso et al., Citation2012). It should be noted that genuineness encompasses the personal characteristics of each participant and the quality of the relationship between them (Gelso, Citation2009). Since the real relationship is a bipersonal phenomenon, both the patient and the therapist contribute directly and indirectly to its development and strength (Gelso, Citation2014).
Although probably all the relational elements of the therapeutic relationship (Norcross & Lambert, Citation2019) are likely linked, alliance, transference, and attachment appear to hold particular relevance for the real relationship (Gelso et al., Citation2019). The real relationship (which is a non-work connection between the patient and the therapist) and the working alliance (which is a work connection) have been theorized as separate but inarguably highly related constructs, so much so that they are considered sister concepts (Gelso & Kline, Citation2019). This was confirmed by a recent meta-analysis that estimated an overall correlation of r = .66 (Vaz et al., Citation2023). Regarding the phenomenon of transference, it is theorized and found to be modestly and negatively related to the real relationship (Bhatia & Gelso, Citation2018; Gelso, Citation2014). Regarding attachment, it is expected that patients and therapists with secure attachment and low anxiety and avoidance attachment would develop a stronger real relationship (Gelso, Citation2011; Gelso & Hayes, Citation1998). Here, it should be remembered that the patient’s attachment style is related to how they perceive their therapist (Kline et al., Citation2023).
Importantly, meta-analytic results found that the strength of the real relationship was moderately associated (r = .38) with the outcome of psychotherapy, independently of the type of outcome considered (session outcome, treatment outcome, and treatment progress) and of the informant (patient or therapist) (Gelso et al., Citation2018). This is a larger magnitude than the relationship found in recent meta-analyses for the alliance and outcome (ranging from r = .20 to .29) (Eubanks et al., Citation2018; Flückiger et al., Citation2018; Kaiser et al., Citation2021; Probst et al., Citation2019).
Empirical investigation of the real relationship has only gained significant attention in recent years, largely due to the absence of reliable measurement tools until the mid-1990s (Gelso et al., Citation2018). The initial measure in this area, introduced by Eugster and Wampold in 1996, was an 8-item patient-rated scale, but it exhibited only moderate psychometric properties (Eugster & Wampold, Citation1996; Kelley et al., Citation2010). Subsequent quantitative studies on the real relationship have almost exclusively utilized two tools developed later by Charles Gelso and colleagues: the Real Relationship Inventory–Therapist Version (RRI-T) (Gelso et al., Citation2005) and the Real Relationship Inventory–Client Version (RRI-C) (Kelley et al., Citation2010). An abbreviated 12-item version of the RRI-C was created for each inventory by selecting the items that the authors believed best represented the realism (6 items) and the genuineness (6 items) components within the longer inventories (Hill et al., Citation2014). However, the 12-item RRI-C was not developed following best practices (DeVellis & Thorpe, Citation2022; Youngstrom et al., Citation2020, Citation2021). Nor was it subject to psychometric validation. Furthermore, although the RRI-C is time-efficient, the complex nature of therapeutic processes often requires the concurrent use of multiple measures (Wampold & Flückiger, Citation2023; Wampold & Imel, Citation2015) or routine session monitoring (Barkham et al., Citation2023; Tasca et al., Citation2019). Therefore, there is a need for an even more rapid yet reliable assessment of the real relationship.
The aim of this study was to develop and initially validate a brief measure of the Real Relationship Inventory–Client Version that was psychometrically sound, in the framework of measurement based clinical care and precision psychotherapy (Martinez-Aran & Vieta, Citation2022). Exploratory factor analysis and separate item response theory analyses of the two subscales were performed to retain the best items. Confirmatory factor analysis was used to test the fit of the final model. Reliability and convergent and discriminant validity were also assessed. Lastly, clinical cut-off scores were calculated to help clinical and research practice.
Method
Data Set
This article undertakes a secondary analysis of baseline data from both a longitudinal study (Stefana et al., Citation2023) and a randomized clinical trial (Stefana et al., Citation2024). The studies were approved by the Institutional Review Board Board (IRB) of the University of North Carolina at Chapel Hill (IRB number for the longitudinal study: 23-0216, approval dated: 06 March 2023; IRB number for the trial: 23-1067, approval dated: 31 July 2023).
Participants
Samples A and B consisted of 700 and 434 adult patients, respectively, undergoing various forms of individual psychotherapy for a range of mental conditions. The majority self-identified as female (73% in Sample A; 77% in Sample B). The most represented age groups were 23–29 years (20% in Sample A; 23% in Sample B) and 30–39 years (28% in Sample A; 32% in Sample B). The predominant ethnicity was white, comprising four out of five participants (81% in Sample A; 80% in Sample B). A significant majority were diagnosed with at least one psychiatric disorder (84% in Sample A; 90% in Sample B), with anxiety (66% in Sample A; 76% in Sample B) and unipolar depression (56% in Sample A; 63% in Sample B) being the most prevalent conditions. More than half of participants attended their most recent session via video call (53% in Sample A; 55% in Sample B), followed by in-person face-to-face sessions (36% in Sample A; 34% in Sample B), telephone calls (8% in Sample A; 7% in Sample B), and in-person sessions on the couch (3% in Sample A; 4% in Sample B). provides a detailed breakdown of the demographics, clinical profiles, and treatment characteristics of the participants in both samples.
Table 1. Demographics, clinical, and treatment characteristics of participating patients.
Measures
We employed a comprehensive set of self-report measures to capture a broad spectrum of data related to individual patient attributes, the nuances of therapeutic interventions, and the dynamics of the therapeutic relationship. The “demographic and therapy domain” includes both the sociodemographic details of the patient and details about the therapeutic interventions they undergo. The “personality domain” investigates attributes related to individual personality traits. The “mental health state domain” is focused on conventional symptom measures that influence the daily lives of participants. Instruments in these three domains serve to assess discriminant validity. The “therapeutic relationship domain” shines a light on the intricacies of the patient-therapist relationship from the patient’s point of view, helping to evaluate the convergent validity. On the other hand, the measure within the “Session outcome domain” is tailored to determine predictive validity. displays the distribution of each measure between the two studies, highlighting which measures were administered in both studies and which were exclusive to one of the two.
Table 2. Measurement tools.
Demographic and therapy domain
Sociodemographic, clinical, and treatment variables
Participants completed an 11-item sociodemographic and clinical data form that recorded the information listed in .
Personality domain
The Big Five Inventory–2-Extra-Short form (BFI-2-XS) (Soto & John, Citation2017a) is a self-administered scale consisting of 15 items designed to assess personality traits at the level of the Big Five domains, with three items dedicated to each domain. Participants rate each item on a 5-point Likert scale, ranging from 1 (“Disagree strongly”) to 5 (“Agree strongly”). The BFI-2-XS retained about 80% of the Big Five Inventory–2 (Soto & John, Citation2017b) domain scales’ external validity (Soto & John, Citation2017a). In our analysis of internal consistency, α ranged from .50 for the Open-Mindedness dimension to .65 for the Conscientiousness dimension.
The Level of Personality Functioning Scale-Brief Form 2.0 (LPFS-BF 2.0) (Weekers et al., Citation2019) is a self-report inventory consisting of 12 items designed to assess the severity of personality pathology. It measures the impairment criteria for self- and interpersonal functioning set forth in the DSM-5 Section III. Participants rate each item on a 5-point Likert scale, ranging from 1 (“Completely untrue”) to 4 (“Completely true”). The LPFS-BF 2.0’s subscales demonstrated positive correlations with analogous constructs in the Severity Indices of Personality Functioning Short Form (Verheul et al., Citation2008), bolstering the construct validity of the scale. The Cronbach’s α coefficient for our sample was .85.
Mental health state domain
The International Positive and Negative Affect Schedule - Short Form (I-PANAS-SF) (Thompson, Citation2007) is a self-report measure that assesses the frequency of positive affect (5 items) and negative affect (5 items) experienced by the respondent during the past week. Respondents rate the ten emotional adjectives on a five-point Likert scale, ranging from 1 (“Very slightly or not at all”) to 5 (“Extremely”). Convergent validity and discriminant validity of the scale have been confirmed (He, Citation2023). In our sample, the Positive Affect and Negative Affects scales showed coefficients of α = .78 and .74, respectively.
The Patient Health Questionnaire-9 (PHQ-9) (Kroenke et al., Citation2001) is a self-administered scale for measuring the severity of depressive symptoms. It consists of nine items that are rated on a 4-point Likert scale, ranging from 0 (“Not at all”) to 3 (“Nearly every day”). We evaluated the depressive symptom severity over a 7-day period instead of 14 days. The PHQ-9 showed superior criterion validity for diagnosing depressive episodes compared to well-established instruments such as the Hospital Anxiety and Depression Scale and the WHO Well-Being Index 5 (Löwe et al., Citation2004). The internal consistency of this measure in our sample was α = .86.
The Generalized Anxiety Disorder-7 (GAD-7) (Spitzer et al., Citation2006) is a self-report scale of the presence and severity of generalized anxiety disorder. It consists of seven items rated from 0 (“Not at all”) to 3 (“Nearly every day”). The GAD-7 demonstrated good internal consistency and convergent validity with anxiety, stress, depression, and worry (Kertz et al., Citation2012). We assessed the patient’s health condition for the previous 7 days instead of the default 14 days. Reliability in our study was α = .88.
The Single-item global measures of symptom severity, psychosocial functioning, and quality of life (SI) consists of three single-item “scales” originally developed by Zimmerman et al. (Zimmerman et al., Citation2006). For this study, we replaced the wording “symptoms of depression” with “symptoms for which you are in psychotherapeutic treatment.” This item is rated on a 5-point Likert scale, ranging from 0 (“None”) to 4 (“Severe”). The item that assesses psychosocial functioning uses a Likert scale ranging from 0 (“Not at all”) to 4 (“Extremely”). The item on the quality of life was rated from 0 (“Very good, my life could hardly be better”) to 4 (“Very bad, my life could hardly be worse”).
Therapeutic relationship domain
The Real Relationship Inventory–Client (RRI-C) form (Kelley et al., Citation2010) is a 24-item self-report measure of the patient’s perception of the strength of the real relationship with their therapist. It comprises two subscales: Genuineness and Realism. Ratings are made on a 5-point Likert scale, ranging from 1 (“Strongly disagree”) to 5 (“Strongly agree”). The validation study found item-total correlations of .52–.74 for the genuineness items, and .51–.75 for the realism items. The study’s internal consistency was .91 for Genuineness, .90 for Realism, and .95 overall. In our internal consistency analysis, Cronbach’s α and the average item correlation for the RRI total scale were respectively .97 and .55. For the Genuineness factor, these measures were .94 and .56, and for the Realism factor, they were .93 and .53. Item-total correlations ranged .57–.85 for the 12 genuineness items, and .54–.79 for the 12 realism items. RRI-C has shown strong convergence validity with the working alliance (measured using the Working Alliance Inventory), with r = .66 between total scores (Vaz et al., Citation2023) and patient perceptions of congruence or genuineness (r = .71 with the congruence subscale score of the 64-item Barrett-Lennard Relationship Inventory) (Kelley et al., Citation2010).
The Working Alliance Inventory–Short Revised (WAI-SR) (Hatcher & Gillaspy, Citation2006) is a 12-item self-report measure that evaluates the quality of the working alliance in a therapy session. It consists of three subscales, each comprising four items, which assess: (a) agreement on the tasks of therapy, (b) agreement on the goals of therapy, and (c) the establishment of an affective bond between the patient and the therapist. Respondents rate each item on a 6-point Likert scale, ranging from 0 (“Not at all”) to 5 (“Completely”). In the current study, the WAI-SR total scale obtained Cronbach’s α of .95. The WAI-SR has shown good convergent validity (r = .71) with the Helping Alliance Questionnaire for correlation between total scores (Munder et al., Citation2009).
The in-Session Patient Affective Reactions Questionnaire (SPARQ) (Stefana et al., Citation2023; Stefana et al., Citation2024) is an 8-item self-report measure of the patient’s in-session perceptions of and affective reactions toward their therapist during the session. It comprises two distinct 4-item scales that result in two separate, non-summable scores. The Positive Affect scale captures the patient’s perception of a secure and comfortable therapeutic relationship, whereas the Negative Affect scale is characterized by items describing feelings of shame, shyness, fear of speaking openly, worry about not receiving adequate help, and a sense of failure stemming from the need for help from the therapist. Items are rated on a 5-point Likert scale, ranging from 0 (“Not at all true”) to 4 (“Very true”). In the current study, the SPARQ showed Cronbach’s α coefficients of .86 for the Positive Affect scale and .75 for the Negative Affect scale. The Positive Affect scale has shown good convergent validity with the goal (r = .68), task (r = .67), and bond (r = .83) subscales of the WAI-SR, as well as with the RRI-C (r = .56). Similarly, the Negative Affect scale has demonstrated good convergent validity with the goal (r = −.42), task (r = −.44), and bond (r = −.46) subscales of the WAI-SR, as well as with the RRI-C (r = −.44).
The section B of the Post-Session Questionnaire (PSQ) (Samstag et al., Citation1998) is a 4-single-item self-report measure that assesses alliance ruptures and rupture resolution during a therapy session. The first item is a gate-keeping item that investigates the occurrence (“No” or “Yes”) of any in-session conflict, misunderstanding, disagreement, or tension in the relationship with the therapist from the patient’s perspective. In case of an affirmative answer, the further three items evaluating the highest degree of tension experienced (from 1 = “Low” to 5 = “High”), the extent to which the problem was addressed by the end of the session (from 1 = “Not at all” to 5 = “Very much”), and the degree to which the problem was resolved (from the patient’s perspective) by the end of the session (from 1 = “Not at all” to 5 = “Very much”) are administered. Lower intensity of rupture and higher resolution of rupture have been found to be associated with better ratings of the working alliance (12-item WAI) and session quality (Session Evaluation Questionnaire) (Muran et al., Citation2009).
The Rift In-Session Questionnaire (RISQ) (Stefana et al., Citation2023) is a 4-item patient-report measure that assesses the risk of rifts in the therapeutic relationship. The items assess the patient’s in-session experiences with their therapist, focusing on: feelings of being disparaged, rejected, or provoked, and fear or unease about potential emotional harm. Respondents indicate whether they experienced each of these feelings by responding with a “Yes” or “No” to each item. Higher scores indicate a higher risk of rifts in the patient–therapist relationship. Cronbach’s α was .67 in our sample.
Session outcome domain
The Session Evaluation Scale (SES) (Hill & Kellems, Citation2002; Lent et al., Citation2006) is a 5-item self-report scale that aims to evaluate the patient’s perception of the quality of therapy sessions, which is a crucial component of session outcomes. Four of the items are rated on a 5-point Likert scale, ranging from 1 (“Strongly disagree”) to 5 (“Strongly agree”). The fifth item is rated on a 4-point scale, ranging from 1 (“Very effective”) to 5 (“Ineffective”). To obtain the SES score, the values of the five items are summed (with appropriate reversals applied where indicated) and then divided by five. In our study, the SES demonstrated a reliability coefficient of α = .86.
Statistical Analyses
Short-form scale development and validation followed best practices (DeVellis & Thorpe, Citation2022; Youngstrom et al., Citation2020). The development and validation process integrated statistical analyses of data from two distinct studies (see the Procedure section for details). In the initial study, Sample A was assessed using the 24-item RRI-C. These data facilitated the extraction of factors, the identification of optimal items, and the evaluation of the RRI-C reliability, validity, and score accuracy. Subsequently, the second study focused exclusively on an 8-item subset, derived from the previous analyses with Sample A. This subset was used to assess dimensionality and reliability, as well as to investigate measurement invariance.
The Kaiser-Meyer-Olkin test and Bartlett’s test of sphericity were employed to assess the suitability of the data for factor analysis. Exploratory factor analysis (EFA) was performed on sample A using the R package EFAtools v0.4.1 (Steiner & Grieder, Citation2020) and a Promax rotation to analyze a matrix of inter-item polychoric correlations. Promax rotation begins with an orthogonal solution, which it subsequently transforms into an oblique solution, lending it greater robustness as it produces simple structure (Irwing et al., Citation2018). Items with factor loading < .40 and those ≥ .40 on two factors were removed (Hair et al., Citation2022; Reinard, Citation2006). Confirmatory factor analysis (CFA) was employed to assess the unidimensionality of the latent variable within each of the two RRI-C subscales separately, as the item response theory (IRT) approach we intended to use necessitates unidimensional latent variables (de Ayala, Citation2022). IRT graded response model (GRM) was applied on sample A using the R package mirt v1.36.1 (Chalmers, Citation2012) to estimate the parameters of item discrimination (a) and difficulty (b). Items with very high information (a > 1.70; (Baker & Kim, Citation2017)) across a wide range of theta (θ) levels were selected. Confirmatory factor analysis was conducted on sample B using the R package lavaan v0.6-11 (Rosseel, Citation2012) to evaluate the fit of the final factor solution, and k-fold cross-validation using the R package kfa v0.2.0 (Nickodem & Halpin, Citation2022) to verify the robustness of our final model. As indicated in the literature (Hoyle, Citation2023; Hu & Bentler, Citation1999), the following criteria were adopted as guidelines for assessing the overall fit of the model: a minimum of .95 for the Comparative Fit Index (CFI) and the Tucker-Lewis Index (TLI), a maximum of .06 for the root mean square error of approximation (RMSEA), and a maximum of .08 for the standardized root mean square residual (SRMR). Multi-group CFA was conducted on pooled samples (A + B) to examine the measurement invariance of the short form of the RRI across patients attending psychotherapy sessions in different formats, specifically in-person (both face-to-face and on the couch) versus remote (both video and telephone calls). Methodologies proposed by Smith et al. (Smith et al., Citation2000) were implemented to predict potential values for Cronbach’s alpha and content scope. Average item correlation and was used as primary measure of internal consistency that is not reliant on the length of the scale (Streiner et al., Citation2015) and both McDonald’s total omega (ω) and Cronbach’s alpha were used as supplemental estimates. Additionally, marginal reliability was estimated across various θ levels using IRT (Feuerstahler et al., Citation2020). Reliability statistics for the short form of the scale were estimated using raw items and 1000 bootstrapped replications (Revelle & Condon, Citation2019). Bland–Altman plots (Bland & Altman, Citation1986) were employed to assess the accuracy of scores derived from the short form in comparison to the full 24-item version. These plots offer an evaluation of score bias and provide “limits of agreement.” Correlations between the short-form scale and patient demographic-clinical features, as well as validated measures of personality characteristics, current mental health state, specific elements of the therapeutic relationship, provided information about the criterion validity. Cohen’s q (Cohen, Citation1992) was used as operationalization for meaningful difference in correlations (Youngstrom et al., Citation2019).
Procedure
Participants in Sample A were recruited from March to April 2023, whereas recruitment for Sample B took place from September to November 2023. In both cases, participants were enlisted through two online patient registers: Research for Me and ResearchMatch (Harris et al., Citation2012). Research for Me (> 24k registered volunteers) is a resource created by the North Carolina Translational and Clinical Sciences (NC TraCS) Institute, the integrated home of the United States National Institutes of Health as part of the Clinical and Translational Science Awards (CTSA) Program at the University of North Carolina at Chapel Hill. ResearchMatch (> 158k registered volunteers) was created by a network of major academic institutions and is supported by the United States National Institutes of Health as part of the CTSA Program. Studies suggest that individuals sourced from online research platforms consistently self-report demographic and psychological data accurately, especially when no financial incentives promote deception (Chandler & Shapiro, Citation2016). Evidence indicates that compared to peer recruitment, participants from ResearchMatch are more likely to complete the study (Faro et al., Citation2021). To qualify, participants had to be adults 18 years or older, undergoing individual psychotherapeutic treatment. They also needed to be fluent in English and capable of providing informed consent. Only for the randomized control trial (i.e., sample B), participants were also required to have a minimum therapy frequency of two sessions per month. After consenting, the participants underwent a baseline evaluation that assessed their most recent therapy session and the previous week’s experiences. The surveys were conducted using Qualtrics software.
Results
Preliminary Analyses
The Kaiser–Meyer–Olkin test (.98 for sample A; .90 for sample B) and the Bartlett test of sphericity (X2(276) = 13392, p < .001 for sample A; X2(28) = 1611, p < .001 for sample B) supported the suitability of our data for factor analysis.
Exploratory Factor Analysis
Working with the assumption of two theoretically derived dimensions of the RRI-C-SF, we performed EFA on sample A extracting two correlated factors. After the removal of items that cross-loaded or demonstrated higher loadings on non-hypothesized factors than on the hypothesized ones, the Genuineness factor retained 7 items, and the Realism factor retained 6 items. Items had good to strong loadings on the respective factor: smallest loadings were .54 and .56 respectively for factor 1 (Genuineness) and factor 2 (Realism); while median loadings were .83 and .68. The items on both the factors showed good item distributions. Item-level EFA results, including all item loadings’ coefficients, are reported in Supplementary Online Table 1.
It should be noted that parallel analysis with principal component analysis (PCA) of Pearson correlation matrices suggested retaining two factors. Parallel analysis with PCA has been demonstrated to accurately assess a dataset’s dimensionality (Debelak & Tran, Citation2016), particularly for polytomous data (Christensen et al., Citation2023).
Unidimensionality of the Subscales
CFAs were conducted on the Genuineness and Realism subscales of the RRI-C after the cross-loading items and those loadings on the non-hypothesized factor were deleted. The results for both subscales suggested that a one-factor model provided an acceptable fit. For the Genuineness factor: CFI = .96, TLI = .94, RMSEA = .11, SRMR = .03; for the Realism factor: CFI = .99 TLI = .98, RMSEA = .06, SRMR = .02. These results indicated that both scales were underpinned by a single latent variable, making them appropriate for IRT analysis.
Item Response Theory
The two factors of the RRI-C were individually examined using the GRM IRT to obtain discrimination and difficulty parameters for each item (see Supplementary Online Table 2). For the short form of the RRI-C, four items per subscale having very high discrimination ability across a wide range of θ levels were selected: items 1, 4, 7, 11 for Realism and items 5, 9, 13, 20 for Genuineness. shows the values of the discrimination and difficulty parameters for the final Genuineness and Realism subscales based on sample A. IRT analysis shows that the RRI is very effective in measuring differences in the Genuineness and Realism traits among participants. Every question in the RRI does an excellent job of distinguishing people with varying degrees of these traits. Additionally, the RRI can evaluate people with a wide range of trait levels – from those with low levels to those with high levels of Genuineness and Realism. This means that the RRI is versatile and confirms its reliability in measuring these traits. Supplementary Online Figure 1 shows item option characteristic curves for the scale scores.
Table 3. Item option characteristics for the Genuineness and Realism factors based on IRT models.
Confirmatory Factor Analysis
One-, two-, and bi-factor models were tested in sample B. The one-factor model showed the poorest results: X2(20) = 150.79; CFI = .92; TLI = .89; RMSEA = .12 (90% CI [.11, .14]); and SRMR = .06. The two-factor model of the RRI-C-SF showed a good fit for the data: X2(19) = 82.75, CFI = .96, TLI = .94, RMSEA = .09 (90% CI [.07, .11]), and SRMR = .04. Lastly, the bi-factor model showed excellent fit indices: X2(12) = 32.67, CFI = .99, TLI = .97, RMSEA = .06 (90% CI [.04, .09]), and SRMR = .02. Furthermore, a k-fold cross-validation setting k = 2 was carried out to test the robustness of the bi-factor model and produced the following indices of fit: X2(9) = 19.40, CFI = .99, TLI = .96, RMSEA = .07 (90% CI [.07, .07]), and SRMR = .03. Supplementary Online Figure 2 shows the measurement model that presents a fully standardized solution using robust maximum likelihood estimation.
Invariance Testing with Multigroup CFA
To evaluate the measurement invariance of the 8-item RRI-C across patients attending in-person (either face-to-face or on the couch) and remote (via video or telephone call) sessions, multigroup CFA models were applied using pooled samples (sample A + sample B). A model with no equality constraints across groups showed good model fit (X2(38) = 105.40, CFI = 1.00, TLI = 1.00, RMSEA = 0.06, SRMR = .03). Equating the loadings, item intercepts, and item thresholds did not significantly harm model fit (ΔX2(28) = 20.3, p = .85), providing evidence of metric invariance across the remote and in-person settings for the RRI-C-SF.
Internal Consistency and Reliability
We applied Smith’s formula (Smith et al., Citation2000), which enables the projection of probable Cronbach’s alpha values for short forms, to data from Sample A, consisting of participants who completed the 24-item RRI-C. The expected values were .91 for the total scale, .84 for the Genuineness subscale, and .82 for the Realism subscale. These projections were surpassed by the observed values, with Cronbach’s alpha reaching .92 for the total scale, .87 for the Genuineness subscale, and .86 for the Realism subscale.
Additionally, we used pooled samples to estimate the following internal consistency and reliability coefficients. The reliability of the total scale (k = 8) was McDonald’s omega total = .92, Cronbach’s alpha = .91, and average inter-item r = .56. Regarding the subscales, McDonald’s omega total and Cronbach’s alpha were, respectively, .86 and .86 for Genuineness (k = 4), and .87 and .87 for Realism (k = 4). Average inter-item r was .60 for Genuineness and .62 for Realism.
The 8-item RRI-C showed reliability > .80 from theta of −3.3 to +1.2, indicating that the scale items consistently measured the latent trait well even at low levels of the latent variable range. The Genuineness subscale demonstrated reliability > .80 from theta of −3.0 to +1.1, whereas the Realism subscale exhibited reliability > .80 from theta of −2.8 to +0.6.
Score Precision
The RRI-C-SF total score was 32.5 (SD = 6.20). reports the Standard Errors of Measurement (SEm) and the Difference (SEd), informing us about the score deviation due to measurement error, the critical change for both 90% and 95% confidence levels, offering insight into the threshold for significant change beyond measurement error, the minimally important difference (MID), indicating the smallest score change perceived as beneficial, and the Jacobson benchmark threshold (Jacobson & Truax, Citation1991) to identify statistically reliable changes. Supplementary online Figure 3 presents histograms for each item, depicting the distribution across each level of the Likert scale.
Table 4. Descriptive statistics, precision, and inter-scale correlations.
Retained Content Coverage
We applied Smith’s formula (Smith et al., Citation2000) to calculate the expected correlations (Smith et al., Citation2000) between the RRI short form (k = 8) and the full-length version (k = 24) using sample A. The expected correlations were r = .89 for the total scale, r = .79 for the Genuineness subscale, and r = .76 for the Realism subscale. The observed correlations between the short version and the full version scores of the RRI-C were r = .96 for the total scale, .93 for the Genuineness subscale, and .93 for the Realism subscale, all better than projected. The correlation between the two subscales of the short version was .75 versus .93 for the two scales based on the full-length item set.
Additionally, using pooled samples, we analyzed the correlation between the 8-item total scale and the Genuineness subscale (r = .94), as well as the Realism subscale (r = .93). Furthermore, the correlation between the Genuineness and Realism subscales was found to be r = .74.
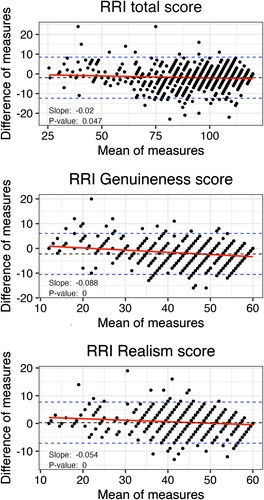
Agreement and Bias
Bland–Altman regressions and plots (see ) evaluated the agreement between the short and long forms of the scales in sample A. The short forms were pro-rated to have the same scale as the full length (e.g., potential scores of 24–120 for the full length, and 12–60 for the subscales). When scaled similarly, the total score showed an average discrepancy of 1.95 points higher using the full item set, with a statistically significant but clinically negligible slope of .02, p = .047. Within the range where most participants’ scores fell, the discrepancy was close to zero. The full item set had a tendency to produce higher scores at the very bottom of the possible range. The pattern was similar, with average discrepancies of 2.2 and .3 points, and slopes of −.09 and −.05 (both p < .001) for Genuineness and Realism, respectively. All results indicate a high degree of agreement and little evidence of bias between the short and full-length versions.
Figure 1. Bland-Altman Plots comparing accuracy of short and full-length version of Real Relationship Inventory–Client form. Note. Data based on sample A. The difference of measures is computed by subtracting the scaled-up score of the shortened scale from the score of the full-length scale, where a positive difference indicates that the full-length scale has a higher score, and a negative difference suggests the opposite.
Associations Between Scale Scores and Sociodemographic, Clinical, and Treatment Variables
As detailed in , the RRI-C-SF score showed very weak correlations (rs ranging from −.08 to .18) with all the demographic, clinical, and treatment variables listed in , when the data from samples A and B were combined.
Table 5. Criterion-related and construct validity correlations.
Supplementary Online Table 3 reports all the correlation coefficients calculated for the total scale and the subscales in sample A. Steiger’s test of dependent correlations found no differences between the correlations based on the 8-item versus 24-item versions, all p > .05.
Criterion Validity
The short form of the scale was very weakly correlated with all the measures of patients’ and current mental health state (GAD-7 and PHQ-9), while it was moderately correlated with other measures of elements of the therapeutic relationship (SPARQ and WAI-SR). Furthermore, it was moderately correlated with the session outcome (SES). provides estimates of the correlations.
Supplementary Online Table 5 shows all the correlation coefficients calculated for the total scale and the subscales in sample A. The 8-item RRI score demonstrated very weak correlations with all measures related to patients’ personality characteristics (BFI-2-XS and LPFS-BF 2.0) and their current mental health state (PHQ-9, GAD-7, I-PANAS-SF, and three single-item scales). Conversely, it showed moderate correlations with other metrics assessing elements of the therapeutic relationship, including the WAI-SR, SPARQ, and PSQ items that evaluate the extent to which problems experienced in a session were addressed and resolved within the same session. Lastly, it was moderately correlated with the SES score. Again, Steiger’s test found no significant differences between correlations based on the 8-item versus 24-item RRI-C total scales.
Item Sequencing
The items with the highest factor loading on the respective subscale (Item 1 for Genuineness, Item 2 for Realism) were placed at the beginning of the scale. The order of the remaining six items was then randomized.
Discussion
Previous research has consistently highlighted the Real Relationship Inventory–Client (RRI-C) form as a reliable and valid questionnaire used especially for research purposes. However, a shorter scale is needed to enhance its routine use in real-world psychotherapeutic settings, requiring rapid and multiple administrations. The present study aimed to develop a short form of the RRI-C. We used factor analyses and item response theory to select the items with the highest loadings on the theorized factor (and no cross-loadings) and with optimal difficulty and discrimination parameters. The resulting 8-item Real Relationship Inventory–Client Short Form (RRI-C-SF) demonstrated sound reliability and internal consistency. Importantly, the almost perfect correlation between the original full-scale and the new short-scale, and the lack of any significant differences in the criterion correlations, underscore the shortened version as a highly suitable alternative to the longer original. The correlation coefficients between the short version and the full version scores and subscores of the RRI-C were notably higher than projected, lending support to the validity of the short form. Bland–Altman plots and regressions revealed a high degree of agreement between the short and full-length versions, with minimal evidence of bias. The tendency for the full item set to produce higher scores at the very bottom of the possible range have negligible clinical implications. It is also noteworthy that the short form of the scale showed a similar pattern of correlations with demographic, clinical, and treatment variables compared to the full-length version.
Additionally, we calculated clinical change benchmarks for the 8-item version, strengthening its utility in clinical practice. Very weak to weak correlations between the RRI-C-SF and the demographic, clinical, and treatment variables of the patients, in addition to moderate to strong correlations between the RRI-C-SF and other relevant measures of elements of the therapeutic relationship, demonstrated sound criterion validity. Furthermore, this set of correlations overall support the assumption that the RRI-C-SF assesses dimensions that are specific to the therapeutic relationship and not heavily affected by clinical features of the patient or extra-therapeutic factors. Furthermore, the good sample size (Comrey & Lee, Citation2013) employed in our study is a notable strength.
As expected, the RRI-C-SF demonstrated a moderate correlation with its sister concept of working alliance (Gelso & Kline, Citation2019), similar to the results of a meta-analysis (16 studies, total N = 1119, versus the current study N = 1134) (Vaz et al., Citation2023). The bond dimension of the WAI-SR was not more highly correlated with the real relationship than the other two dimensions, which is in contrast to some studies (Kelley et al., Citation2010) but in agreement with others (Alessi et al., Citation2019). However, the realism dimension of the RRI-C-SF was more highly correlated with each of the three dimensions of the WAI-SR, as well as with the SPARQ positive affective reactions toward the therapist, than was the genuineness dimension. Furthermore, as expected, the RRI-C-SF showed a moderate and negative correlation with the SPARQ Negative Affect scale, which from a theoretical point of view may be seen as partially overlapping with the concept of negative transference. The observed weak and negative correlations between the RRI-C-SF and measures of alliance ruptures (SPQ) and rifts in the therapeutic relationship (RISQ), along with the medium-strength correlations between the RRI-C-SF and the degree of tension felt during the session (negatively correlated) and the extent to which the session addressed the problem (positively correlated), suggest that a strong real relationship may serve as a protective factor against distress in therapeutic relationships. Genuineness and realism appear to have similar contributions to this process.
Genuineness and realism are distinct but closely intertwined dimensions of the therapeutic relationship (Gelso, Citation2009, Citation2011). In clinical terms, this means that therapists who are more genuine are likely to be more realistic in their perceptions of their clients, and vice versa. Such a situation poses the challenge of designing/selecting items that precisely measure only one dimension while avoiding overlap with the other. The very high correlation between genuineness and realism observed in the full version of the RRI-C indicated that some items captured shared variance rather than exclusively representing one of the two dimensions, whereas the significantly lower correlation observed in RRI-C-SF suggests that the retained items more effectively discriminate between genuineness and realism. This is a favorable outcome as it allows for a more nuanced assessment of these two dimensions of the therapeutic relationship. These findings suggest that the short form is more capable of assessing a distilled or purified measure of the dimensions of genuineness and realism, while they did not show large differences in their criterion correlations with the demographic and clinical variables included here. Significantly, our results reveal that a bifactor model, which includes one general factor affecting all scale items plus additional specific factors for each dimension, yields superior fit indices compared to a two-factor model. In this context, the bifactor model suggests that the RRI-C-SF total score reflects the overall concept of the real relationship, with the Realism and Genuineness factors representing distinct yet interconnected aspects of this broader concept. This outcome corroborates the theoretical foundations laid out by the creators of the scale (Kelley et al., Citation2010), highlighting the utility of a bi-factor model in capturing the nuanced interplay between Genuineness and Realism dimensions. This contrasts with a two-factor model, where genuineness and realism would be viewed as separate, correlated constructs, each measured independently, without a unifying overarching factor connecting them.
Crucially, our results demonstrate invariance in the RRI-C-SF across in-person and remote settings. This suggests that the RRI-C-SF consistently measures the real relationship construct in both contexts. Consequently, the RRI-C-SF emerges as a valuable instrument for exploring and comparing the dynamics of the real relationship in telepsychotherapy and traditional in-person psychotherapy. This finding gains particular significance considering the rapid evolution of teletherapy from an adjunct to a standard form of treatment over the past few decades (Pierce et al., Citation2020, Citation2021), a trend further accelerated by the recent COVID-19 pandemic (Cena et al., Citation2021; Stefana et al., Citation2020).
Meta-analytic findings indicate that the real relationship has a moderate association with both session and treatment outcomes (Gelso et al., Citation2018) and is at least as good a predictor as the working alliance (Vaz et al., Citation2023). It is important to regularly monitor the perspective of patients on the real relationship with their therapist to provide them with customized interventions to improve the quality of the therapeutic relationship and thus the outcomes. The 8-item versions of the RRI-C serves as a brief measurement tool primarily suited for research purposes. Additionally, it offers an opportunity for regular patient assessment and can also be integrated into systematic client feedback systems.
Strengths, Limitations, and Future Directions
The study had several strengths. First, the participants were drawn from two large, independent clinical samples. In the second sample, participants completed the 8-item version of the RRI-C, ensuring consistent results without the influence of surrounding items. The RRI-C-SF demonstrates excellent psychometric properties. It can be completed in less than two minutes and is straightforward to score. Furthermore, the development of the RRI-C-SF adhered to best practices and incorporated a blend of traditional and modern test theories.
Although the short version of the RRI-C has achieved our main goals, the study is not free from limitations. The main limitation is the possible cultural variation in the characteristics of the real relationship (Qureshi & Collazos, Citation2011), which limits the generalizability of the results. To enhance and deepen our understanding of whether and how cultural factors moderate or mediate the unfolding of the real relationship, future research should include diverse cultural groups and explore the extent of cultural variation in genuineness and realism. A second limitation concerns the fact that while we provided valuable analyses for potential longitudinal use of the RRI-C-SF, such as MID and RCI values, our study is cross-sectional. Consequently, conclusions about variability between-subjects versus between-timepoints cannot be drawn from these data. Ensuring test-retest stability in future studies is crucial for accurately understanding change over time. Future longitudinal studies should also explore how the real relationship and its processes unfold over the course of psychotherapy and predict different trajectories and outcomes. Despite its limitations, this study marks a significant advance in developing a faster yet reliable scale to assess the real relationship between patient and therapist in both research and clinical settings.
Conclusion
This study has successfully developed shortened versions of the RRI-C, the most widely used self-report measure of the quality of the real relationship from the perspective of the patient. The abbreviated form, composed of eight items, offers a significant reduction in length compared to the original 24-item scale. The RRI-C-SF presents valuable options for both research and clinical purposes. This concise version is especially advantageous in real-world therapeutic settings. Moreover, it enables researchers to better distinguish between the genuineness and the realism dimensions of the real relationship.
Real Relationship Inventory–Client–Short Form (RRI-C-SF)
Please complete the items below in terms of your relationship with your therapist.
Genuineness items: 1, 5, 7, and 8. Realism: 2, 3, 4, and 6.
Author Note
This study was not preregistered.
Both the data and the analysis code that support the findings of this study are available from the corresponding author upon reasonable request.
Author Contribution Statement
Conceptualization: AS. Formal analysis: AS. Supervision: EAY, CJG, PFP, and EV. Writing—original draft: AS. Writing—review and editing: all authors.
Dr. Eric Youngstrom has received royalties from the American Psychological Association and Guilford Press, and consulted about psychological assessment with Signant Health. He is the co-founder and Executive Director of Helping Give Away Psychological Science (HGAPS.org).
Dr. Eduard Vieta has received grants and served as consultant, advisor or CME speaker for the following entities: AB-Biotics, AbbVie, Adamed, Angelini, Biogen, Biohaven, Boehringer-Ingelheim, Celon Pharma, Compass, Dainippon Sumitomo Pharma, Ethypharm, Ferrer, Gedeon Richter, GH Research, Glaxo-Smith Kline, HMNC, Idorsia, Johnson & Johnson, Lundbeck, Medincell, Merck, Newron, Novartis, Orion Corporation, Organon, Otsuka, Roche, Rovi, Sage, Sanofi-Aventis, Sunovion, Takeda, and Viatris, outside the submitted work.
tpsr-2023-0341-File001_Supplementary
Download MS Word (996.1 KB)Disclosure Statement
None of the authors have conflicts to disclose with the topic of the paper. Youngstrom and Vieta prefer to err on the side of “over-disclosure” of potential COIs, and these are noted in the author contribution statement, based on guidance from the editorial office.
Supplemental data
Supplemental data for this article can be accessed here https://doi.org/10.1080/10503307.2024.2320331.
Additional information
Funding
References
- Alessi, E. J., Dillon, F. R., & Van Der Horn, R. (2019). The therapeutic relationship mediates the association between affirmative practice and psychological well-being among lesbian, gay, bisexual, and queer clients. Psychotherapy, 56(2), 229–240. https://doi.org/10.1037/pst0000210
- Baker, F. B., & Kim, S.-H. (2017). The basics of item response theory using R. Springer International Publishing. https://doi.org/10.1007/978-3-319-54205-8
- Barkham, M., De Jong, K., Delgadillo, J., & Lutz, W. (2023). Routine outcome monitoring (ROM) and feedback: Research review and recommendations. Psychotherapy Research, 33(7), 841–855. https://doi.org/10.1080/10503307.2023.2181114
- Bhatia, A., & Gelso, C. J. (2018). Therapists’ perspective on the therapeutic relationship: Examining a tripartite model. Counselling Psychology Quarterly, 31(3), 271–293. https://doi.org/10.1080/09515070.2017.1302409
- Bland, J. M., & Altman, D. G. (1986). Statistical methods for assessing agreement between two methods of clinical measurement. The Lancet, 327(8476), 307–310. https://doi.org/10.1016/S0140-6736(86)90837-8
- Cena, L., Rota, M., Calza, S., Massardi, B., Trainini, A., & Stefana, A. (2021). Estimating the impact of the COVID-19 pandemic on maternal and perinatal health care services in Italy: Results of a self-administered survey. Frontiers in Public Health, 9. https://www.frontiersin.org/articles/10.3389fpubh.2021.701638
- Chalmers, R. P. (2012). Mirt: A multidimensional item response theory package for the R environment. Journal of Statistical Software, 48(6). https://doi.org/10.18637/jss.v048.i06
- Chandler, J., & Shapiro, D. (2016). Conducting clinical research using crowdsourced convenience samples. Annual Review of Clinical Psychology, 12(1), 53–81. https://doi.org/10.1146/annurev-clinpsy-021815-093623
- Christensen, A. P., Garrido, L. E., Guerra-Peña, K., & Golino, H. (2023). Comparing community detection algorithms in psychometric networks: A Monte Carlo simulation. Behavior Research Methods, https://doi.org/10.3758/s13428-023-02106-4
- Cohen, J. (1992). A power primer. Psychological Bulletin, 112(1), 155–159. https://doi.org/10.1037/0033-2909.112.1.155
- Comrey, A. L., & Lee, H. B. (2013). A first course in factor analysis. Psychology Press. https://doi.org/10.4324/9781315827506
- de Ayala, R. J. (2022). The theory and practice of item response theory (2nd ed.). Guilford Publications.
- Debelak, R., & Tran, U. S. (2016). Comparing the effects of different smoothing algorithms on the assessment of dimensionality of ordered categorical items with parallel analysis. PLoS One, 11(2), e0148143. https://doi.org/10.1371/journal.pone.0148143
- DeVellis, R. F., & Thorpe, C. T. (2022). Scale development: Theory and applications (5th ed.). Sage.
- Eubanks, C. F., Muran, J. C., & Safran, J. D. (2018). Alliance rupture repair: A meta-analysis. Psychotherapy, 55(4), 508–519. https://doi.org/10.1037/pst0000185
- Eugster, S. L., & Wampold, B. E. (1996). Systematic effects of participant role on evaluation of the psychotherapy session. Journal of Consulting and Clinical Psychology, 64(5), 1020–1028. https://doi.org/10.1037/0022-006X.64.5.1020
- Faro, J. M., Nagawa, C. S., Orvek, E. A., Smith, B. M., Blok, A. C., Houston, T. K., Kamberi, A., Allison, J. J., Person, S. D., & Sadasivam, R. S. (2021). Comparing recruitment strategies for a digital smoking cessation intervention: Technology-assisted peer recruitment, social media, ResearchMatch, and smokefree.gov. Contemporary Clinical Trials, 103, 106314. https://doi.org/10.1016/j.cct.2021.106314
- Feuerstahler, L. M., Waller, N., & MacDonald, A. (2020). Improving measurement precision in experimental psychopathology using item response theory. Educational and Psychological Measurement, 80(4), 695–725. https://doi.org/10.1177/0013164419892049
- Flückiger, C., Del Re, A. C., Wampold, B. E., & Horvath, A. O. (2018). The alliance in adult psychotherapy: A meta-analytic synthesis. Psychotherapy, 55(4), 316–340. https://doi.org/10.1037/pst0000172
- Gelso, C. J. (2009). The real relationship in a postmodern world: Theoretical and empirical explorations. Psychotherapy Research, 19(3), 253–264. https://doi.org/10.1080/10503300802389242
- Gelso, C. J. (2011). The real relationship in psychotherapy. American Psychological Association.
- Gelso, C. J. (2014). A tripartite model of the therapeutic relationship: Theory, research, and practice. Psychotherapy Research, 24(2), 117–131. https://doi.org/10.1080/10503307.2013.845920
- Gelso, C. J., & Hayes, J. A. (1998). The psychotherapy relationship: Theory, research, and practice. John Wiley & Sons
- Gelso, C. J., Kelley, F. A., Fuertes, J. N., Marmarosh, C., Holmes, S. E., Costa, C., & Hancock, G. R. (2005). Measuring the real relationship in psychotherapy: Initial validation of the therapist form. Journal of Counseling Psychology, 52(4), 640–649. https://doi.org/10.1037/0022-0167.52.4.640
- Gelso, C. J., Kivlighan, D. M., Busa-Knepp, J., Spiegel, E. B., Ain, S., Hummel, A. M., Ma, Y. E., & Markin, R. D. (2012). The unfolding of the real relationship and the outcome of brief psychotherapy. Journal of Counseling Psychology, 59(4), 495–506. https://doi.org/10.1037/a0029838
- Gelso, C. J., Kivlighan, D. M., & Markin, R. D. (2018). The real relationship and its role in psychotherapy outcome: A meta-analysis. Psychotherapy, 55(4), 434–444. https://doi.org/10.1037/pst0000183
- Gelso, C. J., Kivlighan, D. M., & Markin, R. D. (2019). The real relationship. In C. J. Gelso, D. M. Kivlighan, & R. D. Markin (Eds.), Psychotherapy relationships that work (pp. 351–378). Oxford University Press. https://doi.org/10.1093/med-psych/9780190843953.003.0010
- Gelso, C. J., & Kline, K. V. (2019). The sister concepts of the working alliance and the real relationship: On their development, rupture, and repair. Research in Psychotherapy: Psychopathology, Process and Outcome, 22(2). https://doi.org/10.4081/ripppo.2019.373
- Gelso, C. J., & Silberberg, A. (2016). Strengthening the real relationship: What is a psychotherapist to do? Practice Innovations, 1(3), 154–163. https://doi.org/10.1037/pri0000024
- Hair, J. F., Babin, B. J., Anderson, R. E., & Black, W. C. (2022). Multivariate data analysis. Cengage Learning.
- Harris, P. A., Scott, K. W., Lebo, L., Hassan, N., Lightner, C., & Pulley, J. (2012). Researchmatch: A national registry to recruit volunteers for clinical research. Academic Medicine, 87(1), 66–73. https://doi.org/10.1097/ACM.0b013e31823ab7d2
- Hatcher, R. L., & Gillaspy, J. A. (2006). Development and validation of a revised short version of the working alliance inventory. Psychotherapy Research, 16(1), 12–25. https://doi.org/10.1080/10503300500352500
- He, W. (2023). Positive and negative affect facilitate creativity motivation: Findings on the effects of habitual mood and experimentally induced emotion. Frontiers in Psychology, 14, 1014612. https://doi.org/10.3389/fpsyg.2023.1014612
- Hill, C. E., Gelso, C. J., Chui, H., Spangler, P. T., Hummel, A., Huang, T., Jackson, J., Jones, R. A., Palma, B., Bhatia, A., Gupta, S., Ain, S. C., Klingaman, B., Lim, R. H., Liu, J., Hui, K., Jezzi, M. M., & Miles, J. R. (2014). To be or not to be immediate with clients: The use and perceived effects of immediacy in psychodynamic/interpersonal psychotherapy. Psychotherapy Research, 24(3), 299–315. https://doi.org/10.1080/10503307.2013.812262
- Hill, C. E., & Kellems, I. S. (2002). Development and use of the helping skills measure to assess client perceptions of the effects of training and of helping skills in sessions. Journal of Counseling Psychology, 49(2), 264–272. https://doi.org/10.1037/0022-0167.49.2.264
- Hoyle, R. H. (Eds.). (2023). Handbook of structural equation modeling (2nd ed.). The Guilford Press.
- Hu, L., & Bentler, P. M. (1999). Cutoff criteria for fit indexes in covariance structure analysis: Conventional criteria versus new alternatives. Structural Equation Modeling: A Multidisciplinary Journal, 6(1), 1–55. https://doi.org/10.1080/10705519909540118
- Irwing, P., Booth, T., & Hughes, D. J. (Eds.). (2018). The wiley handbook of psychometric testing: A multidisciplinary reference on survey, scale and test development (1st ed.). Wiley. https://doi.org/10.1002/9781118489772
- Jacobson, N. S., & Truax, P. (1991). Clinical significance: A statistical approach to defining meaningful change in psychotherapy research. Journal of Consulting and Clinical Psychology, 59(1), 12–19. https://doi.org/10.1037/0022-006X.59.1.12
- Kaiser, J., Hanschmidt, F., & Kersting, A. (2021). The association between therapeutic alliance and outcome in internet-based psychological interventions: A meta-analysis. Computers in Human Behavior, 114, 106512. https://doi.org/10.1016/j.chb.2020.106512
- Kelley, F. A., Gelso, C. J., Fuertes, J. N., Marmarosh, C., & Lanier, S. H. (2010). The Real Relationship Inventory: Development and psychometric investigation of the client form. Psychotherapy: Theory, Research, Practice, Training, 47(4), 540–553. https://doi.org/10.1037/a0022082
- Kertz, S., Bigda-Peyton, J., & Bjorgvinsson, T. (2012). Validity of the generalized anxiety disorder-7 scale in an acute psychiatric sample: Validity of the generalized anxiety disorder-7. Clinical Psychology & Psychotherapy, 456. https://doi.org/10.1002/cpp.1802
- Kline, K. V., Hill, C. E., Lu, Y., & Gelso, C. J. (2023). Transference and client attachment to therapist in psychodynamic psychotherapy. Psychotherapy, https://doi.org/10.1037/pst0000492
- Kroenke, K., Spitzer, R. L., & Williams, J. B. W. (2001). The PHQ-9: Validity of a brief depression severity measure. Journal of General Internal Medicine, 16(9), 606–613. https://doi.org/10.1046/j.1525-1497.2001.016009606.x
- Lent, R. W., Hoffman, M. A., Hill, C. E., Treistman, D., Mount, M., & Singley, D. (2006). Client-specific counselor self-efficacy in novice counselors: Relation to perceptions of session quality. Journal of Counseling Psychology, 53(4), 453–463. https://doi.org/10.1037/0022-0167.53.4.453
- Löwe, B., Gräfe, K., Zipfel, S., Witte, S., Loerch, B., & Herzog, W. (2004). Diagnosing ICD-10 depressive episodes: Superior criterion validity of the patient health questionnaire. Psychotherapy and Psychosomatics, 73(6), 386–390. https://doi.org/10.1159/000080393
- Martinez-Aran, A., & Vieta, E. (2022). Precision psychotherapy. European Neuropsychopharmacology, 55, 20–21. https://doi.org/10.1016/j.euroneuro.2021.10.771
- Munder, T., Wilmers, F., Leonhart, R., Linster, H. W., & Barth, J. (2009). Working Alliance Inventory-Short Revised (WAI-SR): Psychometric properties in outpatients and inpatients. Clinical Psychology & Psychotherapy, 17(3), 231–239. https://doi.org/10.1002/cpp.658
- Muran, J. C., Safran, J. D., Gorman, B. S., Samstag, L. W., Eubanks-Carter, C., & Winston, A. (2009). The relationship of early alliance ruptures and their resolution to process and outcome in three time-limited psychotherapies for personality disorders. Psychotherapy: Theory, Research, Practice, Training, 46(2), 233–248. https://doi.org/10.1037/a0016085
- Nickodem, K., & Halpin, P. (2022). Kfa: K-fold cross validation for factor analysis. Https://CRAN.R-project.org/package = kfa.
- Norcross, J. C., & Lambert, M. J. (2019). Psychotherapy relationships that work (3rd ed.). Volume 1: Evidence-based therapist contributions. Oxford University Press.
- Pierce, B. S., Perrin, P. B., & McDonald, S. D. (2020). Demographic, organizational, and clinical practice predictors of U.S. psychologists’ use of telepsychology. Professional Psychology: Research and Practice, 51(2), 184–193. https://doi.org/10.1037/pro0000267
- Pierce, B. S., Perrin, P. B., Tyler, C. M., McKee, G. B., & Watson, J. D. (2021). The COVID-19 telepsychology revolution: A national study of pandemic-based changes in U.S. mental health care delivery. American Psychologist, 76(1), 14–25. https://doi.org/10.1037/amp0000722
- Probst, G. H., Berger, T., & Flückiger, C. (2019). The alliance-outcome relation in internet-based interventions for psychological disorders: A correlational meta-analysis. Verhaltenstherapie, 32(Suppl. 1), 135–146. https://doi.org/10.1159/000503432
- Qureshi, A., & Collazos, F. (2011). The intercultural and interracial therapeutic relationship: Challenges and recommendations. International Review of Psychiatry, 23(1), 10–19. https://doi.org/10.3109/09540261.2010.544643
- Reinard, J. C. (2006). Communication research statistics. SAGE.
- Revelle, W., & Condon, D. M. (2019). Reliability from α to ω: A tutorial. Psychological Assessment, 31(12), 1395–1411. https://doi.org/10.1037/pas0000754
- Rosseel, Y. (2012). Lavaan: An R Package for Structural Equation Modeling. Journal of Statistical Software, 48(2). https://doi.org/10.18637/jss.v048.i02
- Samstag, L. W., Batchelder, S. T., Muran, J. C., Safran, J. D., & Winston, A. (1998). Early identification of treatment failures in short-term psychotherapy. An assessment of therapeutic alliance and interpersonal behavior. The Journal of Psychotherapy Practice and Research, 7(2), 126–143.
- Smith, G. T., McCarthy, D. M., & Anderson, K. G. (2000). On the sins of short-form development. Psychological Assessment, 12(1), 102–111. https://doi.org/10.1037/1040-3590.12.1.102
- Soto, C. J., & John, O. P. (2017a). Short and extra-short forms of the Big Five Inventory–2: The BFI-2-S and BFI-2-XS. Journal of Research in Personality, 68, 69–81. https://doi.org/10.1016/j.jrp.2017.02.004
- Soto, C. J., & John, O. P. (2017b). The next Big Five Inventory (BFI-2): Developing and assessing a hierarchical model with 15 facets to enhance bandwidth, fidelity, and predictive power. Journal of Personality and Social Psychology, 113(1), 117–143. https://doi.org/10.1037/pspp0000096
- Spitzer, R. L., Kroenke, K., Williams, J. B. W., & Löwe, B. (2006). A Brief Measure for Assessing Generalized Anxiety Disorder: The GAD-7. Archives of Internal Medicine, 166(10), 1092–1097. https://doi.org/10.1001/archinte.166.10.1092
- Stefana, A., Fusar-Poli, P., Vieta, E., & Youngstrom, E. A. (2023). Therapeutic relationship elements and therapy session outcomes: Protocol for a longitudinal study of the patient’s perspective. Open Research Europe, 3, 133. https://doi.org/10.12688/openreseurope.16466.1
- Stefana, A., Fusar-Poli, P., Vieta, E., & Youngstrom, E. (2024). Assessing the patients' affective perception of their psychotherapist: Validation of the in-Session Patient Affective Reactions Questionnaire (SPARQ). Frontiers in Psychiatry.
- Stefana, A., Langfus, J. A., Vieta, E., Fusar-Poli, P., & Youngstrom, E. A. (2023). Development and initial validation of the in-session patient affective reactions questionnaire (SPARQ) and the rift In-session questionnaire (RISQ). Journal of Clinical Medicine, 12(15), 5156. https://doi.org/10.3390/jcm12155156
- Stefana, A., Vieta, E., Fusar-Poli, P., & Youngstrom, E. (2024). Enhancing psychotherapy outcomes by encouraging patients to regularly self-monitor, reflect on, and share their affective responses toward their therapist: Protocol for a randomized controlled trial. JMIR Research Protocols, https://doi.org/10.2196/55369
- Stefana, A., Youngstrom, E. A., Hopwood, C. J., & Dakanalis, A. (2020). The COVID-19 pandemic brings a second wave of social isolation and disrupted services. European Archives of Psychiatry and Clinical Neuroscience, 270(6), 785–786. https://doi.org/10.1007/s00406-020-01137-8
- Steiner, M., & Grieder, S. (2020). EFAtools: An R package with fast and flexible implementations of exploratory factor analysis tools. Journal of Open Source Software, 5(53), 2521. https://doi.org/10.21105/joss.02521
- Streiner, D. L., Norman, G. R., & Cairney, J. (2015). Health Measurement Scales: A practical guide to their development and use (5th ed.). Oxford University Press.
- Tasca, G. A., Angus, L., Bonli, R., Drapeau, M., Fitzpatrick, M., Hunsley, J., & Knoll, M. (2019). Outcome and progress monitoring in psychotherapy: Report of a Canadian psychological association task force. Canadian Psychology / Psychologie Canadienne, 60(3), 165–177. https://doi.org/10.1037/cap0000181
- Thompson, E. R. (2007). Development and validation of an internationally reliable short-form of the positive and negative affect schedule (PANAS). Journal of Cross-Cultural Psychology, 38(2), 227–242. https://doi.org/10.1177/0022022106297301
- Vaz, A. M., Ferreira, L. I., Gelso, C., & Janeiro, L. (2023). The sister concepts of working alliance and real relationship: A meta-analysis. Counselling Psychology Quarterly, 1–22. https://doi.org/10.1080/09515070.2023.2205103
- Verheul, R., Andrea, H., Berghout, C. C., Dolan, C., Busschbach, J. J. V., Van Der Kroft, P. J. A., Bateman, A. W., & Fonagy, P. (2008). Severity Indices of Personality Problems (SIPP-118): Development, factor structure, reliability, and validity. Psychological Assessment, 20(1), 23–34. https://doi.org/10.1037/1040-3590.20.1.23
- Wampold, B. E., & Flückiger, C. (2023). The alliance in mental health care: Conceptualization, evidence and clinical applications. World Psychiatry, 22(1), 25–41. https://doi.org/10.1002/wps.21035
- Wampold, B. E., & Imel, Z. E. (2015). The great psychotherapy debate: The evidence for what makes psychotherapy work (2nd ed.). Routledge.
- Weekers, L. C., Hutsebaut, J., & Kamphuis, J. H. (2019). The Level of Personality Functioning Scale-Brief Form 2.0: Update of a brief instrument for assessing level of personality functioning: The Level of Personality Functioning Scale - Brief Form 2.0. Personality and Mental Health, 13(1), 3–14. https://doi.org/10.1002/pmh.1434
- Youngstrom, E. A., Perez Algorta, G., Youngstrom, J. K., Frazier, T. W., & Findling, R. L. (2021). Evaluating and validating GBI mania and depression short forms for self-report of mood symptoms. Journal of Clinical Child & Adolescent Psychology, 50(5), 579–595. https://doi.org/10.1080/15374416.2020.1756301
- Youngstrom, E. A., Salcedo, S., Frazier, T. W., & Perez Algorta, G. (2019). Is the finding Too good to Be true? Moving from “more Is better” to thinking in terms of simple predictions and credibility. Journal of Clinical Child & Adolescent Psychology, 48(6), 811–824. https://doi.org/10.1080/15374416.2019.1669158
- Youngstrom, E. A., Van Meter, A., Frazier, T. W., Youngstrom, J. K., & Findling, R. L. (2020). Developing and validating short forms of the parent general behavior inventory mania and depression scales for rating youth mood symptoms. Journal of Clinical Child & Adolescent Psychology, 49(2), 162–177. https://doi.org/10.1080/15374416.2018.1491006
- Zimmerman, M., Ruggero, C. J., Chelminski, I., Young, D., Posternak, M. A., Friedman, M., Boerescu, D., & Attiullah, N. (2006). Developing brief scales for Use in clinical practice: The reliability and validity of single-item self-report measures of depression symptom severity, psychosocial impairment Due to depression, and quality of life. The Journal of Clinical Psychiatry, 67(10), 1536–1541. https://doi.org/10.4088/JCP.v67n1007