
 ?Mathematical formulae have been encoded as MathML and are displayed in this HTML version using MathJax in order to improve their display. Uncheck the box to turn MathJax off. This feature requires Javascript. Click on a formula to zoom.
Abstract
Objective
To test the predictive accuracy and generalisability of a personalised advantage index (PAI) model designed to support treatment selection for Post-Traumatic Stress Disorder (PTSD).
Method
A PAI model developed by Deisenhofer et al. (2018) was used to predict treatment outcomes in a statistically independent dataset including archival records for N = 152 patients with PSTD who accessed either trauma-focussed cognitive behavioural therapy or eye movement desensitisation and reprocessing in routine care. Outcomes were compared between patients who received their PAI-indicated optimal treatment versus those who received their suboptimal treatment.
Results
The model did not yield treatment specific predictions and patients who had received their PAI-indicated optimal treatment did not have better treatment outcomes in this external validation sample.
Conclusion
This PAI model did not generalise to an external validation sample.
Clinical or methodological significance of this article: Due to individual differences, some patients with post-traumatic stress disorder may be more likely to benefit from one evidence based psychological therapy than another. Using machine learning methods, it may be possible to identify these patients prior to the start of treatment and make an informed treatment recommendation. However, this study highlights the importance of external validation of machine learning models as an essential prerequisite to the clinical testing of such models in psychotherapy practice.
Introduction
Post-Traumatic Stress Disorder (PTSD) affects around one in twenty-five adults (∼4%) in England at any one time (Fear et al., Citation2016). The National Institute for Health and Care Excellence (NICE) guidelines recommend trauma-focussed cognitive behavioural therapy (Tf-CBT) or eye movement desensitisation and reprocessing (EMDR) as psychological therapies for PTSD (NICE, Citation2018). The National Health Service (NHS) in England began offering evidence-based, NICE recommended psychological therapies in primary care settings in 2008 via the NHS Talking Therapies programme (Clark et al., Citation2009), formerly known as Improving Access to Psychological Therapies (IAPT; Clark & Whittington, Citation2023). Patients accessing NHS Talking Therapies for PTSD are signposted to high intensity interventions (i.e., Tf-CBT or EMDR) at screening (National Collaborating Centre for Mental Health, Citation2018), but despite these signposting and allocation efforts, many patients still do not respond to treatment and dropout rates are high. Robinson et al. (Citation2020) found that only 32% of patients accessing CBT for PTSD in 16 NHS Talking Therapies services attained a reliable and clinically significant improvement in symptoms. This is well below the average treatment response rate across all NHS Talking Therapies patients, which is around 50% (NHS Digital, Citation2022).
Due to individual differences, some patients may be more likely to respond to one evidence based psychological therapy than another. To address this, DeRubeis et al. (Citation2014) developed a method called the Personalised Advantage Index (PAI). The PAI method uses a statistical model to make a prediction about which of two alternative treatments may be most effective for each patient. The treatment with the best predicted outcome is labelled that patient’s optimal treatment, and the other treatment is labelled their suboptimal treatment. Treatment outcomes are then retrospectively compared between patients who received their model-indicated optimal treatment, and patients who received their suboptimal treatment. Additionally, by subtracting the predicted outcome of one treatment from that of the other treatment, multiple patient characteristics can be reduced to a single continuous indicator of differential treatment response (i.e., the PAI score).
Several studies have subsequently sought to develop PAI for PTSD treatments delivered in the context of clinical trials and routine practice (Hoeboer et al., Citation2021; Keefe et al., Citation2018). Deisenhofer et al. (Citation2018) used the PAI method to predict whether each patient was more likely to respond to Tf-CBT or EMDR in routine clinical practice. Using a genetic algorithm, Deisenhofer et al. (Citation2018) developed two linear regression models to predict response to Tf-CBT and EMDR using participants’ pre-treatment clinical and demographic characteristics. A genetic algorithm is a machine-learning optimisation algorithm that mimics Darwinian evolutionary processes (natural selection, cross-over, mutation) to build the best model from the available predictors (Mitchell, Citation1998). Deisenhofer et al. (Citation2018) found a significantly higher rate of reliable improvement among patients who received their model-indicated optimal treatment (62.9% of patients who received optimal treatment attained reliable improvement, compared to 33.6% of patients who received suboptimal treatment). This suggests that by using the PAI method it may be possible to predict the optimal treatment for individual patients with PTSD at the point of initial assessment, and that applying personalised treatment recommendations based on those predictions could significantly improve treatment outcomes for PTSD in routine practice.
Before a prediction model of this kind can be used in clinical practice, it first requires external validation to demonstrate that the model’s predictive capabilities reliably generalise beyond the data that was used to develop, or train, the model. Prediction models are likely to make more accurate predictions in the data used to train the model, than in data previously unseen by the model (Siontis et al., Citation2015). In the worst-case scenario, the model is overfit to the training data, and describes idiosyncratic relationships between variables that do not generalise to different samples drawn from the same population (Steyerberg, Citation2019).
Accordingly, the PAI studies cited above each applied some form of internal cross-validation when evaluating prediction accuracy. Deisenhofer et al. (Citation2018) used leave-one-out (LOO) cross-validation, whereby each individual patient’s outcome is predicted by fitting the regression model to the rest of the sample (N – 1), temporarily excluding that patient’s data from the training sample. This adjusts for optimism in the estimation of prediction model performance, but it is possible that the model predictor selection was biased towards the specific characteristics of the training sample, and for this reason the model predictions may not generalise to new data (Kessler et al., Citation2017; Steyerberg, Citation2019). External validation tests this by applying the same model to make predictions in new and separate outcome data and evaluating the accuracy of those predictions.
Despite the credibility brought by external validation applications of the method are still relatively rare. Researchers can develop new prediction models, but without external validation the models gain little clinical traction and create research waste. Two recent systematic reviews of clinical prediction models in psychiatry found evidence of lack of external validation. Meehan et al. (Citation2022) found that only 20.1% of 308 models were externally validated in an independent sample, whilst Salazar de Pablo et al. (Citation2021) found that just 4.6% of 584 psychiatry clinical prediction models were externally validated.
At the same time, it’s important to question what can be realistically expected from an external validation. In recent validation studies using either the same dataset (e.g., Schwartz et al., Citation2021) or different datasets (e.g., Moggia et al., Citation2023) the observed effect was discernible exclusively among patients with the most robust recommendations. Employing external datasets is necessary for a thorough evaluation, but it’s important to strike an optimal balance between similarity (to facilitate generalisation) and dissimilarity (to assess generalisability to new data).
Objective
The aim of the current study was to externally validate the PAI model developed by Deisenhofer et al. (Citation2018) in a statistically independent sample of patients treated for PTSD in routine practice. Additionally, the dataset used to develop the model did not contain a measure of PTSD symptoms, and a depression measure was used as a proxy indicator of PTSD severity. The secondary aim of the present study, therefore, was to test whether the model developed by Deisenhofer et al. (Citation2018) generalised to a measure of PTSD symptoms. The research questions were, (1) does the model generalise to independent data with the same outcome measure and (2) does the model generalise to a measure of PTSD symptoms?
Method
Pre-Registration
The background, aims, and methodology for this study were pre-registered with As Predicted and the pre-registration can be accessed here: https://aspredicted.org/ca9u5.pdf.
Participants, Setting and Interventions
The data used in this study included anonymised clinical records of patients with PTSD accessing NHS Talking Therapies services across seven sites in England between January 2013 and December 2018. Patients either self-referred to these services, or were referred by their general practitioner, and screened as positive for PTSD at initial assessment. Patients were not routinely excluded due to current drug or alcohol misuse, multiple or complex trauma, or concurrent mental health problems that require secondary mental healthcare (e.g., psychosis, bipolar disorder, personality disorders, or eating disorders); patients were assessed on an individual basis and may have been referred to more intensive, multi-professional care where necessary. Consistent with national clinical guidelines (NICE, Citation2018), patients were allocated to one of two evidence-based psychotherapies for PTSD: Tf-CBT (Ehlers et al., Citation2005) or EMDR (Shapiro, Citation2001). Treatment allocation was based on patient preference and shared decision-making with assessing clinicians at the time of initial assessments. Treatments were delivered by High Intensity Therapists with the relevant, accredited postgraduate training, practicing under regular clinical supervision. Some patients also accessed brief, low intensity interventions such as CBT-based self-help prior to commencing high intensity treatment. See the NHS Talking Therapies Manual for more details (National Collaborating Centre for Mental Health, Citation2018).
To be included in the study sample, patients were required to have a provisional ICD-10 diagnosis of PTSD (WHO, Citation2019), and have received ≥ 2 sessions of either Tf-CBT or EMDR (to provide pre- and post-treatment outcome measures). Patients who received more than one high intensity psychological therapy within a treatment episode were excluded to allow for evaluation of the models’ treatment-specific outcome predictions. Where the same patient had multiple eligible treatment episodes within the dataset, the first episode was included in the sample and subsequent treatment episodes were excluded, given our interest in the adequacy of timely and accurate treatment selection. Total eligible study sample N = 1,193, comprising n = 1,155 patients who received Tf-CBT and n = 38 patients who received EMDR. The sample selection process is detailed in the STROBE diagram in Supplementary Figure 1.
Ethical Approval
This study is a secondary analysis of routine care data. Ethical approval was granted by the North West – Greater Manchester West Research Ethics Committee (Ref: 18/NW/0372) for this data to used for research. All patients in this dataset provided verbal consent for their anonymised data to be used for research and this was documented in their clinical records.
Measures
Psychometric measures
Due to the absence of a measure of PTSD symptoms in the model development dataset Deisenhofer et al. (Citation2018) used the Patient Health Questionnaire 9 (PHQ-9; Kroenke et al., Citation2001) as the primary outcome measure, and this was replicated in the current study. The PHQ-9 is a validated, nine-item, self-report measure of depression severity. Total PHQ-9 scores range from 0 to 27, with higher scores indicating greater number and frequency of depression symptoms. Kroenke et al. (Citation2001) reported good reliability (Cronbach’s a = 0.89) in a primary care sample. A change of ≥6 points on the PHQ-9 has been recommended as an index of reliable improvement or deterioration in symptoms (Richards & Borglin, Citation2011).
The current dataset contained a self-report measure of PTSD symptoms, the Impact of Events Scale-Revised (IES-R; Weiss, Citation2007), but the high proportion of missing values (85.8% pre-treatment, 87% post-treatment) precluded investigation of the second research question. However, there was a significant, medium-sized, positive correlation between pre-treatment PHQ-9 and IES-R score (r (176) = .44, p < .001), and a significant, large, positive correlation between post-treatment PHQ-9 and IES-R score (r (160) = .75, p < .001).
The PHQ-9 was administered before every appointment, along with the Generalised Anxiety Disorder 7 (GAD-7; Spitzer et al., Citation2006) and the Work and Social Adjustment Scale (WSAS; Mundt et al., Citation2002). The GAD-7 is a validated seven-item self-report measure of anxiety symptoms, scores range from 0 to 21 with higher scores indicating more severe symptoms. The WSAS is a validated five-item self-report measure of the extent to which a person’s mental health problems impair their daily functioning. WSAS scores range from 0 to 40 with higher scores indicating greater functional impairment. Pre-treatment scores were extracted from each case’s first high intensity treatment session, and post-treatment scores extracted from their last high intensity treatment session.
Demographic and health variables
Age, gender, ethnicity, disability, long-term condition (LTC), employment, and antidepressant medication data were extracted from patient records. For some patients with multiple referrals in the dataset, age data was only available for the most recent referral, and age was calculated for earlier referrals by subtracting the number of years between referral dates from the patient’s age at the most recent referral. Ethnicity was based on the Office for National Statistics ethnic categories (Office for National Statistics, Citationn.d.) and was self-reported. Disability was a binary indicator of whether a patient had a diagnosed disability or considered them self to be disabled. LTC was a binary indicator of whether a patient had a long-term physical health condition such as diabetes, arthritis, or a chronic respiratory condition. Employment and medication status were recorded at every appointment; pre-treatment values were extracted from each case’s first high intensity treatment session.
Pre-processing of Data
Missing data and multiple imputation
See Supplementary Table 1 for the proportion of missing values on each variable. Six variables had >5% missing values. These were LTC (Tf-CBT = 38.8%, EMDR = 34.2%), post-treatment PHQ-9 (Tf-CBT = 6.1%, EMDR = 7.9%), post-treatment GAD-7 (Tf-CBT = 6.1%, EMDR = 7.9%), pre-treatment WSAS (Tf-CBT = 13.3%, EMDR = 23.7%), post-treatment WSAS (Tf-CBT = 20.1%, EMDR = 23.7%), and medication (Tf-CBT = 19.4%, EMDR = 10.5%). Multiple imputation of missing values was performed using the missForest package in R (Stekhoven & Bühlmann, Citation2012). Out-of-bag error estimates for the Tf-CBT group were NRMSE = .33 and PFC = .32, and for the EMDR group NRMSE = .33 and PFC = .23. See Supplementary Materials for details of missing value analysis and multiple imputation.
Propensity score matching
As this study was based on routinely collected data, patients were not randomly allocated to treatment. As such, it is possible that there are systematic differences in the characteristics of the two treatment groups, which could confound the relationship between treatment and outcome. This is known as confounding by indication (Kyriacou & Lewis, Citation2016). Propensity score matching (PSM; Rosenbaum & Rubin, Citation1983) is a commonly used method to control for confounding by indication and is recommended for treatment selection studies using routine clinical data (Kessler et al., Citation2019). PSM selects patients from the comparator group for inclusion in the study by the similarity of their combined covariates to that of patients in the treatment group, thus producing a balance of observed pre-treatment covariates like that produced by randomisation. Patients who received Tf-CBT were matched to the n = 38 patients who received EMDR at a ratio of 3:1, producing a Tf-CBT group of n = 114. The ratio of 3:1 reflects the relative infrequency of routine service delivery of EMDR, due to the small workforce of qualified EMDR practitioners. The resulting study sample size of N = 152 is smaller than the pre-registered sample size of N = 180. Given the size of the initial dataset (N = 234,214 referrals) it was expected that there would be more cases who accessed protocol driven EMDR for PTSD, but EMDR was most often delivered as part of an integrated treatment with Tf-CBT (see Supplementary Figure 1). PSM was performed using the MatchIt package in R (Stuart et al., Citation2011), applying the optimal matching method. The standardised mean difference (SMD) method was used to assess the difference between groups on each variable, whereby an SMD < .25 is considered an adequate match between groups. Following PSM all variables had an SMD < .25. See Supplementary Materials for details of PSM.
Sample characteristics after multiple imputation and propensity score matching
Sample characteristics are presented in . After matching, the validation sample was significantly different to the model development sample (Deisenhofer et al., Citation2018) on two variables: Pre-treatment WSAS was significantly lower in the validation sample (N = 152, mean = 17.07, SD = 9.72) than the development sample (N = 225, mean = 21.13, SD = 10.28; t (335.81) = 3.89, p < .001); and there was a significantly lower rate of disability in the validation sample (19.74%) than the development sample (48%; X2 (1) = 30.02, p < .001).
Table I. Sample characteristics (after multiple imputation).
Data Analysis Strategy
Comparing Tf-CBT and EMDR treatment outcomes
Treatment outcomes were compared between the Tf-CBT and EMDR groups by comparing the 95% confidence intervals of the pre-treatment to post-treatment effect size (d) on the PHQ-9, GAD-7, and WSAS. If the confidence intervals overlap, this indicates that there was no statistically significant difference between the two groups in pre- to post-treatment change. Effect sizes and confidence intervals were calculated using the method described by Minami et al. (Citation2008), adjusted for non-normal distributions (see Supplementary Figure 1 for Q-Q plots) using Spearman’s rank correlation (see Supplementary Tables 2 and 3 for correlation matrices).
Predicting treatment outcomes
The two linear regression models developed by Deisenhofer et al. (Citation2018) were applied to predict outcomes across both treatment groups (N = 152) from patients’ pre-treatment scores on the predictor variables selected by the genetic algorithm during model development. Using the stats package in R, each regression model was fitted to the respective training data via the lm() function, giving the same coefficients reported by Deisenhofer et al. (Citation2018), and was then used to predict post-treatment PHQ-9 score in the external validation sample via the predict() function. The linear regression equation for the EMDR model was:
And the linear regression equation for the Tf-CBT model was:
Deisenhofer et al. (Citation2018) centred continuous baseline variables around the group mean. Therefore, baseline PHQ-9 score was centred around the EMDR group mean (15.22), and baseline WSAS was centred around the Tf-CBT group mean (21.11). As such, pre-treatment PHQ-9 and WSAS were centred around these respective values in the whole validation sample. Employment status was reduced to a binary variable, with “employed” and “student” coded as 0.5, and “unemployed,” “long-term sick,” and all other categories coded as −0.5. Medication status was reduced to a binary variable, with “prescribed and taking” and “prescribed but not taking” coded as 0.5, and “not prescribed” coded as −0.5.
Evaluating model performance
To evaluate prediction accuracy, R2 was calculated by squaring the correlation (Pearson’s r) between the observed post-treatment PHQ-9 scores and the scores predicted by each model. R2 can be interpreted as the proportion of variance in treatment outcome explained by the model, with a maximum value of 1 indicating perfect prediction accuracy, and values close to 0 indicating poor prediction accuracy. R2 was examined for each prediction model in each of the treatment groups, if the two models make treatment-specific predictions, then it would be expected that the Tf-CBT model makes more accurate predictions in the Tf-CBT group than in the EMDR group, and the EMDR model makes more accurate predictions in the EMDR group than in the Tf-CBT group. To evaluate model prediction error, Root Mean Squared Error (RMSE) was calculated by taking the square root of the mean squared differences between the predicted and observed scores. Lower RMSE values indicate less prediction error, and higher values indicate more prediction error. R2 and RMSE estimates in the external validation sample were compared to R2 and RMSE estimates in the model development sample, without the LOO cross-validation that was applied to internally cross-validate the model during development. Additionally, for comparison with the model development sample, true error was calculated as the mean absolute difference between the observed post-treatment PHQ-9 scores and the factual predictions.
Comparing model-indicated optimal and suboptimal treatment outcomes
The model-indicated optimal treatment was identified for each case by comparing the Tf-CBT and EMDR model prediction for each patient; the treatment with the lowest predicted post-treatment PHQ-9 score was labelled their optimal treatment, and the treatment with the highest predicted post-treatment PHQ-9 score was labelled their suboptimal treatment. Patients were then grouped by whether they had received their optimal or suboptimal treatment, and average treatment outcomes were compared between the two groups. Patients were labelled as having reliable change in symptoms if their PHQ-9 score at their last treatment session was 6 or more points lower than their PHQ-9 score at their first treatment session (Richards & Borglin, Citation2011). The rate of reliable improvement was compared between the optimal and suboptimal treatment groups with a chi-square test. For further comparison with Deisenhofer et al. (Citation2018), Number Needed to Treat (NNT) was estimated using the effect size calculator provided by Lenhard and Lenhard (Citation2016).
Personalised advantage index
The PAI was calculated by subtracting the predicted outcome of each case’s optimal treatment from the predicted outcome of their suboptimal treatment. In this way, the PAI represents the predicted difference in outcome between optimal and suboptimal treatment for each case; the greater the PAI value, the more likely the patient is to benefit from receiving their optimal treatment rather than their suboptimal treatment.
Patients with a PAI ≥ 1 standard deviation are those most likely to benefit from personalised treatment selection. The standard deviation of PAI scores in the development sample was 1.92. As a test of the clinical utility of the PAI among such cases, a regression analysis was performed predicting post-treatment PHQ-9 score from a binary indicator of whether a patient received their optimal or suboptimal treatment, among patients with a PAI ≥ 1 standard deviation. Pre-treatment PHQ-9 score was included as a covariate to control for baseline symptom severity, and propensity score was included as a covariate as a secondary control (after PSM) for confounding by indication (D’Agostino, Citation1998).
Results
Comparison of Average Treatment Effect
The median number of EMDR sessions was 4 (inter-quartile range = 2–8.25) and the mode was 2 (range = 2–20). The median number of Tf-CBT sessions was 6 (inter-quartile range = 4–10) and the mode was 6 (range = 2–29). Pre-treatment to post-treatment effect sizes are presented in . Comparison of the 95% confidence intervals suggest no significant difference in treatment effect size between groups. Of the current sample (which excluded cases who only received one session of therapy), 40.13% (n = 61 / 152) reported a reliable improvement in depression symptoms. This included 50% of the EMDR group (n = 19 / 38) and 36.84% of the Tf-CBT group (n = 42 / 114). The difference in these rates of reliable improvement was not statistically significant (X2 (1) = 1.54, p = .214).
Table II. Treatment outcome in the total sample and matched Tf-CBT and EMDR groups.
Model Evaluation
R2 and RMSE for the model development sample and external validation sample are presented in . The R2 values indicate that although each prediction model demonstrates better predictive accuracy in its respective treatment group in the development sample, this was not the case in the validation sample. The pattern of results in the development sample is what would be expected if the two models make treatment specific predictions. However, this pattern did not replicate in the external validation sample, suggesting that these two models make general prognostic predictions that are not treatment specific.
Table III. Model prediction accuracy (R2) and error (RMSE) of the Tf-CBT and EMDR prediction models in the development and validation samples.
True error for the whole sample was 5.44, compared to 5.07 in the development sample with LOO cross-validation, and 4.83 without. For the Tf-CBT group, true error was 5.76, compared to 5.37 in the development sample with LOO cross-validation, and 4.74 without. For the EMDR group, true error was 4.49, compared to 4.92 in the development sample with LOO cross-validation, and 5.03 without.
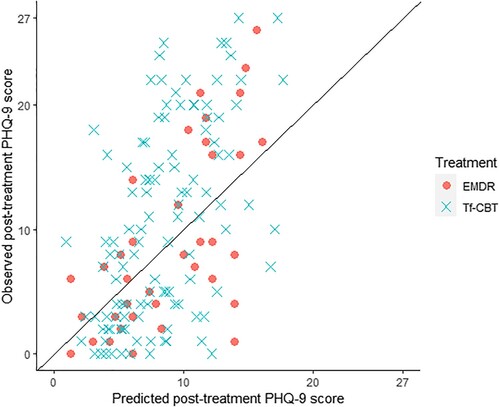
The calibration plot presented in plots the observed final session PHQ-9 scores against the factual predictions made by each of the regression models. The closer the points are to the diagonal line, the more accurate the prediction. The calibration plot suggests that the models make more accurate predictions for low scores, with more error in predictions for higher scores, and neither model predicts any scores at the higher end of the scale.
Figure 1. Calibration plot comparing predicted and observed post-treatment PHQ-9 scores.
Predicting Optimal Treatment
Of the whole sample, 57.23% (n = 87) received their model-indicated optimal treatment, including 47.37% (n = 18) of the EMDR group, and 60.53% (n = 69) of the Tf-CBT group. There was no significant difference between the Tf-CBT and EMDR group in the number of cases who received their model-indicated optimal treatment (X2 (1) = 1.51, p = .219). The mean observed post-treatment PHQ-9 score for the optimal treatment group was 11.09 (SD = 7.37), and for suboptimal treatment group the mean was 8.63 (SD = 7.89). This is a mean difference of 2.46, corresponding to a Cohen’s d of .32 (95% CI = 0.00, 0.65). However, a similar average group difference in PHQ-9 score was observed pre-treatment: The mean observed pre-treatment PHQ-9 score for the optimal group was 15.92 (SD = 5.72), and for the suboptimal group was 13.54 (SD = 7.34), mean difference = 2.38, Cohen’s d = .37 (95% CI = 0.04, 0.69). Hence, it is necessary to control for differences in baseline symptom severity when comparing average treatment effect, as follows in the regression analysis.
Rates of reliable improvement are presented in . There was no significant difference in the rates of reliable improvement between patients who received their optimal treatment (39.08%) versus those who received their suboptimal treatment (41.54%; X2 (1) = 0.02, p = 0.890).
Table IV. Comparing the rate of reliable improvement in PHQ-9 score between cases who received their model-indicated optimal treatment (N = 87) and those who received their model-indicated suboptimal treatment (N = 65).
In instances where there is a lower rate of the desired outcome in the treatment group than in the comparator group, NNT becomes the Number Needed to Harm (NNH). There was a 2.46% lower rate of reliable improvement in the optimal treatment group, which corresponds to an NNH = 40.68. This suggests that for every 40–41 patients who received their model-indicated optimal treatment, an additional case would not experience reliable improvement, compared to patients who received their model-indicated suboptimal treatment.
The Personalised Advantage Index
The mean PAI score was 2.85 (SD = 1.96), the minimum was 0.03 and maximum was 9.39. In the validation sample, 7.89% (n = 12 / 152) had a PAI of 0.5 or less, compared to 14.22% of the development sample. In the validation sample, 61.18% (n = 93 / 152) had a PAI ≥ 1.92 (the SD in the development sample). Among those with a PAI ≥ 1.92 there was no significant difference in the rate of reliable change between patients who received optimal versus those who received suboptimal treatment (X2 (1) = 0.0004, p = .984). The regression analysis () revealed that, among the n = 93 patients with a PAI ≥ 1.92, receiving model-indicated optimal treatment had no significant effect on post-treatment PHQ-9 score (β = 0.12, p = .168), adjusted for pre-treatment PHQ-9 score (β = 0.61, p < .001) and propensity score (β = −0.03, p = .691). See Supplementary Materials for further details of regression.
Table V. Predicting post-treatment PHQ-9 score (square root transformed) from having received model-indicated optimal treatment, adjusted for pre-treatment PHQ-9 score and propensity score estimate (log transformed), among patients with a PAI > 1.92 (N = 93).
Discussion
This study was the first external validation of a PAI for the treatment of PTSD. Two linear regression models developed using a genetic algorithm were applied to predict outcomes of Tf-CBT and EMDR in a statistically independent sample. In the model development sample (Deisenhofer et al., Citation2018), the Tf-CBT model predicted outcomes for the Tf-CBT group with greater accuracy than the EMDR model; and the EMDR model predicted outcomes for the EMDR group with greater accuracy than the Tf-CBT model. This suggests that each model makes treatment-specific outcome predictions. However, in the current external validation sample, this pattern of results was not replicated. This suggests that these models are simply prognostic models that predict PTSD treatment outcome independent of treatment type, and any differential outcome predicted in the model development sample is due to overfitting of the model to the treatment group.
Unlike the model development sample, in the external validation sample there was no significant difference in rates of reliable improvement between patients who received their model-indicated optimal treatment versus those who received their suboptimal treatment. When the clinical utility of the PAI was tested among patients with a robust treatment recommendation (i.e., PAI ≥ 1SD), receiving optimal treatment was not significantly associated with treatment outcomes. The NNH suggested that for every 41 patients treated with their model-indicated optimal treatment, one additional patient would not attain reliable improvement. However, as highlighted by Kraemer and Kupfer (Citation2006), NNT/NNH is unstable when the difference in the rate of outcome between the treatment and comparator group is close to 0, and as the difference is not statistically significant, NNT/NNH could fluctuate between large positive and large negative values in different samples.
These findings suggest that the PAI model developed by Deisenhofer et al. (Citation2018) does not predict differential treatment outcomes for PTSD in independent data collected from a similar setting. This could be attributed to methodological issues in both the training and testing phases, which will be discussed further below. Nevertheless, the results are in line with previous findings on the transferability of some prediction models for treatment selection to external holdout data from the same (Schwartz et al., Citation2021) and other comparable studies (Van Bronswijk et al., Citation2021).
Limitations of the Model Development Method
In a simulation study, Luedtke et al. (Citation2019) found that a minimum n = 300 patients per treatment group was required to reliably detect predictors of differential treatment response. The sample used by Deisenhofer et al. (Citation2018) to develop the model was considerably smaller than this, with n = 150 patients in the Tf-CBT group and n = 75 in the EMDR group. Concurrently, genetic regression may not be the best method of developing a model for this task. In genetic regression, a genetic algorithm performs predictor selection, but the model parameters are estimated by ordinary linear regression. It is likely that this method, combined with the small sample size led to overfitting of the model. Deisenhofer et al. (Citation2018) applied LOO cross-validation, but this only adjusts optimism when evaluating prediction accuracy, and does not control overfitting that occurs during predictor selection and parameter estimation (Kessler et al., Citation2017).
Alternatively, penalised regression methods such as elastic net control for overfitting during model development by shrinking small coefficients towards zero (Zou & Hastie, Citation2005). Held et al. (Citation2022) applied six different machine learning algorithms to predict PTSD treatment response and in a randomly partitioned hold-out sample found that elastic net was the most accurate (along with gradient boosted models). Herzog et al. (Citation2021) used elastic net to predict PTSD outcomes and found that the model generalised to a hold-out validation sample (training R2 = .17, validation R2 = .16). Delgadillo and Gonzalez Salas Duhne (Citation2020) used elastic net to develop a PAI for two psychological therapies for depression and found a significantly higher rate of reliable improvement for patients who received their model-indicated optimal treatment in a hold-out validation sample. In addition, Delgadillo and Gonzalez Salas Duhne (Citation2020) used a much larger sample (N = 1,435), and applied bootstrapping when estimating model parameters, which has been shown to improve external validity (Steyerberg et al., Citation2003). Bootstrapping may also be a more robust method of internal validation than LOO and similar cross-validation procedures (Steyerberg et al., Citation2001), particularly as the N - 1 “training sets” (or folds) in LOO are unlikely to be substantially different from one another (Hastie et al., Citation2009).
Development of the PTSD PAI model was likely further limited by the available variables. The model development dataset did not contain any measures of PTSD symptoms or trauma-related variables and contained only total scores on the three clinical measures (PHQ-9, GAD-7, and WSAS). Recent studies have found that clinical, PTSD and trauma related variables are better predictors of PTSD treatment outcome than demographic variables (Held et al., Citation2022; Herzog et al., Citation2021; Hoeboer et al., Citation2021; Keefe et al., Citation2018; Stuke et al., Citation2021). In the absence of a PTSD measure, the PHQ-9 was used as a proxy outcome measure. Whilst the PHQ-9 correlates with PTSD severity, it is not clear whether the models predict change in PTSD symptoms, or only change in depressive symptoms. The large proportion of missing values on the IES-R in the validation sample precluded investigation of this. Variables were centred but not standardised, limiting the extent to which these models could be applied in settings with different measures.
Additionally, pre-treatment PHQ-9 score was selected as a predictor in the EMDR model, but not the Tf-CBT model. Hence, the Tf-CBT model predicts post-treatment PHQ-9 without adjusting for pre-treatment PHQ-9 score, and it is questionable whether this is a valid measure of treatment outcome.
Limitations of the Current Study
In a resampling study, Collins et al. (Citation2016) found that a minimum n = 100 was required to obtain reliable estimates of prediction model performance in external validation, and in the current study there were only n = 38 patients in the EMDR group. This was because most patients who received EMDR also received at least one session of CBT, precluding their inclusion in the sample. Recent systematic reviews have found that sample size remains a common limitation of clinical psychology prediction modelling research (Meehan et al., Citation2022; Vieira et al., Citation2022).
There was also considerable missing data, up to 38.8% on LTC. LTC was not a predictor in either of the models, but pre-treatment WSAS (predictor in the Tf-CBT model) was missing 13% in the unmatched Tf-CBT group and 23% in the EMDR group, and medication (predictor in the EMDR model) was missing 19% in the unmatched Tf-CBT group and 10% in the EMDR group. This could have introduced additional biases and given the small number of predictors in each of the models any bias in these variables is problematic. Missing data is a common issue in clinical research, and the proportion missing in this study was comparable with that of Van Bronswijk et al. (Citation2021).
Although there is evidence that missForest outperforms multiple imputation with chained equations, it is not without its limitations, and there are other random forest-based imputation methods that may have some advantages over missForest (Hong & Lynn, Citation2020). The effect of different imputation methods and hyperparameter settings on the accuracy and generalisability of prediction models is yet to be empirically tested. The proportion of missing data on the IES-R measure of PTSD symptoms precluded multiple imputation of this variable and the investigation of the second research question. As the PAI did not generalise to PHQ-9 scores in the external validation sample it appears unlikely that it would have generalised to IES-R scores.
Patients in the model development sample had a significantly higher rate of disability and functional impairment than the validation sample. Differences in samples, including heterogeneity in clinical presentations, treatment delivery, and available predictors can result in poorer model performance in external validation (Hehlmann et al., Citation2023; Van Bronswijk et al., Citation2021). This may have reduced the likelihood that the models would generalise to the external validation sample, particularly as pre-treatment WSAS score was a predictor in the Tf-CBT model. However, it could be argued that personalised treatment prediction models need to be robust to varying distributions of covariates if they are to be implemented in clinical practice. There is evidence that prediction models developed using machine learning methods with a sufficient sample size can generalise to samples recruited from different geographic locations (Bone et al., Citation2021) and at different times (Delgadillo et al., Citation2020).
Most patients did not receive the NICE (Citation2018) recommended 8–12 sessions of Tf-CBT or EMDR. Also, as this study used naturalistic data from routine clinical practice, the treatment sessions were not recorded, and there was no associated treatment integrity check. Therefore, the extent to which therapists adhered to the treatment protocol during each treatment is uncertain. Some therapists may be reluctant to employ trauma-focussed therapeutic techniques due to their concerns that trauma-focussed therapy may be unsuitable or potentially harmful for some patients with PTSD (Murray et al., Citation2022).
Due to the naturalistic setting, patients were not randomised to treatment. PSM was implemented to control for confounding by indication. But, unlike randomisation, PSM only balances observed covariates. Therefore, it’s possible that the two treatment groups systematically differed on unobserved covariates.
Theoretical Considerations
There is debate as to whether Tf-CBT and EMDR act through distinct mechanisms (Landin-Romero et al., Citation2018). If EMDR and Tf-CBT share the same mechanisms of change this could mean that there is no interaction between patient characteristics and the choice between these two treatments, and the finding of Deisenhofer et al. (Citation2018) could be an artefact of overfitting. This is congruent with the common factors model, which argues that the factors shared by all effective forms of psychological therapy are necessary and sufficient to facilitate therapeutic change, and the factors that distinguish different forms of psychological therapy are relatively insignificant (Wampold, Citation2019). However, findings such as those of Delgadillo and Gonzalez Salas Duhne (Citation2020) contradict this perspective. A recent meta-analysis by Nye et al. (Citation2023) found a small but significant superiority of personalised treatment over treatment as usual. When scaled up to the magnitude of a national level delivery programme such as NHS Talking Therapies, such small differences become significant (Barkham, Citation2023).
Future Directions
Future studies should use a larger sample with a PTSD symptom measure as outcome, test different modelling methods, apply bootstrapping during model development and internal validation, and then externally cross-validate in a hold-out test sample, data from another location, or data collected at a later time. After the models have been externally validated in larger samples, then an even more rigorous test is the prospective application and validation of such models by assigning incoming patients to the treatment recommended by the model and comparing this data-informed allocation to a random or clinically intuitive decision (Delgadillo et al., Citation2022; Lutz et al., Citation2022).
In the current dataset, n = 38 patients accessed EMDR as their only high intensity treatment for PTSD, whereas n = 273 patients accessed EMDR as part of an integrated treatment with CBT for PTSD. This suggests that EMDR is most often delivered as part of an integrated cognitive behavioural treatment for PTSD. In which case it would be pertinent to investigate differential treatment response to Tf-CBT versus Tf-CBT with integrated EMDR, similar to the way that Hoeboer et al. (Citation2021) investigated differential response to prolonged exposure alone versus prolonged exposure plus skills training.
Conclusions
The PAI model developed by Deisenhofer et al. (Citation2018) does not generalise beyond the model development sample. Since the external validation presented in this paper is limited by a small sample size, the findings must be interpreted with caution. Nevertheless, this study highlights the importance of external validation in prediction modelling. Additionally, it emphasises important factors to consider during model development, such as sample size, predictor selection method, and internal validation method. This study underlines the need for clinicians to routinely administer PTSD specific outcome measures when delivering trauma treatments in routine practice, so that sufficient data for prediction modelling research is made available. Finally, this study highlights the need for researchers to develop and then externally validate clinical prediction models for those trauma treatments which are most typically delivered in routine services, in order for the models to have maximum applied utility for those delivering and receiving these treatments.
tpsr-2024-0069-File003
Download MS Word (797.1 KB)Acknowledgements
For the purpose of open access, the author has applied a Creative Commons Attribution (CC BY) licence to any Author Accepted Manuscript version arising.
Disclosure Statement
No potential conflict of interest was reported by the author(s).
Supplemental data
Supplemental data for this article can be accessed here at https://doi.org/10.1080/10503307.2024.2360449.
Data Availability Statement
In line with the requirements of the ethics review board for this study, requests for access to data are to be made in writing to the data controller, Michael Barkham, [email protected].
Additional information
Funding
References
- Barkham, M. (2023). Smaller effects matter in the psychological therapies: 25 years on from Wampold et al. (1997). Psychotherapy Research, 33(4), 530–532. https://doi.org/10.1080/10503307.2022.2141589
- Bone, C., Simmonds-Buckley, M., Thwaites, R., Sandford, D., Merzhvynska, M., Rubel, J., Deisenhofer, A.-K., Lutz, W., & Delgadillo, J. (2021). Dynamic prediction of psychological treatment outcomes: Development and validation of a prediction model using routinely collected symptom data. The Lancet Digital Health, 3(4), e231–e240. https://doi.org/10.1016/S2589-7500(21)00018-2
- Clark, D. M., Layard, R., Smithies, R., Richards, D. A., Suckling, R., & Wright, B. (2009). Improving access to psychological therapy: Initial evaluation of two UK demonstration sites. Behaviour Research and Therapy, 47(11), 910–920. https://doi.org/10.1016/j.brat.2009.07.010
- Clark, D. M., & Whittington, A. (2023, January 16). What’s in a name? NHS talking therapies, for anxiety and depression – The new name for IAPT services. NHS England. https://www.england.nhs.uk/blog/whats-in-a-name-nhs-talking-therapies-for-anxiety-and-depression-the-new-name-for-iapt-services/.
- Collins, G. S., Ogundimu, E. O., & Altman, D. G. (2016). Sample size considerations for the external validation of a multivariable prognostic model: A resampling study. Statistics in Medicine, 35(2), 214–226. https://doi.org/10.1002/sim.6787
- D’Agostino, R. B. (1998). Propensity score methods for bias reduction in the comparison of a treatment to a non-randomized control group. Statistics in Medicine, 17(19), 2265–2281. https://doi.org/10.1002/(SICI)1097-0258(19981015)17:19<2265::AID-SIM918>3.0.CO;2-B
- Deisenhofer, A.-K., Delgadillo, J., Rubel, J. A., Bohnke, J. R., Zimmermann, D., Schwartz, B., & Lutz, W. (2018). Individual treatment selection for patients with posttraumatic stress disorder. Depression and Anxiety, 35(6), 541–550. https://doi.org/10.1002/da.22755
- Delgadillo, J., Ali, S., Fleck, K., Agnew, C., Southgate, A., Parkhouse, L., Cohen, Z. D., DeRubeis, R. J., & Barkham, M. (2022). Stratified care vs stepped care for depression: A cluster randomized clinical trial. JAMA Psychiatry, 79(2), 101–108. https://doi.org/10.1001/jamapsychiatry.2021.3539
- Delgadillo, J., & Gonzalez Salas Duhne, P. (2020). Targeted prescription of cognitive–behavioral therapy versus person-centered counseling for depression using a machine learning approach. Journal of Consulting and Clinical Psychology, 88(1), 14–24. https://doi.org/10.1037/ccp0000476
- Delgadillo, J., Rubel, J., & Barkham, M. (2020). Towards personalized allocation of patients to therapists. Journal of Consulting and Clinical Psychology, 88(9), 799–808. https://doi.org/10.1037/ccp0000507
- DeRubeis, R. J., Cohen, Z. D., Forand, N. R., Fournier, J. C., Gelfand, L. A., & Lorenzo-Luaces, L. (2014). The personalized advantage index: Translating research on prediction into individualized treatment recommendations. A demonstration. PLoS One, 9(1), e83875. https://doi.org/10.1371/journal.pone.0083875
- Ehlers, A., Clark, D. M., Hackmann, A., McManus, F., & Fennell, M. (2005). Cognitive therapy for post-traumatic stress disorder: Development and evaluation. Behaviour Research and Therapy, 43(4), 413–431. https://doi.org/10.1016/j.brat.2004.03.006
- Fear, N. T., Bridges, S., Hatch, S., Hawkins, V., & Wessely, S. (2016). Chapter 4: Posttraumatic stress disorder. In S. McManus, P. Bebbington, R. Jenkins, & T. Brugha (Eds.), Mental health and wellbeing in England: Adult psychiatric morbidity survey 2014 (pp. 106–130). NHS Digital.
- Hastie, T., Tibshirani, R., & Friedman, J. H. (2009). The elements of statistical learning: Data mining, inference, and prediction. Springer. https://hastie.su.domains/Papers/ESLII.pdf.
- Hehlmann, M. I., Schwartz, B., Moggia, D., Schaffrath, J., & Lutz, W. (2023). Cross-sample validation of affect and rumination as predictors of outcome in psychological therapy [Manuscript in preparation].
- Held, P., Schubert, R. A., Pridgen, S., Kovacevic, M., Montes, M., Christ, N. M., Banerjee, U., & Smith, D. L. (2022). Who will respond to intensive PTSD treatment? A machine learning approach to predicting response prior to starting treatment. Journal of Psychiatric Research, 151, 78–85. https://doi.org/10.1016/j.jpsychires.2022.03.066
- Herzog, P., Voderholzer, U., Gärtner, T., Osen, B., Svitak, M., Doerr, R., Rolvering-Dijkstra, M., Feldmann, M., Rief, W., & Brakemeier, E. L. (2021). Predictors of outcome during inpatient psychotherapy for posttraumatic stress disorder: A single-treatment, multi-site, practice-based study. Psychotherapy Research, 31(4), 468–482. https://doi.org/10.1080/10503307.2020.1802081
- Hoeboer, C. M., Oprel, D. A. C., De Kleine, R. A., Schwartz, B., Deisenhofer, A. K., Schoorl, M., Van Der Does, W. A. J., van Minnen, A., & Lutz, W. (2021). Personalization of treatment for patients with childhoodabuse-related posttraumatic stress disorder. Journal of Clinical Medicine, 10(19), 4522. https://doi.org/10.3390/jcm10194522
- Hong, S., & Lynn, H. S. (2020). Accuracy of random-forest-based imputation of missing data in the presence of non-normality, non-linearity, and interaction. BMC Medical Research Methodology, 20(1), 199. https://doi.org/10.1186/s12874-020-01080-1
- Keefe, J. R., Stirman, S. W., Cohen, Z. D., DeRubeis, R. J., Smith, B. N., & Resick, P. A. (2018). In rape trauma PTSD, patient characteristics indicate which trauma-focused treatment they are most likely to complete. Depression and Anxiety, 35(4), 330–338. https://doi.org/10.1002/da.22731
- Kessler, R. C., Bossarte, R. M., Luedtke, A., Zaslavsky, A. M., & Zubizarreta, J. R. (2019). Machine learning methods for developing precision treatment rules with observational data. Behaviour Research and Therapy, 120, 103412. https://doi.org/10.1016/j.brat.2019.103412
- Kessler, R. C., Loo, H. M., Wardenaar, K. J., Bossarte, R. M., Brenner, L. A., Ebert, D. D., Jonge, P., Nierenberg, A. A., Rosellini, A. J., Sampson, N. A., Schoevers, R. A., Wilcox, M. A., & Zaslavsky, A. M. (2017). Using patient self-reports to study heterogeneity of treatment effects in major depressive disorder. Epidemiology and Psychiatric Sciences, 26(1), 22–36. https://doi.org/10.1017/S2045796016000020
- Kraemer, H. C., & Kupfer, D. J. (2006). Size of treatment effects and their importance to clinical research and practice. Biological Psychiatry, 59(11), 990–996. https://doi.org/10.1016/j.biopsych.2005.09.014
- Kroenke, K., Spitzer, R. L., & Williams, J. B. (2001). The PHQ-9: Validity of a brief depression severity measure. Journal of General Internal Medicine, 16(9), 606–613. https://doi.org/10.1046/j.1525-1497.2001.016009606.x
- Kyriacou, D. N., & Lewis, R. J. (2016). Confounding by indication in clinical research. Jama, 316(17), 1818–1819. https://doi.org/10.1001/jama.2016.16435. https://jamanetwork.com/journals/jama/article-abstract/2576568.
- Landin-Romero, R., Moreno-Alcazar, A., Pagani, M., & Amann, B. L. (2018). How does eye movement desensitization and reprocessing therapy work? A systematic review on suggested mechanisms of action. Frontiers in Psychology, 9, 1395. https://www.frontiersin.org/articles/10.3389fpsyg.2018.01395.
- Lenhard, W., & Lenhard, A. (2016). Computation of effect sizes. Psychometrica. https://www.psychometrica.de/effect_size.html.
- Luedtke, A., Sadikova, E., & Kessler, R. C. (2019). Sample size requirements for multivariate models to predict between-patient differences in best treatments of major depressive disorder. Clinical Psychological Science, 7(3), 445–461. https://doi.org/10.1177/2167702618815466
- Lutz, W., Deisenhofer, A.-K., Rubel, J., Bennemann, B., Giesemann, J., Poster, K., & Schwartz, B. (2022). Prospective evaluation of a clinical decision support system in psychological therapy. Journal of Consulting and Clinical Psychology, 90(1), 90–106. https://doi.org/10.1037/ccp0000642
- Meehan, A. J., Lewis, S. J., Fazel, S., Fusar-Poli, P., Steyerberg, E. W., Stahl, D., & Danese, A. (2022). Clinical prediction models in psychiatry: A systematic review of two decades of progress and challenges. Molecular Psychiatry, 27(6), 2700–2708. https://doi.org/10.1038/s41380-022-01528-4
- Minami, T., Serlin, R. C., Wampold, B. E., Kircher, J. C., & Brown, G. (2008). Using clinical trials to benchmark effects produced in clinical practice. Quality and Quantity, 42(4), 513–525. https://doi.org/10.1007/s11135-006-9057-z
- Mitchell, M. (1998). An introduction to genetic algorithms. MIT Press.
- Moggia, D., Saxon, D., Lutz, W., Hardy, G. E., & Barkham, M. (2023). Applying precision methods to treatment selection for moderate/severe depression in person-centered experiential therapy or cognitive behavioral therapy. Psychotherapy Research, 1–16. https://doi.org/10.1080/10503307.2023.2269297
- Mundt, J. C., Marks, I. M., Shear, M. K., & Greist, J. M. (2002). The work and social adjustment scale: A simple measure of impairment in functioning. British Journal of Psychiatry, 180(5), 461–464. https://doi.org/10.1192/bjp.180.5.461
- Murray, H., Grey, N., Warnock-Parkes, E., Kerr, A., Wild, J., Clark, D. M., & Ehlers, A. (2022). Ten misconceptions about trauma-focused CBT for PTSD. The Cognitive Behaviour Therapist, 15, e33. https://doi.org/10.1017/S1754470X22000307
- National Collaborating Centre for Mental Health. (2018). The NHS talking therapies manual. https://www.england.nhs.uk/publication/the-improving-access-to-psychological-therapies-manual/.
- National Institute for Health and Care Excellence [NICE]. (2018). Post-traumatic stress disorder (NICE guideline [NG116]). NICE. https://www.nice.org.uk/guidance/ng116.
- NHS Digital. (2022, September 29). Psychological therapies, annual report on the use of IAPT services, 2021-22. NDRS. https://digital.nhs.uk/data-and-information/publications/statistical/psychological-therapies-annual-reports-on-the-use-of-iapt-services/annual-report-2021-22.
- Nye, A., Delgadillo, J., & Barkham, M. (2023). Efficacy of personalized psychological interventions: A systematic review and meta-analysis. Journal of Consulting and Clinical Psychology, 91(7), 389–397. https://doi.org/10.1037/ccp0000820
- Office for National Statistics. (n.d.). Ethnic group, national identity and religion. Retrieved May 17, 2023, from https://www.ons.gov.uk/methodology/classificationsandstandards/measuringequality/ethnicgroupnationalidentityandreligion.
- Richards, D. A., & Borglin, G. (2011). Implementation of psychological therapies for anxiety and depression in routine practice: Two year prospective cohort study. Journal of Affective Disorders, 133(1-2), 51–60. https://doi.org/10.1016/j.jad.2011.03.024
- Robinson, L., Kellett, S., & Delgadillo, J. (2020). Dose-response patterns in low and high intensity cognitive behavioral therapy for common mental health problems. Depression and Anxiety, 37(3), 285–294. https://doi.org/10.1002/da.22999
- Rosenbaum, P. R., & Rubin, D. B. (1983). The central role of the propensity score in observational studies for causal effects. Biometrika, 70(1), 41–55. https://doi.org/10.1093/biomet/70.1.41
- Salazar de Pablo, G., Studerus, E., Vaquerizo-Serrano, J., Irving, J., Catalan, A., Oliver, D., Baldwin, H., Danese, A., Fazel, S., Steyerberg, E. W., Stahl, D., & Fusar-Poli, P. (2021). Implementing precision psychiatry: A systematic review of individualized prediction models for clinical practice. Schizophrenia Bulletin, 47(2), 284–297. https://doi.org/10.1093/schbul/sbaa120
- Schwartz, B., Cohen, Z. D., Rubel, J. A., Zimmermann, D., Wittmann, W. W., & Lutz, W. (2021). Personalized treatment selection in routine care: Integrating machine learning and statistical algorithms to recommend cognitive behavioral or psychodynamic therapy. Psychotherapy Research, 31(1), 33–51. https://doi.org/10.1080/10503307.2020.1769219
- Shapiro, F. (2001). Eye movement desensitization and reprocessing (EMDR): Basic principles, protocols, and procedures. Guilford Press.
- Siontis, G. C. M., Tzoulaki, I., Castaldi, P. J., & Ioannidis, J. P. A. (2015). External validation of new risk prediction models is infrequent and reveals worse prognostic discrimination. Journal of Clinical Epidemiology, 68(1), 25–34. https://doi.org/10.1016/j.jclinepi.2014.09.007
- Spitzer, R. L., Kroenke, K., Williams, J. B., & Löwe, B. (2006). A brief measure for assessing generalized anxiety disorder: The GAD-7. Archives of Internal Medicine, 166(10), 1092–1097. https://doi.org/10.1001/archinte.166.10.1092
- Stekhoven, D. J., & Bühlmann, P. (2012). MissForest—Non-parametric missing value imputation for mixed-type data. Bioinformatics, 28(1), 112–118. https://doi.org/10.1093/bioinformatics/btr597
- Steyerberg, E. W. (2019). Clinical prediction models: A practical approach to development, validation, and updating. Springer Nature.
- Steyerberg, E. W., Bleeker, S. E., Moll, H. A., Grobbee, D. E., & Moons, K. G. M. (2003). Internal and external validation of predictive models: A simulation study of bias and precision in small samples. Journal of Clinical Epidemiology, 56(5), 441–447. https://doi.org/10.1016/S0895-4356(03)00047-7
- Steyerberg, E. W., Harrell, F. E., Borsboom, G. J. J. M., Eijkemans, M. J. C., Vergouwe, Y., & Habbema, J. D. F. (2001). Internal validation of predictive models: Efficiency of some procedures for logistic regression analysis. Journal of Clinical Epidemiology, 54(8), 774–781. https://doi.org/10.1016/S0895-4356(01)00341-9
- Stuart, E. A., King, G., Imai, K., & Ho, D. (2011). MatchIt: Nonparametric preprocessing for parametric causal inference. Journal of Statistical Software, 42(8), 1–28. https://doi.org/10.18637/jss.v042.i08
- Stuke, H., Schoofs, N., Johanssen, H., Bermpohl, F., Ülsmann, D., Schulte-Herbrüggen, O., & Priebe, K. (2021). Predicting outcome of daycare cognitive behavioural therapy in a naturalistic sample of patients with PTSD: a machine learning approach. European Journal of Psychotraumatology, 12(1), 1958471. https://doi.org/10.1080/20008198.2021.1958471
- Van Bronswijk, S. C., Bruijniks, S. J., Lorenzo-Luaces, L., Derubeis, R. J., Lemmens, L. H., Peeters, F. P., & Huibers, M. J. (2021). Cross-trial prediction in psychotherapy: External validation of the Personalized Advantage Index using machine learning in two Dutch randomized trials comparing CBT versus IPT for depression. Psychotherapy Research, 31(1), 78–91. https://doi.org/10.1080/10503307.2020.1823029
- Vieira, S., Liang, X., Guiomar, R., & Mechelli, A. (2022). Can we predict who will benefit from cognitive-behavioural therapy? A systematic review and meta-analysis of machine learning studies. Clinical Psychology Review, 102193. https://doi.org/10.1016/j.cpr.2022.102193
- Wampold, B. E. (2019). A smorgasbord of PTSD treatments: What does this say about integration? Journal of Psychotherapy Integration, 29(1), 65–71. https://doi.org/10.1037/int0000137
- Weiss, D. S. (2007). The impact of event scale: Revised. In J. P. Wilson, & C. Tang (Eds.), Cross-Cultural assessment of psychological trauma and PTSD (pp. 219–238). Springer. https://doi.org/10.1007/978-0-387-70990-1_10
- World Health Organization [WHO]. (2019). F43.1 Post-traumatic stress disorder. In International Statistical Classification of Diseases and Related Health Problems. https://icd.who.int/browse10/2019/en#/F43.
- Zou, H., & Hastie, T. (2005). Regularization and variable selection via the elastic net. Journal of the Royal Statistical Society Series B: Statistical Methodology, 67(2), 301–320. https://doi.org/10.1111/j.1467-9868.2005.00503.x