
ABSTRACT
The Dutch Questionnaire of God Representations (QGR) was investigated by means of item response theory (IRT) modeling in a clinical (n = 329) and a nonclinical sample (n = 792). Through a graded response model and IRT-based differential functioning techniques, detailed item-level analyses and information about measurement invariance between the clinical and nonclinical sample were obtained. On the basis of the results of the IRT analyses, a shortened version of the QGR (S-QGR) was constructed, consisting of 22 items, which functions in the same way in both the clinical and the nonclinical sample. Results indicated that the QGR consists of strong and reliable scales which are able to differentiate among persons. Psychometric characteristics of the S-QGR were adequate.
Introduction
Religion/spirituality is operationalized along numerous dimensions (e.g. Stark & Glock, Citation1968) and measured in multiple ways (e.g., Fetzer Institute, Citation2003; Hill & Hood, Citation1999). One aspect of religiousness is the God representation, which refers to an individual’s mental representations of the individual’s personal God or to the meanings which God/the divine have to a person (Rizzuto, Citation1979; Moriarty & Hoffman, Citation2007; Schaap-Jonker, Citation2008). God representations may comprise both traditional, personal and theistic representations and impersonal, abstract representations (van Laarhoven, Schilderman, Vissers, Verhagen, & Prins, Citation2010; van der Lans, Citation2001).
As a core aspect of religiousness that is intertwined with psychic experience and life history, God representations give insight into the affective quality of the relationship with God/the divine and the meaning of religious behavior (Tisdale et al., Citation1997, p. 228). Several measurement instruments have been developed to measure representations of God, among which the Questionnaire of God Representations (QGR; Gibson, Citation2007; Murken, Möschl, Müller, & Appel, Citation2011; Schaap-Jonker, Eurelings-Bontekoe, Zock, & Jonker, Citation2008; Sharp et al., Citation2013). The QGR has frequently been administered among both clinical groups (i.e., different samples of [psychiatric] patients, both ambulatory patients and inpatients) and nonclinical groups (i.e., samples of individuals without any [psychiatric] diagnosis, belonging to the general population). In this article, the Dutch version of the QGR is examined and refined by means of an item response theory analysis because there is a need for self-report measures of God representations that can discriminate among respondents on the basis of their mental health status, differentiating between emotional and cognitive God representations. Furthermore, there is a need for a shorter version of the QGR, which can be applied in (epidemiological) survey studies.
Item response theory
Like many questionnaires which assess religiousness and spirituality constructs (Hall, Reise, & Haviland, Citation2007), the QGR has never been examined from the perspective of item response theory (IRT), which is now the dominant psychometric theory underlying scale development and analysis (de Ayala, Citation2009; Embretson & Reise, Citation2000). In contrast to classical test theory and factor analytical approaches, IRT modeling provides detailed item-level analysis, which gives more insight into the functioning of individual items and scales and about the relation between construct scores (in this study God representation scores) and item endorsement. In addition, IRT analyses enable the comparison of the functioning of individual items among different samples, giving insight into the meaning that an item has for different groups. In this way, it is possible to compare the God representation scores of psychiatric patients to the scores of individuals without any psychiatric diagnosis. In this journal, Hall, Reise, & Haviland (Citation2007) have applied IRT analysis to the Spiritual Assessment Inventory. However, they conducted their study only among one sample of undergraduate students attending Christian colleges and universities.
Questionnaire of God Representations: multi-dimensional operationalization from a relational perspective
The Questionnaire of God Representations (Murken et al., Citation2011; Schaap-Jonker et al., Citation2008) covers two dimensions, namely the feelings someone experiences in relationship with God/the divine and the beliefs on God’s actions or the divine power. In this way, the list functions as an operationalization of a relational view that understands God representations as comprising both emotional aspects (“heart knowledge” or experiential representations) and cognitive aspects (“head knowledge” or doctrinal representations; cf. Zahl & Gibson, Citation2012; see also Davis, Moriarty, & Mauch, Citation2013; Hall & Fujikawa, Citation2013). This view implies that there is no such thing as one uniform and consistent God representation. Instead, God representations are multi-dimensional processes, emotional and cognitive understandings of God/the divine being dynamically interrelated, and diverse internal and external contextual factors activate different aspects of God representations (Rizzuto, Citation1979; Schaap-Jonker et al., Citation2008; Zahl & Gibson, Citation2012).
From a relational theoretical perspective, which combines insights from attachment theory and object relations theory, one’s emotional understanding of God, or God image, is assumed to reflect subjective experiences of God/the divine (e.g., experiences that are characterized by trust, thankfulness, fear, or disappointment) and is developed through a relational, and initially subconscious, process to which parents and significant others make important contributions (Davis et al., Citation2013; Hall & Fujikawa, Citation2013; Hoffman, Citation2005; Jones, Citation2007; Rizzuto, Citation1979; for an overview of models inspired by psychodynamic theory see Corveleyn, Luyten, & Dezutter, Citation2013). Early interactions with parents are generalized and represented in a preverbal way as “ways of being-with” (Stern, Citation2000, p. xv), resulting in a characteristic mode of relating or attachment style (Bartholomew & Horowitz, Citation1991; cf. Davis et al., Citation2013). The resulting relational and emotional representations of God function as internal working models, guiding and integrating a person’s embodied, emotional experiences in relationship with God, usually at an emotional, implicit, and largely nonverbal level, outside of conscious awareness (Davis et al., Citation2013; Hall & Fujikawa, Citation2013).
One’s cognitive understanding of God, or God concept, is based on what a person learns about God in propositional terms. This is related to the doctrines that are taught and found within the family and the (local) religious culture (e.g., God as the ground of being; Schaap-Jonker et al., Citation2008; cf. Rizzuto, Citation2006). By implication, these cognitive representations are more belief-laden and cortically dominant, in contrast to emotional understandings of God, which tend to be more affect-laden and subcortically dominant. However, these two types of God representations influence each other; as the internalization of beliefs and doctrines on God occurs in a relational, affect-laden context, a person learns about God in an interpretative and selective way (Aletti, Citation2005; Schaap-Jonker, Citation2008).
The QGR has frequently been used in empirical studies in Germany (e.g. Murken, Citation1998; Zwingmann, Müller, Körber, & Murken, Citation2008; Zwingmann, Wirtz, Müller, Körber, & Murken, Citation2006), Belgium (Dezutter, Luyckx, Schaap-Jonker, Büssing, & Hutsebaut, Citation2010), the Netherlands (Braam, Mooi, Schaap-Jonker, van Tilburg & Deeg, Citation2008; Braam, Schaap-Jonker et al., Citation2008; Eurelings-Bontekoe, Hekman-Van Steeg & Verschuur, Citation2005; Schaap-Jonker, Eurelings-Bontekoe, Verhagen, & Zock, Citation2002; Schaap-Jonker, Eurelings-Bontekoe, Zock, & Jonker, Citation2007; Schaap-Jonker et al., Citation2008; Schaap-Jonker, Sizoo, Schothorst-van Roekel & Corveleyn, Citation2013), United Kingdom and Canada (Nguyen, Citation2014). Overall, the list has adequate psychometric properties, according to classical test theory. The structure of the questionnaire, which consists of five different scales (see next), was confirmed by a confirmatory factor analysis (Murken et al., Citation2011). As a self-report instrument, the questionnaire measures the respondents’ chronically accessible representations of God; in other words, the participants report their representations of God which are most readily and consistently activated (cf. Gibson, Citation2007).
In earlier publications, the instrument was named Questionnaire of God Images (QGI) because this translated the original Dutch terms to the closest literal meaning. However, since the list does not measure the (implicit) God image in a strict sense (cf. Davis et al., Citation2013), but intends to tap self-reported mental representations underlying how people experientially relate with their God and how they doctrinally view this God (or divine power), we have changed the name of the instrument. In accordance with recent publications (e.g. Davis et al., Citation2013; Zahl & Gibson, Citation2012), we will refer to it as the Questionnaire of God Representations (QGR) from now on.
Aims of the study
The aims of the present study are threefold. We want to assess (a) whether respondents who differ in terms of mental health status used the QGR items in divergent ways and (b) which items in each scale provide relatively more information about the construct that the scale intends to measure. In this way, we obtain more information about the construct validity of the QGR scales. Consequently, we are able to discern how the QGR can be used among various populations, and this information can be used for the construction of a shortened version of the QGR that can be applied among different populations for research purposes (e.g., survey). Hence, the final aim of this study is (c) to present this shortened version of the QGR (S-QGR), consisting of items which function in the same way in both nonclinical and clinical groups and measure the content of God representations adequately. To make this shortened version more fit for inclusion in larger epidemiological studies, in which only a minimum of items on religion/spirituality are allowed, we decided that a subscale should consist of three to five items.
Method
Participants
A total of 1,121 respondents were included in this study. They participated in one of the studies of Schaap-Jonker et al. (Schaap-Jonker, Eurelings-Bontekoe et al., Citation2007, Citation2008; Schaap-Jonker, Sizoo, Schothorst-van Roekel, & Corveleyn, Citation2013; random sampling within subgroups of psychiatric patients, and people belonging to the general population) or Braam, Mooi et al. (Braam, Schaap-Jonker et al., Citation2008; community study among elders), which were mentioned earlier. All participants of those studies who completed the QGR entirely were included, except those who used only the first answer category (“not at all applicable”), often defining themselves as atheists. 792 persons belonged to the nonclinical sample. The number of persons that received psychotherapy or other mental health care was 329. Characteristics of the two separate samples are shown in . Most respondents were female, in middle age, and belonged to a Protestant denomination. On average, they were regular churchgoers to whom religion was highly salient.
Table 1. Characteristics of Nonclinical and Clinical Sample (N = 1121).
Measurement instruments
Questionnaire of God Representations
The Dutch QGR contains 33 items which are divided into two dimensions. The dimension “feelings towards God” consists of three scales, namely Positive Feelings towards God (e.g. thankfulness, love; POS), Anxiety (ANX), and Anger (ANG) towards God. The dimension “God’s actions” has three scales: Supportive Actions (SUP), Ruling and/or Punishing Actions (RULP), and Passivity (PAS); passivity implies that God does not act. Answers are scored on a five-point scale, ranging from not at all applicable (1) to completely applicable (5). In a validation study, psychometric qualities of the QGR appeared to be adequate (Schaap-Jonker et al., Citation2008). Normative data are available for psychiatric outpatients (clinical data) and the general population (nonclinical data), and for respondents of diverse religious denominations (Schaap-Jonker & Eurelings-Bontekoe, Citation2009). Of the Dutch measurement instruments which address religiousness, the QGR is the only one which provides normative data.
Exploratory factor analyses of the data of the current sample on the dimensions of feelings towards God/the divine and perceptions of or beliefs on God’s actions/divine power yielded comparable results as the analyses that were reported by Schaap-Jonker et al. (Citation2008) and, hence, will not be reported here.
Positive and Negative Affect Schedule
For a first exploration of the validity of the shortened scales (see next), a subsample of 471 persons, with 145 psychiatric patients (i.e., clinical subsample) and 326 persons belonging to the nonclinical sample, also completed the Dutch Positive and Negative Affect Schedule (PANAS), a self-report instrument that was developed by Watson, Clark, and Tellegen (Citation1988) and measures affective state. Positive Affect (PA) represents the extent to which a person feels enthusiastic, active, energetic, and alert, being pleasurably engaged with the environment. Negative Affect (NA) is a general factor of subjective distress, with high NA subsuming feelings of guilt, fear, hostility, and nervousness, as well as anger, contempt, and disgust. A Dutch version of the PANAS was provided by Peeters, Ponds, Boon-Vermeeren, Hoorweg, Kraan and Meertens (Citation1999), who found the PANAS scores to be a reliable and valid instrument. Normative data are available for nonclinical and clinical groups (Peeters et al., Citation1999).
Analyses
Graded response model (GRM)
The basic idea behind IRT models is that psychological constructs are not directly observable (i.e., latent) and that only through the manifest responses of persons to a set of items knowledge about these constructs can be obtained (e.g., Embretson & Reise, Citation2000; Sijtsma & Molenaar, Citation2002). The structure in the manifest responses is explained by assuming the existence of a latent trait, denoted by the Greek letter θ. The parametric graded response model (GRM; Samejima, Citation1969, Citation1997) was applied in this study to obtain more detailed information about the measurement precision of the QGR scales across the latent trait continuum. Ordered response categories, such as Likert-type rating scales like the QGR can be analyzed by the GRM. In the GRM, items are described by a discrimination parameter (a; usually with numerical values between 0.5 and 2.5) and two or more location parameters (b; usually with numerical values between −2.5 and +2.5). The magnitude of the discrimination parameter reflects the degree to which the item is related to the underlying latent trait and can differentiate among persons with different trait levels. High a values mean that the response categories accurately differentiate among trait levels (e.g., between persons who have a high level of extraversion and persons who have a low level of extraversion). The spacing of the ordered response categories along the θ scale is reflected by the location parameters. Therefore, the number of response categories minus 1 is the number of location parameters per item; thus, in our analysis, 5 – 1 = 4. These location parameters bm locate the point at the latent trait continuum where there is a 50% chance of responding in category m or higher. Thus, a θ value higher than bm indicates that those respondents have more than a 50% chance of responding in category m or higher. These a and bm parameters together determine the probability of a participant to respond in a particular response category. The probabilities of responding in a particular response category conditional on θ are described by the category response functions. Figure S1, which can be found as supplemental online material, displays the category response function for item 1 of the SUP scale for the clinical sample, as an illustration. The a value of an item determines the steepness of the lines. Because of the high value for item 1 of the SUP scale, the functions are steep. Items with lower a values have less steep functions. The difficulty parameters determine the distance between the different lines.
We used the program IRTPRO 2.1 (Cai, Thissen, & du Toit, Citation2011) to estimate the item parameters for both groups and to link them to a common metric. In this way the item parameters can be compared. The nonclinical group was used as the reference group and the clinical group as the focal group. In general, the majority (for example, native speakers, or the group with the highest test score) is chosen as the reference group and the minority as the focal group (for example, non-native speakers, or the group with the lowest test score; e.g., Stark, Chernyshenko, & Drasgow, Citation2004). All IRT analyses were performed separately for each QGR scale.
Item and test information
The item information indicates the amount of psychometric information an item provides at each latent trait level and is a function of the discrimination parameter and the probabilities of responding in a certain category. The higher the discrimination parameter (the steeper the category response functions), the more psychometric information an item provides. Individual item information functions can be added across items on a common scale to the test information function, because of the local independence assumption of IRT models. The test information function indicates the amount of psychometric information a test provides at each latent trait level. This psychometric information (both at the item and test level) is related to the measurement precision; the higher the psychometric information, the higher the measurement precision. The standard error of measurement of the latent trait score is inversely related to the square root of the item/test information. The standard error of measurement is 1/√10 = .32 when the information value is equal to 10 for a certain latent trait level.
Shorter version of the QGR
One of the aims of this study is to construct a shorter version of the QGR, that could be used in both a clinical and nonclinical sample. This means that the items should be invariant across groups. One way to investigate measurement invariance is to apply IRT-based differential functioning (DF) techniques. A popular method to detect DF is the likelihood ratio test (LRT; Thissen, Steinberg, & Wainer, Citation1988, Citation1993), using the constrained baseline approach in which all other items are used as anchor items (i.e., items which are invariant across groups). Inflated Type I error rates are a large drawback of this approach (e.g., Kim & Cohen, Citation1995; Woods, Citation2009) because items that are functioning differently across groups are also used as anchor items. Therefore, several researchers have tried to come up with a method to empirically select anchor items. In their overview of those different methods, Meade and Wright (Citation2012), based on simulated data, recommended using the LRT based “maxA5” approach that uses the five nonsignificant DIF items with the highest discrimination parameters as anchor items. Egberink, Meijer, and Tendeiro (Citation2015) investigated whether the “maxA5” approach could be successfully applied using empirical data. Their results showed that the “maxA” approach proposed by Lopez Rivas, Stark, and Chernyshenko (Citation2009) and recommended by Meade and Wright (Citation2012) can only be used when investigating DF in smaller samples, like our sample, and not in larger samples. Egberink et al. (Citation2015) also concluded that it is difficult to recommend a fixed number of anchor items.
Since our aim is to construct a shorter version of the QGR that can be used in both clinical and nonclinical samples (i.e., invariant across groups) and not to provide a full DF report, we use what is known from the DF literature to our advantage. Researchers generally agree that the “maxA” approach is an appropriate way to select anchor items (i.e., items that are invariant across groups). Therefore, we start by conducting a LRT with the AOAA (all-others-as-anchors) approach, which can be done in IRTPRO. From the nonsignificant items, we select the preferred number of items with the highest discrimination parameter for the shorter version. When discrimination parameters have approximately the same value, it will be decided which items will form the shorter scale based on the content of the items.
To explore the validity of the S-QGR, Pearson correlations were computed between the PANAS scales on the one hand and the QGR and S-QGR scales on the other, for both the clinical and nonclinical groups. We assume the S-QGR to be a valid abbreviation of the QGR if the shortened scales show the same correlational pattern with the PANAS as the original scales. The strongest associations are expected between the affect scales (PA, NA) and the feelings dimension (S-)POS, and (S-)ANX of the (S-)QGR.
Results
Descriptive statistics
Table S1, which can be found as supplemental online material, depicts the mean item scores, item-test correlations, coefficient alpha, and Guttman’s lambda-2 for the nonclinical and clinical samples. The mean item scores are very high for the POS and SUP scale in both samples, which indicates that most persons report positive feelings towards God and judge God’s actions as supportive. The spread in the mean item scores for these two scales is small, which could suggest that persons find it hard to distinguish between these items. The largest differences in mean item scores are found for the ANX scale, which indicates that psychiatric patients report more anxiety feelings towards God compared to non-patients. There are also differences in reliability for both samples, as reflected in different values of the item-test correlations, coefficient alpha, and Guttman’s lambda-2. However, reliability of all scales is good (i.e., λ2/α is around .80 or higher), except for the two shortest scales, ANG and PAS. All scales have relatively high item-test correlations. These results indicate that the items in each scale form a scale and that they are related to each other. In general, reliability is lower for the data of the psychiatric patients, with the exception of the ANX and ANG scale.
Due to the small number of items per scale, the ANG and PAS scale are not considered in the following IRT analyses.
IRT analyses
Item and model fit
Before applying the IRT model, some basic assumptions were checked and item and model fit were evaluated. Monotonicity was checked by inspecting the item step response functions (ISRFs) in the computer program MSP5 for Windows (MSP5; Molenaar & Sijtsma, Citation2000). Inspection of the ISRFs showed that all ISRFs were increasing (i.e., no violations), meaning that persons with higher trait levels are more likely to respond in a higher answer category. Like Hall et al. (Citation2007) stated, “Given the very specific and narrow content of the SAI (Spiritual Assessment Inventory) scales and the relatively small number of items on four of the five scales, unidimensionality is almost certain” (p. 165). Given the similarity between the SAI and the QGR in terms of number of items and narrow content, the same reasoning counts for the unidimensionality of the QGR. Furthermore, previous factor analytic research with the QGR (e.g., Schaap-Jonker et al., Citation2008) showed five distinctive unidimensional scales; the same results were found for the samples used for this study.
As suggested by Tay, Meade, and Cao (Citation2015), we used the S-χ2 statistic (Orlando & Thissen, Citation2000, Citation2003) provided by IRTPRO to evaluate the item-fit. In terms of interpretation, Tay et al. (Citation2015) suggested, “For good model-fit, we expect that most items would exhibit nonsignificant p values (p > .05)” (p. 20). This is especially true for the clinical sample, suggesting good model-fit. The values of the item-fit statistics for the nonclinical sample were somewhat lower, but for most items p > .01, suggesting moderate fit (with the exception of the SUP scale with p > .05 for most items).
To evaluate model fit, Tay et al. (Citation2015) suggested using the M2 statistic (Maydeu-Olivares & Joe, Citation2005, Citation2006) provided by IRTPRO, with p > .05 and the accompanying RMSEA close to zero interpreted as good model-fit. For all scales in both groups, p = .0001 and .04 ≤ RMSEA ≤ .06 for the M2 statistic. These results are similar to the example provided in the user’s guide of IRTPRO, namely p < .05 and RMSEA close to zero, suggesting “some lack of fit … however the associated RMSEA value (0.06) suggests this may be due to a limited amount of “model error”; there must be some error in any strong parametric model.” (Tay et al., Citation2015). Furthermore, Tay et al. (Citation2015) noted that more research is needed to determine which combination of p-value and RMSEA indicates good fit, when using the M2 statistic. This recommendation for caution and more research was shared by Maydeu-Olivares (Citation2013) who noted that “such well-fitting applications are rare, and they are more common when binary items are used and when educational contents are measured” (p. 98). At this point it is not clear why that is the case and therefore more research is needed to answer those questions. Also, Thissen (Citation2013) concluded that the interpretation and meaning of different goodness-of-fit statistics is not complete.
Considering the caution of interpreting the fit statistics and given our research question, we concluded that the different results with regard to the IRT assumptions and the fit indicators overall suggested an acceptable fit of our data with the used IRT model.
Estimated item parameters
The estimated item parameters (and their standard errors) for the POS, ANX, SUP and RULP scales are displayed in Table S2, which can be found as supplemental online material. A first observation is that a similar pattern in estimated item parameters is visible for both the nonclinical and clinical groups, namely (very) high discrimination parameters (i.e., > 2.0) and difficulty parameters mostly at one end of the scale. The high
parameters may point at item content redundancy, which is asking the same question twice. For example, items 6 (“security”) and 7 (“love”) of the POS scale have high item parameters, which might suggest that the two concepts of security and love are interpreted as being the same. However, since the constructs that are measured with the QGR are so-called narrow-band measures, the items with the highest item discrimination parameters can also be seen as the “core” items of the construct, especially because the difficulty parameters of those highly discriminating items are approximately similar. This means that those items are clustered together at approximately the same area of the latent trait continuum. This feature could be helpful in constructing a shorter scale.
The difficulty parameters at one end of the scale might indicate that the different parts of the God image, although assumed dimensional, are so-called “quasi-traits.” These are traits that are defined at one end of the latent trait scale. Reise and Waller (Citation2009) mentioned that many psychological constructs are possible “quasi-traits,” for example, aggression, self-esteem, and spirituality. The POS and SUP scale for both groups seem to be defined at the left end of the scale. The parameter values are located around θ = −0.5, which means that persons with θ values somewhat below the mean have more than a 50% chance of responding in category 3 or higher. The
parameter values are even located around 0 < θ < 0.5, which means that persons with a mean score have more than a 50% chance of responding in category 4 or higher. The opposite pattern can be found for the ANX scale, which suggests that this scale is defined at the right end of the latent trait scale. The RULP scale seems to be an exception and seems more dimensional; the difficulty parameters are located at both ends of the latent trait scale. For example, for item 1 from the RULP scale for the psychiatric patients group the difficulty parameters range from
= −0.96 and
= 1.08, which means that persons with a score around one standard deviation below the mean have a more than 50% probability of responding in category 1 or higher, while persons with a score around one standard deviation above the mean have a more than 50% probability of responding in category 4 or higher.
An explanation for the pattern in the difficulty parameters for the POS and SUP scale may be that most persons in the general population and the psychiatric patients group report positive feelings towards God and perceive God’s actions as supportive. With regard to the ANX scale, the explanation may be the opposite: that most persons report, in line with their experiences, low levels of anxiety towards God. Furthermore, the pattern in the difficulty parameters for the RULP scale might indicate that the answers from both persons from the nonclinical and clinical samples are situated around the middle of the scale, meaning that they might have a more neutral perception with regard to God’s actions as ruling and/or punishing.
Information values and measurement precision
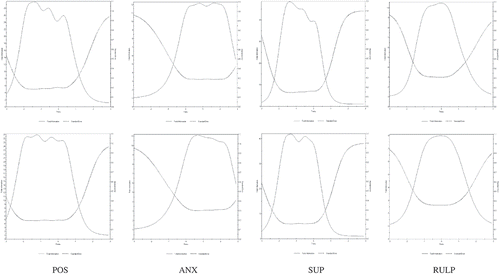
displays the test information functions for the POS, ANX, SUP, and RULP scales for both groups. For the POS, SUP and RULP scale the highest information is located at the lower trait levels for both groups, that is, between scale scores = −1.5 and 0. For the ANX scale, the opposite pattern can be seen for both groups; the highest information being located at the higher trait levels, that is, between
= 0 and 2. In line with this, the item location parameters (see Table S2) are situated at the lower ranges for the POS, SUP, and RULP scales and at the higher ranges for the ANX scale. Furthermore, note that the maximum test information is very high for the longer scales (i.e., around 27 for the POS scale and around 40 for the SUP scale). These two scales have some items with very high discrimination parameters (i.e.,
> 4), resulting in high item information values for those items. Figure S2, which can be found as supplementary online material, displays the item information functions for two of those items. In the nonclinical sample, Item 6 of the POS scale has
= 4.82 and item 8 of the SUP scale has
= 5.01. Furthermore, since item information can be added up to test information, for those two scales the measurement precision is very good for
values between −1.5 and 0.
Figure 1. Test information functions for the POS (positive feelings towards God), ANX (anxiety towards God), SUP (supportive actions), and RULP (ruling and/or punishing actions) scales for the nonclinical (upper panels) and clinical sample (lower panels).
Shorter version of the QGR
The results of the LRT statistics with the AOAA approach (the complete output can be obtained from the authors) showed that all items of the ANX and RULP scale were identified as nonsignificant DF items (i.e., p > .01). So, all of the items could be used in the shorter scale. But since we would like to shorten the scale as much as possible, to make it more fit for inclusion in larger epidemiological studies, we checked whether some of the items performed differently within its scale, but the same in both groups. On the ANX scale, items 4 (“uncertainty”) and 5 (“guilt”) have lower discrimination parameters and somewhat lower item-test correlations. An explanation could be found in the content of the items, as they do not measure anxiety or fear in a strict sense, as items 1, 2, and 3 do, but are related aspects of anxiety. Inspection of the item information functions showed that the functions were flat for items 4 and 5 compared to the functions of items 1, 2 and 3. Because those items do not seem to add much information (and therefore measurement precision), as they seem to be measuring different aspects of anxiety feelings, and because this pattern can be seen in both groups, we decided to remove items 4 and 5 from the ANX scale.
On the RULP scale, a similar pattern can be seen with item 4 (“hell”) for both groups, namely a lower discrimination parameter, a lower item-test correlation, seemingly a different aspect of the construct and also different difficulty parameters. Therefore, we decided to remove item 4 from the RULP scale, which does not detract from its content.
For the POS scale, the results from the LRT statistics with the AOAA approach showed that seven out of the nine items were identified as nonsignificant DF items (p > .01). Only items 3 and 5 were identified as DF items. Since we would like to shorten the scales maximum by half, we selected the five nonsignificant DF items with the highest discrimination parameters for the shorter version. Those are items 1, 2, 6, 7 and 9. From the perspective of the content, the combination of these items makes sense because they seem to measure the “purely” affective items, which tap the attachment relationship (closeness, affection, love). This is discussed next in more detail.
For the SUP scale, the results from the LRT statistics with the AOAA approach showed that only five out of the 10 items were identified as nonsignificant DF items (p > .01). Since we would like to shorten the scales maximum by half, we selected those five items (i.e., items 3, 6, 7, 8, and 10), which are representative for the content of this subscale, for the shorter version.
Subscales and items of the S-QGR are shown in .
Table 2. Items of the Shortened Version of the Questionnaire of God Representations ((S-QGR).
DF using gender as manifest grouping
The results from additional DF analyses for the general population using gender as manifest grouping showed that for both the original scales and the shorter version of the scales, none of the items showed significant DIF (i.e., p > .01) with regard to gender. These analyses were only performed for the general population because the sample sizes for the males and females were large enough in this population to perform parametric IRT analyses (i.e., n > 300) but not in the clinical population.
Reliability
The shorter version of the QGR contains 22 instead of 33 items. In Table S3, which can be found as supplemental online material, item-test correlations and coefficients alpha and Guttman’s lambda2 are depicted.
Validity
To explore the validity of the S-QGR in comparison to the original questionnaire, Pearson correlations with the PANAS were calculated in two subsamples, which are depicted in Table S4, which can be found as supplementary online material.
For most scales of the QGR and the S-QGR, the variations in correlational pattern regarding the relationships with Positive Affect and Negative Affect are minimal. This correspondence suggests that the original and the abbreviated scales are equally adequate in tapping the underlying quasi-traits which form the God representation. As we expected, strongest associations were found between the affective scales and the scales which tap feelings towards God. Perceptions of God (“beliefs regarding God’s actions”) were not related to affective state in this sample, in line with our theoretical model, which points to religious culture as a source for doctrinal God representations (i.e., God concepts; see Davis et al., Citation2013). In this context, there was one exception: for psychiatric patients, higher scores on Positive Affect were related to higher scores on Supportive Perceptions of God’s behavior.
Discussion and conclusions
The Dutch QGR was investigated by means of IRT modeling, providing detailed item-level analyses which give insight into the information value and measurement of the various items and into the way in which the items are used among the clinical and nonclinical subgroup. Results indicate that the QGR consists of strong and reliable scales which are able to differentiate among persons. Reliability coefficients are sufficient for the smallest scales and good for the others; in case of POS and SUP, reliability is extremely high, and the high estimated item parameters indicate item content redundancy. This implies that these scales measure a latent (quasi) trait with a relatively narrow scope.
In addition, results point to differences between the two subgroups in perceptions and experiences of positive feelings towards God and representations of God’s actions as supportive, as there are not only differences in scores but also in how items are associated with a scale. These differences can be explained by their content in relation to the respondent’s different mental health status. For example, the “trust” item of the POS scale functions in a different way among the two subsamples. In the case of psychiatric patients, it is possible that trust is experienced as the opposite of distrust, which is often deeply rooted in their minds, being related to traumatic experiences and other accompanying negative feelings; this interpretation could be examined in follow-up studies. For non-patients, trust may be experienced as a separate category, which is not directly linked to its opposite. For the latter, it is often less difficult to trust another person or God as an ultimate Other than for the former. In the SUP scale, the item “God comforts me” may reflect different views on comfort. Psychiatric patients report to experience less comfort in the religious domain than non-patients. Struggling with difficult personal circumstances, they often expect comfort in a quite concrete way, sometimes hoping for a direct intervention of God. In contrast, for non-patients comfort is a less vital and urgent issue, which, consequently, has a more abstract character. In line with this, the item “God lets me grow” may be interpreted differently within the nonclinical and clinical sample. While non-patients may think of self-actualization (Maslow, Citation1943) or self-realization (Erikson, Citation1958), for psychiatric patients, these identity-related understandings may be outside their scope, as they are often struggling to keep their head above water and to cope with their disorder.
In the S-QGR, non-significant DF items with high information values were included. When we regard these items from a relational theoretical perspective that builds on attachment and object relations theories (Davis et al., Citation2013; Hall & Fujikawa, Citation2013; Jones, Citation2007; Rizzuto, Citation1979), these items fit exactly into this relational perspective. The content of the various scales reflect an attachment relationship with God, which may be characterized by closeness, love, and affection to a supporting, patient, and protecting God who is unconditionally open and/or by feelings of fear of being rejected or punished by a God who judges and exerts power and/or by angry and disappointed feelings because of a God who does not care, leaving people to their own devices.
In this article, we performed an IRT analysis of the QGR comparing two groups according to their mental health status. However, other factors may affect the way in which people understand and use items of this questionnaire. For example, religious denomination is an important factor as well, as we know from other studies (e.g. Schaap-Jonker et al., Citation2008). Therefore, more research is also needed in this regard. Follow-up studies should explicitly take into account the religious background of participants, as Protestants to which religion is fairly (or highly) salient are overrepresented in the current sample.
As a self-report instrument, the QGR only provides insight into the God representations that respondents want to communicate on a conscious level, measuring explicit God representations, which are the God concepts and God images that are most readily and consistently activated (Gibson, Citation2007; Hall & Fujikawa, Citation2013; Sharp et al., Citation2013). By implication, QGR data do not measure implicit God representations; to measure the God representations on a more implicit and largely nonverbal level, outside of conscious awareness, other measures are needed (cf. Hall & Fujikawa, Citation2013; Sharp et al., Citation2013). Furthermore, data might have been prone to social desirability bias. However, in an earlier study on God representations in which respondents were asked for their personal and normative God representations, respondents showed no influence of social desirability, freely reporting discrepancies between what they personally wanted to say and what they should say according to social or religious norms and contexts (Schaap-Jonker et al., Citation2007). Therefore, we assume that most Dutch respondents in an anonymous research context express their explicit God representations in a relatively free way. Regrettably, we were not able to include data regarding social desirability in our analyses, as all data have been collected in several earlier studies which did not provide room for validity scales.
In sum, the Dutch QGR has adequate psychometric characteristics. The original version can be used for scientific research within one population and for diagnostic and therapeutic purpose, tapping a wide range of feelings and perceptions or beliefs regarding God or the divine. The S-QGR is a reliable abbreviation of the QGR, which can be included in survey studies which compare different samples or in epidemiological studies with limited space. Differences in mean scores between the nonclinical and clinical group argue for separate norm groups, which will be provided in a revised manual of the QGR and S-QGR (Schaap-Jonker, Eurelings-Bontekoe & Egberink, Citation2015; for the problem of commingled samples, consisting of respondents from multiple populations, see Waller, Citation2008). More research with this abbreviated instrument is needed, especially on its validity; the first explorations are encouraging.
This article shows the value of analyzing a questionnaire which assesses a religious construct by means of IRT modeling, leading to more insight into the way in which the scales and items are used and understood among different samples. As a result, religiousness and spirituality will be measured in a more precise and sensitive way, both in a research context and in applied contexts such as psychotherapy, spiritual care, or pastoral counseling. As such, the article could be interpreted as a recommendation for more psychometric research from the IRT perspective within the psychology of religion and spirituality.
Supplemental_Material.docx
Download MS Word (59.5 KB)Supplemental data for this article is available on the publisher’s website.
References
- Aletti, M. (2005). Religion as an illusion: Prospects for and problems with a psychoanalytic model. Archive for the Psychology of Religion, 27, 1–18.
- Bartholomew, K., & Horowitz, L. M. (1991). Attachment styles among young adults: A test of a four-category model. Journal of Personality and Social Psychology, 61, 226–244.
- Braam, A. W., Mooi, B., Schaap-Jonker, J., van Tilburg, W., & Deeg, D. J. H. (2008). God image and Five-Factor Model personality characteristics in later life: A study among inhabitants of Sassenheim in The Netherlands. Mental Health, Religion & Culture, 11, 547–559.
- Braam, A.W., Schaap-Jonker, H., Mooi, B., de Ritter, D., Beekman, A. T. F., & Deeg, D. J. H. (2008). God image and mood in old age: Results from a community-based pilot study in the Netherlands. Mental Health, Religion & Culture, 11, 221–237.
- Cai, L., Thissen, D., & du Toit, S. (2011). IRTPRO 2.1 for Windows [computer software]. Lincolnwood, IL: Scientific Software International.
- Corveleyn, J., Luyten, P., & Dezutter, J. (2013). Psychodynamic psychology and religion. In R. F. Paloutzian and C. L. Park (Eds.), Handbook of the psychology of religion and spirituality, second edition (pp. 94–117). New York, NY: The Guilford Press.
- Davis, E. B., Moriarty, G. L., & Mauch, J. C. (2013). God images and god concepts: Definitions, development, and dynamics. Psychology of Religion and Spirituality, 5, 51–60.
- de Ayala, R. J. (2009). The theory and practice of item response theory. New York, NY: Guilford Press.
- Dezutter, J., Luyckx, K., Schaap-Jonker, H., Büssing, A., & Hutsebaut, D. (2010). God image and happiness in chronic pain patients: the mediating role of disease interpretation. Pain Medicine, 11, 765–773.
- Egberink, I. J. L., Meijer, R. R., & Tendeiro, J. N. (2015). Investigating measurement invariance in computer-based personality testing: The impact of using anchor items on effect size indices. Educational and Psychological Measurement, 75, 126–145.
- Embretson, S. E., & Reise, S. P. (2000). Item response theory for psychologists. Mahwah, NJ: Lawrence Erlbaum Associates.
- Erikson, E. H. (1958). Young man Luther: A study in psychoanalysis and history. New York, NY: Norton.
- Eurelings-Bontekoe, E. H. M., Hekman-Van Steeg, J., & Verschuur, M. J. (2005). The association between personality, attachment, psychological distress, church denomination and the God concept among a non-clinical sample. Mental Health, Religion & Culture, 8, 141–154.
- Fetzer Institute/National Institute on Aging Work Group. (2003). Multidimensional Measurement of Religiousness/Spirituality for Use in Health Research. A Report of the Fetzer Institute/National Institute on Aging Working Group. Kalamazoo, MI: Fetzer Institute.
- Gibson, N. J. S. (2007). Measurement issues in God image research and practice. In G. L. Moriarty & L. Hoffman (Eds.), The God image handbook for spiritual counseling and psychotherapy: Research, theory, and practice (pp. 227–246). Binghamton, NY: Haworth Press.
- Hall, T. W., & Fujikawa, A. M. (2013). God image and the sacred. In K. I. Pargament, J. J. Exline, & J. W. Jones (Eds.), APA Handbook of psychology, religion and spirituality (pp. 277–292). Washington, DC: APA.
- Hall, T. W., Reise, S. P., & Haviland, M. G. (2007). An item response theory analysis of the Spiritual Assessment Inventory. The International Journal for the Psychology of Religion, 17, 157–178.
- Hill, P. C., & Hood, R. W., Jr. (Eds.) (1999). Measures of religiosity. Birmingham, AL: Religious Education Press.
- Hoffman, L. (2005). A developmental perspective on the God image. In R. H. Cox, B. Ervin-Cox, & L. Hoffman (Eds.), Spirituality and psychological health (pp. 129–147). Colorado Springs, CO: Colorado School of Professional Psychology Press.
- Jones, J. W. (2007). Psychodynamic theories of the evolution of the God image. In G. L. Moriarty & L. Hoffman (Eds.), The God image handbook for spiritual counseling and psychotherapy: Research, theory, and practice (pp. 33–55). Binghamton, NY: Haworth Press.
- Kim, S. H., & Cohen, A. S. (1995). A comparison of Lord’s chi-square, Raju’s area measures, and the likelihood ratio test on detection of differential item functioning. Applied Measurement in Education, 8, 291–312.
- Lopez Rivas, G. E., Stark, S., & Chernyshenko, O. S. (2009). The effects of referent item parameters on differential item functioning detection using the free baseline likelihood ratio test. Applied Psychological Measurement, 33, 251–265.
- Maslow, A. H. (1943). A theory of human motivation. Psychological Review, 50, 370–396.
- Maydeu-Olivares, A. (2013). Goodness-of-fit assessment of item response theory models. Measurement: Interdisciplinary Research and Perspectives, 11, 71–101.
- Maydeu-Olivares, A., & Joe, H. (2005). Limited and full information estimation and testing in 2n contingency tables: A unified framework. Journal of the American Statistical Association, 100, 1009–1020.
- Maydeu-Olivares, A., & Joe, H. (2006). Limited information goodness-of-fit testing in multidimensional contingency tables. Psychometrika, 71, 713–732.
- Meade, A. W., & Wright, N. A. (2012). Solving the measurement invariance anchor item problem in item response theory. Journal of Applied Psychology, 97, 1016–1031.
- Molenaar, I. W., & Sijtsma, K. (2000). MSP5 for Windows. User’s manual. Groningen, The Netherlands: ProGAMMA.
- Moriarty, G. L., & Hoffman, L. (2007). Introduction and overview. In G. L. Moriarty & L. Hoffman (Eds.), The God image handbook for spiritual counseling and psychotherapy: Research, theory, and practice (pp. 1–9). Binghamton, NY: Haworth Press.
- Murken, S. (1998). Gottesbeziehung und psychische Gesundheit: Die Entwicklung eines Modells und seine empirische Überprüfung [Relationship to God and mental health: The development of a model and its empirical validation]. Münster, Germany: Waxmann.
- Murken, S., Möschl., K., Müller, C., & Appel, C. (2011). Entwicklung und Validierung der Skalen zur Gottesbeziehung und zum religiösen Coping [Development and validation of the scales concerning relationship with God and religious coping]. In A. Büssing & N. Kohls (Eds.), Spiritualität transdisziplinär: Wissenschaftliche Grundlagen im Zusammenhang mit Gesundheit und Krankheit (pp. 75–91). Berlin/Heidelberg, Germany: Springer.
- Nguyen, T.T. (2014). Images of God, resilience, and the imaginary: A study among Vietnamese immigrants who have experienced loss. Ottawa, dissertation. Retrieved from https://www.ruor.uottawa.ca/bitstream/10393/31199/1/Nguyen_ThanhTu_2014_Thesis.pdf
- Orlando, M., & Thissen, D. (2000). Likelihood-based item fit indices for dichotomous item response theory models. Applied Psychological Measurement, 24, 50–64.
- Orlando, M., & Thissen, D. (2003). Further investigation of the performance of S-X2: An item fit index for use with dichotomous item response theory models. Applied Psychological Measurement, 27, 289–298.
- Peeters, F. P. M. L., Ponds, R. W. H. M., Boon-Vermeeren, M. T. G., Hoorweg, M, Kraan, H., & Meertens, L. (1999). Handleiding bij de Nederlandse vertaling van de Positive and Negative Affect Schedule (PANAS) [Manual of the Dutch Translation of the Positive and Negative Affect Schedule (PANAS)]. Maastricht, The Netherlands: Universiteit Maastricht, Vakgroep Psychiatrie en Neuropsychologie.
- Reise, S. P., & Waller, N. G. (2009). Item response theory and clinical measurement. Annual Review of Clinical Psychology, 5, 27–48.
- Rizzuto, A.-M. (1979). The birth of the living God. Chicago, IL: University of Chicago Press.
- Rizzuto, A.-M. (2006). Discussion of Granqvist’s article “On the relation between secular and divine relationships: An emerging attachment perspective and a critique of the ‘depth’ approaches. International Journal for the Psychology of Religion, 16, 19–28.
- Samejima, F. (1969). Estimation of Latent Ability Using a Response Pattern of Graded Scores (Psychometric Monograph No. 17). Richmond, VA: Psychometric Society.
- Samejima, F. (1997). Graded response model. In W. J. van der Linden & R. K. Hambleton (Eds.), Handbook of modern item response theory (pp. 85–100). New York, NY: Springer-Verlag.
- Schaap-Jonker, H. (2008). Before the face of God: an interdisciplinary study of the meaning of the sermon and the hearer’s God image, personality and affective state. Zürich, Switzerland: LIT Verlag.
- Schaap-Jonker, H., & Eurelings-Bontekoe, E. H. M. (2009). Handleiding Vragenlijst Godsbeeld. Versie 2 [Questionnaire God Image: Manual. Second edition]. Retrieved from www.hannekeschaap.nl
- Schaap-Jonker, H., Eurelings-Bontekoe, E. H. M., & Egberink, I. J. L (2015). Herziene Handleiding Vragenlijst Godsbeeld/ Verkorte Vragenlijst Godsbeeld [Revised Manual of the Questionnaire God Representations and Shortened Questionnaire God Representations]. Manuscript in preparation.
- Schaap-Jonker, H., Eurelings-Bontekoe, E. H. M., Verhagen, P. J., & Zock, H. (2002). Image of God and personality pathology: an exploratory study among psychiatric patients. Mental Health, Religion & Culture, 5, 55–71.
- Schaap-Jonker, H., Eurelings-Bontekoe, E. H. M., Zock, H., & Jonker, E. R. (2007). The personal and normative image of God: the role of religious culture and mental health. Archive for the Psychology of Religion, 29, 305–318.
- Schaap-Jonker, H., Eurelings-Bontekoe, E. H. M., Zock, H., & Jonker, E. R. (2008). Development and validation of the Dutch Questionnaire God Image. Mental Health, Religion and Culture, 11, 501–515.
- Schaap-Jonker, H., Sizoo, B., Schothorst-van Roekel, J., & Corveleyn, J. (2013). Autism spectrum disorders and the image of God as a core aspect of religiousness. The International Journal for the Psychology of Religion, 23(2), 145–160.
- Sharp, C. A., Zahl, B. P, Davis, E. B., Davis, D. E., Hook, J. N., & Gibson, N. J. S. (August 2013). Evidence-Based Recommendations for the Assessment of God Representations. Presentation at the American Psychological Association in Honolulu, Hawaii.
- Sijtsma, K., & Molenaar, I. W. (2002). Introduction to Nonparametric Item Response Theory. Thousand Oaks, CA: Sage.
- Stark, S., Chernyshenko, O. S., & Drasgow, F. (2004). Examining the effects of differential item (functioning and differential) test functioning on selection decisions: When are statistically significant effects practically important? Journal of Applied Psychology, 89, 497–508.
- Stark, R., & Glock, C. (1968). Patterns of religious commitment. Berkeley, CA: University of California Press.
- Stern, D. N. (2000). The interpersonal world of the infant: A view from psychoanalysis and developmental psychology. New York, NY: Basic Books.
- Tay, L., Meade, A. W., & Cao, M. (2015). An overview and practical guide to IRT measurement equivalence analysis. Organizational Research Methods, 18, 3–46.
- Thissen, D. (2013). The meaning of goodness-of-fit tests: Commentary on “Goodness-of-fit assessment of item response theory models.” Measurement: Interdisciplinary Research and Perspectives, 11, 123–126.
- Thissen, D., Steinberg, L., & Wainer, H. (1988). Use of item response theory in the study of group differences in tracelines. In H. Wainer & H. I. Braun (Eds.), Test validity (pp.147–172). Hillsdale, NJ: Erlbaum.
- Thissen, D., Steinberg, L., & Wainer, H. (1993). Detection of differential item functioning using the parameters of item response models. In P. W. Holland & H. Wainer (Eds.), Differential item functioning (pp. 67–113). Hillsdale, NJ: Erlbaum.
- Tisdale, T. C., Key, T. L., Edwards, K. J, Brokaw, B. F., Kemperman, S. R., Cloud, H, Townsend, J., & Okamoto, T. (1997). Impact of treatment on God image and personal adjustment, and correlations of God image to personal adjustment and object relations development. Journal of Psychology and Theology, 25, 227–239.
- van der Lans, J. (2001). Empirical research into the human images of God. A review and some considerations. In H.-G. Ziebertz, F. Schweitzer, H. Häring, & D. Browning (Eds.), The human image of God (pp. 347–360). Leiden, The Netherlands: Brill.
- van Laarhoven, H. W. M., Schilderman, J., Vissers, K. C., Verhagen, C. A. H. H. V. M., & Prins, J. (2010). Images of God in relation to coping strategies of palliative cancer patients. Journal of Pain and Symptom Management, 40(4), 495–501.
- Waller, N. G. (2008). Commingled samples: A neglected source of bias in reliability analysis. Applied Psychological Measurement, 32, 211–223.
- Watson, D., Clark, L. A., & Tellegen, A. (1988). Development and validation of brief measures of positive and negative affect: The PANAS scales. Journal of Personality and Social Psychology, 54, 1063–1070.
- Woods, C. M. (2009). Empirical selection of anchors for tests of differential item functioning. Applied Psychological Measurement, 33, 42–57.
- Zahl, B. P., & Gibson, N. J. S. (2012). God representations, attachment to God and satisfaction with life: A comparison of doctrinal and experiential representations of God in Christian young adults. The International Journal for the Psychology of Religion, 22, 216–230.
- Zwingmann, C., Müller, C., Körber, J., & Murken, S. (2008). Religious commitment, religious coping and anxiety: A study in German patients with breast cancer. European Journal of Cancer Care, 17, 361–370.
- Zwingmann, C., Wirtz, M., Müller, C., Körber, J., & Murken, S. (2006). Positive and negative religious coping in German breast cancer patients. Journal of Behavioural Medicine, 29, 533–547.