Abstract
The transition from jail to community is a high-risk time for individuals experiencing substance use disorders (SUD), with elevated risks of overdose and other substance-related harms, as well as high recidivism rates and re-incarceration. Gains made from successful treatment in prison are often lost in this transition. The current paper evaluates this process for one justice programme, Chesterfield HARP, a Therapeutic Community based in the Chesterfield County jail that continues supporting former inmates through their release by examining engagement and retention rates and changes in recovery capital among incarcerated individuals before incarceration and after transition to recovery housing in the community. Adult prisoners (both male and female) who engaged in the Chesterfield HARP programme completed an assessment of recovery capital (REC-CAP instrument) while in prison and following their transitions to one of a number of local recovery residences with strong links to the prison programme (ensuring continuity of care and support). The results suggest successful bridging with positive growth across multiple recovery capital domains. The study provides further evidence for the importance of continuity of care and integrated models of strength-building and recovery-focused interventions in successfully bridging the transition from prison to the community for offenders with a SUD history.
There is long-established literature showing the strong association between substance use and crime, with Bennett and Holloway (Citation2004) reporting that 69% of individuals arrested had used at least one illegal drug. Similarly, Mumola and Karberg (Citation2007) found that just over half of those incarcerated had used drugs during the month before their offense. This is reflected in the prevalence rates of substance use in justice settings—approximately 10% of individuals on probation or parole and 65% of the US prison population have a current substance use disorder (National Institute on Drug Abuse, Citation2020), while another 20% were under the influence of a substance when their crime was committed (Substance Use and Mental Health Services Administration, 2018). Best et al. (Citation2016) have argued that not only is there a strong association between the occurrence of substance use and offending, but this association also extends to remission from both behaviors (referred to as recovery and desistance, respectively).
Recovery has been characterized as “a voluntarily maintained lifestyle characterized by sobriety, personal health and citizenship” (Betty Ford Institute Consensus Group, Citation2007), while a more recent definition of recovery generated through synthesizing the ten most common definitions of recovery framed the concept as “an individualized, intentional, dynamic, and relational process involving sustained efforts to improve wellness” (RSRC; Ashford et al., Citation2019). Justice involvement can act as a barrier to recovery through increased stress levels, reduced acquisition of coping skills or other necessary resources for daily life, and re-engagement with groups and individuals associated with substance use (Facchin & Margola, Citation2016).
Recent attempts to characterize the strengths and barriers associated with recovery have used the term “recovery capital” originally defined as “…the sum of one’s total resources that can be brought to bear in an effort to overcome alcohol and drug dependency” (Granfield & Cloud, Citation1999, p. 179). More recently, Best and Ivers have defined recovery capital as the “resources and capacities that enable growth and human flourishing” (Best & Ivers, Citation2021, p. 157), extending the definition to beyond the point where substance problems cease and broader life challenges and aspirations are addressed. Recovery capital provides a metric and a method for assessing individual progress, although Cloud and Granfield (Citation2008) have warned that recovery capital can be negative as well as positive. In the former category, they included imprisonment, which they regarded as a fundamental impediment to growing recovery capital resources and strengths due to the loss of positive social supports outside of prison and through stigmatization and exclusion.
Though there is evidence that re-offending rates are not generally impacted by interventions received in prison (Cullen et al., Citation2011), there is moderate support for prison-based interventions that use a Therapeutic Community (TC) model. Vanderplasschen et al. (Citation2013) reported that approximately two-thirds of prison TC studies show improvements in substance use, psychological health, social functioning and recidivism. The TC model is based on the concept of “community as method” (DeLeon, Citation2000), in which participants are immersed in a shared and communal journey of personal and social identity change through active participation in community life and a phased journey of personal transformation. However, as Vanderplasschen et al. (Citation2013) have argued, one of the key determinants of the effectiveness of a TC is based on continuity of care and the degree of support available on release from prison.
Recovery residences represent one of the main options for individuals leaving prison in the US and seeking to continue their recovery journey. Humphreys and Lembke (Citation2013) have argued that, alongside 12-step mutual aid groups and peer-delivered interventions, recovery residences are one of only three evidenced recovery interventions. There is a strong supportive evidence base for recovery residences showing that living in a recovery house is generally associated with reduced substance use (Groh et al., Citation2009; Jason et al., Citation2007; Polcin et al., Citation2010), reduced psychiatric symptoms (Mahoney et al., Citation2013), and improved coping strategies (Mericle et al., Citation2019). Critically, length of stay in a recovery residence is associated with a lower rate of post-release recidivism (Hiller et al., Citation1999), decreased re-incarceration rates (Prendergast et al., Citation2004) and reduced rates of re-arrest, sustained at 18-year follow-up (Martin et al., Citation2011).
More recent research has shown the beneficial effects of recovery residence engagement on recovery capital growth in both Florida (Härd et al., Citation2022) and Virginia (Best et al., Citation2023), using the REC-CAP (Cano et al., Citation2017) which attempts to supplement measures of personal and social recovery capital from the Assessment of Recovery Capital (Groshkova et al., Citation2013), with a measure of engagement in community recovery groups (Groshkova et al., Citation2011) and a measure of commitment to sobriety (Kelly & Greene, Citation2014). Across both studies, there is evidence that barriers to recovery and unmet needs diminish following admission to a recovery residence. Recovery strengths and resources grow, from admission to more than one year later, in samples that include large populations accessing the recovery residences direct from jail or prison. Both studies also show that recovery capital growth is associated with increases in participation in peer-based mutual aid recovery communities.
The current study builds on prior research by examining recovery capital trajectories among incarcerated individuals engaged in a prison therapeutic community (TC) programme who transitioned to recovery residences upon release. The following research questions were addressed:
RQ1: What is the retention rate in recovery residences for people coming from a prison TC (described below) compared to residents recruited from non-justice sources?
RQ2: What predicts retention in residences within the group of people recruited from a specialist prison TC?
RQ3: Does recovery capital grow across the transition from a prison TC to a recovery residence?
RQ4: Is the ongoing trajectory of recovery capital growth different for those recruited from a prison TC than for residents recruited from other locations?
Method
Setting
Helping Addicts Recover Progressively (HARP) is a mixed-gender, two-phased programme based on medical, therapeutic and educational processes delivered within the Chesterfield County Jail in Richmond, Virginia. The program is voluntary, not linked to justice conditions, and operates on a democratic and peer-based philosophy. A key element of the program is peer-to-peer counseling and a family support program, and crucially for the current study, a strong partnership with several recovery residences. Although the first phase is roughly six months in duration, there are no fixed times for program completion, and the program is distinctive in that individuals no longer in jail may continue to participate in the program, which includes Narcotics Anonymous (NA) engagement and the opportunity to train as a peer recovery specialist. In an evaluation conducted by Virginia Commonwealth University (Cook et al., Citation2019), graduation from the HARP program was associated with less frequent re-arrest, with 71.6% of HARP graduates not re-arrested after their most recent release from jail (across varying time periods) of up to 14 months. For individuals leaving the HARP program to access recovery residences, there is a partnership with several recovery residences certified through the Virginia Association of Recovery Residences (VARR). According to the National Association of Recovery Residences (Citation2012) a Level 2 residence (described as Monitored Recovery Residences) offers a minimal level of support and structure (including a house manager who is often compensated for their role) with limited access to external resources, and peer run groups and a clear set of policies and procedures for the running of the house. Level 3 (Supervised Recovery Residences) affords a higher degree of structure typically for people transitioning for treatment with the emphasis on life skills development. Completion of the REC-CAP is a requirement for recovery residences in Virginia who receive state funds so there is complete coverage of all state-funded residences.
For the SRR group, this is all other admissions to certified recovery residences in Virginia, which will typically include around 60% referred from justice sources (including jail and probation), as well as referrals from specialist treatment settings who would be classed as voluntary admissions. For both groups, transfer to the recovery residence may be mandated through justice sources but will also include voluntary referrals from treatment.
Measures
The study used the REC-CAP tool, a measure of recovery capital that is a compendium of established tools with acceptable psychometric properties (Cano et al., Citation2017). The REC-CAP was completed at least once during the participant’s time in jail and at least once further on entering the recovery residence following their release from jail. The baseline REC-CAP completion was within 72 h of admission to the recovery residence. The REC-CAP contains five recently experienced barriers to recovery (problems with accommodation including eviction; recent substance use; recent injecting risk behavior; ongoing involvement in crime or the criminal legal system and lack of meaningful activities), participant perceptions of unmet support needs around housing, drug and alcohol treatment, mental health treatment, primary care support, family and relationship help, and criminal legal support) as well as four areas of strengths—personal and social recovery capital, recovery group involvement and motivation.
The REC-CAP consists of the following established validated research tools: The Assessment of Recovery Capital [ARC] (Groshkova et al., Citation2013); The Recovery Group Participation Scale [RGPS] (Groshkova et al., Citation2011); The Commitment to Sobriety Scale [CSS] (Kelly & Greene, Citation2014); The wellbeing measures from the Treatment Outcome Profile (Delgadillo et al., Citation2013) and Barriers to recovery scale adapted from the Treatment Outcome Profile (Delgadillo et al., Citation2013).
The REC-CAP is administered as close to admission as the house manager feels is appropriate to get meaningful and accurate responses, then around day 45, day 90, and at 90-day intervals thereafter.
Information on clients was derived from the Advanced Recovery Management System (ARMS) that included summary data on a total of 1,978 individuals who received a baseline REC-CAP assessment from their first admission into the program. To ensure that we were comparing like with like, we deployed a quasi-experimental approach to deriving a treatment effect by weighting the characteristics of the people receiving the HARP intervention (n = 126) to create a derived group of individuals with similar characteristics (the “counterfactual group”: defined for this paper as Standard Recovery Residents [SRR], n = 1,852). The counterfactual group was derived from individuals who completed the REC-CAP from all recovery houses certified by the Virginia Association of Recovery Residences (VARR). The coverage of responses from VARR-certified residences using the REC-CAP was estimated to be complete at 100%, as it was a funding requirement for receiving state payments. As we were interested in understanding the evolution in time an individual’s recovery scores the rate of engagement with HARP and SRR based on completed REC-CAP assessments is shown below in (people with only the baseline REC-CAP measure were excluded). This shows a large degree of attrition from baseline to subsequent assessments.
Table 1. Assessment numbers (total for each REC-CAP assessment) from baseline assessment for HARP and SRR groups.
To start the process of the creation of a balanced counterfactual group, twenty-three potential measures shown were screened for inclusion in this step.
The mean of 15 binary measures (five barriers, eight needs, ethnicity and gender) is analogous to a proportion, shown as a percentage in . Ethnicity is the percentage of individuals recorded as White, and Gender shows the percentage of males. shows that people enrolled in the HARP program were more likely to have criminal justice needs (86.5% compared to 62.3% of standard recovery residents (SRR)) and a higher level of unmet needs, except for alcohol treatment needs. HARP residents were less likely to be reported as white: 25.4% compared to 34.0% of SRRs. Most numeric measures also show differences between the two groups, notably the satisfaction with accommodation scale: HARP residents have an average score six points lower than SRRs. Note how similar the average baseline REC-CAP score is for the two groups: 37.4 for SRR and 38.1 for HARP.
Table 2. Comparison between HARP and SRR groups at baseline (summary means for binary and numerical measures).
Analytical approach
Standard regression methods for observational studies are known to yield biased results due to the lack of a random treatment allocation mechanism, so a causal treatment effect approach is deployed instead (Hernán & Robins, Citation2020). Our aim was to create a suitable comparison group (SRR) to the HARP treatment group by using the REC-CAP dataset used by VARR-certified recovery residences. This was achieved by balancing the baseline characteristics of people in recovery housing through weighting each person in the full dataset by the inverse probability of receiving treatment. To achieve this counterfactual group, the results for the two derived outcomes are obtained using Inverse Proportional Weighs (IPW) with a Regression Adjustment or IPWRA (often termed a doubly robust method, Linden et al., Citation2016) to estimate the potential outcome means for both intervention groups. The modeling tool in Stata release 16 are the commands—teffects ipwra—for the binary disengagement outcome and—stteffects ipwra—for the retention length outcome.
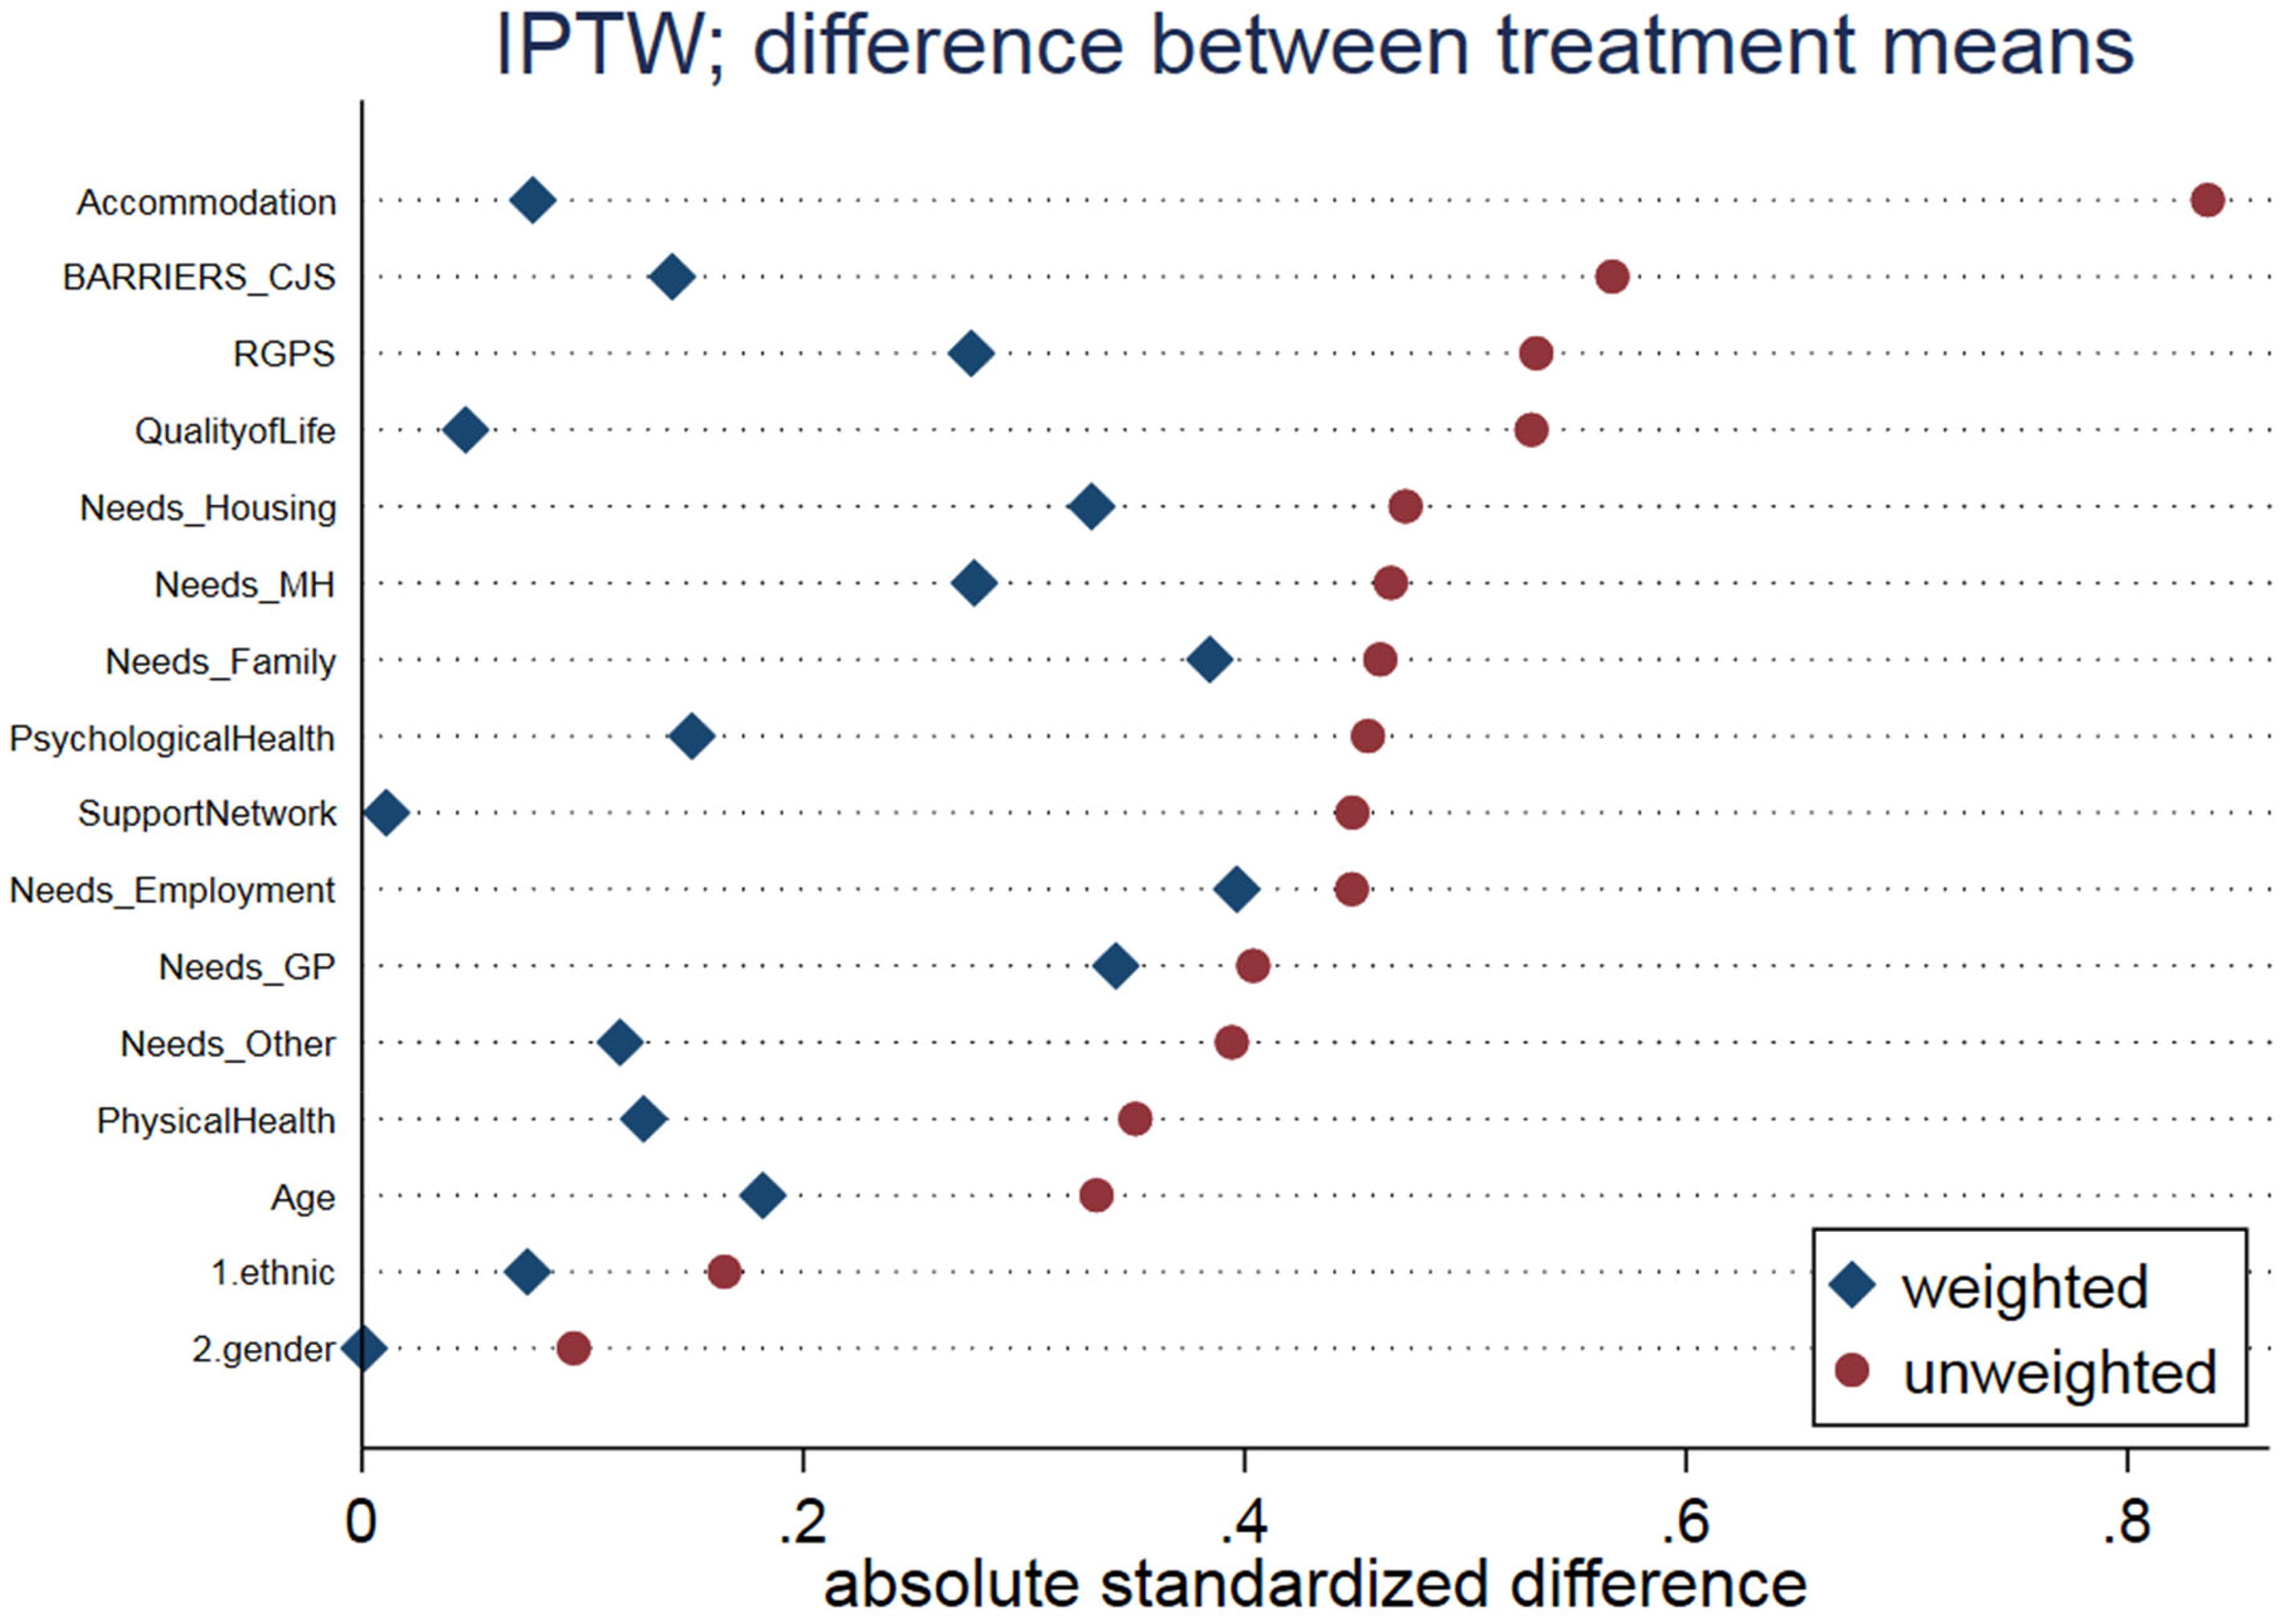
Following the creation of a counterfactual comparison group, covariate balance achieved between the two groups was examined by summarizing group differences before and after the weighting exercise. A plot of absolute standardized differences presented in Appendix A (Austin & Stuart, Citation2015) shows that the mean of these prognostics across the two intervention groups is more balanced when weighted than when unweighted, confirmed by an overidentification hypothesis test (Imai & Ratkovic, Citation2014). Note that a subset of 16 prognostics were considered was included in deriving the weights with the remainder excluded because their absolute standardized difference was inferior after weighting than before it.
Statistical methods
We describe the statistical methods used for analysis following guidelines in the TREND statement (Des Jarlais et al., Citation2004). To evaluate the effectiveness of the HARP program against the derived counterfactual group (SRR), we examined four outcome measures: (1) disengagement rate, (2) retention length and evolution in time of (3) REC-CAP and (4) Recovery Group Participation Scores (RGPS) scores. We derived the disengagement rate by dichotomizing individuals into whether they had maintained contact with the HARP program by completing a subsequent REC-CAP assessment. The last REC-CAP assessment completed in jail was assumed to be associated with leaving the program (and recovery housing for the counterfactual group). We derived the retention length outcome as the number of days between the first and last REC-CAP assessment dates (for both time spent in the HARP programme and in the subsequent time spent in recovery residences). Hence this outcome exists conditional on the client engaging with the program.
To examine the change over time for recovery capital, we derived change from baseline scores for both REC-CAP and RGPS to a maximum of eight assessments thereafter. To model such longitudinal changes, we first compute inverse propensity scores by modeling the probability of treatment assignment using a logistic model with HARP/SRR as a binary outcome and its association with a collection of prognostics (Cole & Hernán, Citation2008). Propensity scores are computed twice: once with time-invariant prognostics only and once with both time-invariant and time-varying prognostics; then the two propensity scores are combined into a ratio called stabilized inverse probability weights (Cole & Hernán, Citation2008).
To derive propensity scores for the numerator of the ratio, we included a set of 24 time-invariant prognostics derived from the REC-CAP assessment in the binary model for treatment selection: age, gender, ethnicity and 21 baselines of all time-varying variables [psychological health, physical health, quality of life, accommodation, support network, five barriers, eight needs, social support, commitment and a recovery score] plus the categorical effect of visit, for a total of 25 prognostics. To derive propensity scores for the denominator of the ratio, we included the same 25 prognostics used in the numerator, plus another 21 time-varying prognostics, i.e. all time-varying variables except for the change in recovery score that is being modeled. The procedure described here follows the method outlined in Faries et al. (Citation2010) to model the change from baseline of the two recovery scores (REC-CAP and RGPS) to assess the effect of each intervention at each assessment (HARP and SRR).
Results
Engagement rate and retention length
The model estimates the rate of disengagement, which is 16.3 percentage points lower for the HARP participants than for the SRR group (95% CI [−27.5%, −5.1%]). For retention length, the marginal model framework estimates that if all clients were allocated to HARP, the retention length would be 25 days longer than on SRR. However, this difference was not statistically significant (p-value = 0.466 with 95% CI (−42, 92) days) ().
Table 3. Average treatment effect estimator of disengagement and retention length from recovery residences: HARP compared to SRR.
Changes in recovery capital from baseline score
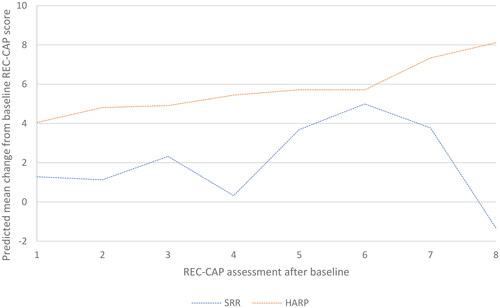
Changes in recovery capital were measured through longitudinal changes in the REC-CAP score from baseline, with a specific focus on one component of the REC-CAP, assessed by changes in the RGPS score. Fitting a marginal structural model to repeated measures shows that the mean change in REC-CAP scores is statistically significantly different between HARP and SRR groups (p-value 0.008) averaged over each visit. Overall, there is a consistent and steady upward trend in the REC-CAP score from baseline for people in the HARP program relative to SRR (for the first REC-CAP available for that participant whether it was completed while in the HARP program or in the recovery residence (for the SRR group)), where fluctuations in the REC-CAP scores over each assessment are noted. Shifting all clients to the HARP program would result in a significantly higher increase in the mean REC-CAP change from the baseline. For the SRR group, there is a gradual improvement in REC-CAP scores to the sixth assessment, and then a dramatic deterioration in scores. While the numbers involved are low, this change is not consistent with previous findings in residence populations (Härd et al., Citation2022; Best et al., Citation2023) ().
Figure 1. Generalized Estimated Equation (GEE) model with stabilized weights for changes in REC-CAP from baseline: HARP compared to SRR.
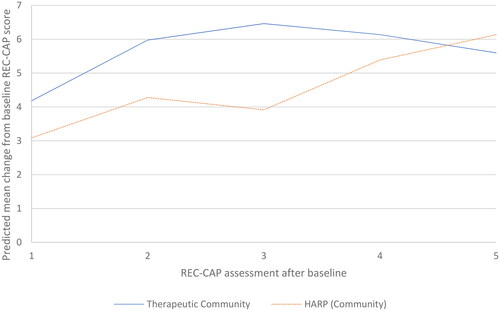
We refined this model by testing whether there was a difference in REC-CAP scores for people in the HARP program who were assessed within the jail (as part of the Therapeutic Community component) and then in the community with those tested only in recovery residences. Over all assessments completed, the mean change in REC-CAP score from baseline is higher when assessed within the Therapeutic Community component than in the community follow-up component post-release from jail (until assessment five). While the change in REC-CAP scores in the Therapeutic Community is greater, these participants peak at assessment three, suggesting a possible ceiling effect (e.g. the maximum level of change from baseline). In comparison, while individuals assessed within the community show a lower rate of increase in REC-CAP scores, the increase continues over multiple assessments, surpassing the Therapeutic Community levels by assessment five. This may suggest that continuous support (from the recovery residence) post-release from prison has some effect over the medium term. However, note that there is no statistically significant difference in the rate of change across TC and community interventions, as by assessment five, the numbers of assessed clients are very small ().
Figure 2. Generalized Estimated Equation (GEE) model with stabilized weights for changes in REC-CAP from baseline within the HARP program, comparing the Therapeutic Community and Community components.
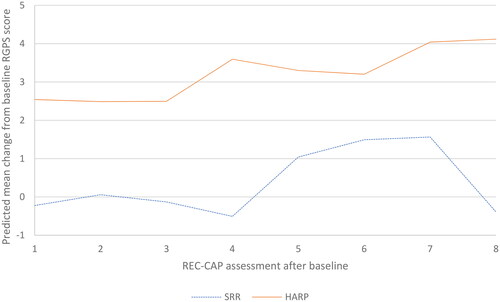
Our final measure examining recovery capital changes looks at the Recovery Group Participation Score (RGPS), the basic measure of community recovery capital, which assesses active engagement in community recovery groups and activities. Averaged at each assessment, the mean RGPS score change from baseline is significantly higher for people in the HARP program compared to SRR (p-value 0.002). Across all assessments, the mean change in RGPS score from baseline is consistently higher for people in the HARP program than SRR. The change over time shows a shallow but steady upward trend for HARP compared to fluctuations in changes in the RGPS from the baseline for SRR: shifting all clients in this study to the HARP program would result in a statistically significant increase in the mean RGPS change from the baseline assessment ().
Figure 3. GEE model with stabilized weights for changes in RGPS from baseline: HARP compared to SRR.
Discussion
There are a number of core conclusions from this study, the most important of which involve the positive effects of participating in the HARP Therapeutic Community program at Chesterfield County Jail combined with the continuous linkage of people seen thereafter in the community, with positive effects on both retention and recovery capital growth, when compared to a matched sample of people only attending recovery residences. We argue that there is also a crucial continuity of care effect where clients engaging in both TC in jail and then recovery residences show continued growth in wellbeing and recovery capital. The findings are also highly supportive of the “bridging” effect where continuity of care is associated with continuing growth in recovery capital following the transition to recovery residences from the TC program.
The study is consistent with previous findings that have shown that Level II and III recovery residences are associated with growth in recovery capital in a prior study in Virginia (Best et al., Citation2023) and in an earlier study of recovery residences in Florida (Härd et al., Citation2022). The current study builds on those effects both promoting the effectiveness of recovery residences on a range of recovery outcomes (Groh et al., Citation2009; Jason et al., Citation2007; Polcin et al., Citation2010, Mahoney et al., Citation2013; Mericle et al., Citation2019), and on the benefits of delivering therapeutic community interventions in a carceral setting (Vanderplasschen et al., Citation2013). However, this is the first study that has assessed the added value of combining prison TC with recovery residences to show continuing upwards trajectories in recovery capital as individuals transition from the jail to the community setting.
It is also not surprising that the trajectory of growth in recovery capital reported was greater in the jail-based TC as this is a much more intensive programme. Forthcoming work also in Virginia (Best et al., in preparation) would suggest that more intensive linkage to recovery supports by recovery residences can increase recovery capital gain, and the current study has powerful implications both around the importance of continuity of care and the effective integration of a more intensive residential program (HARP) and a community-based support (recovery residence) where the expectations are more strongly focused on reintegration and active community participation.
It is also consistent with our previous work in this area (Härd et al., Citation2022; Best et al., Citation2023) that recovery group participation is markedly higher in the HARP setting. DeLeon (Citation2000) has described the philosophy of the Therapeutic Community as “community as method” with commitment to the process and the group seen as central, and this is consistent with a model of recovery capital (Best, 2019) predicated on the assumption that it is access to recovery (and other) resources in the lived community that creates the conditions for recovery capital to grow.
There are a number of limitations to the paper. The baseline for the SRR group is conducted at or around admission to the recovery residence, but for the HARP participants, the baseline occurs during their time in jail (i.e., prior to entering the recovery residence, and so will account for some impact of the HARP program but no measurement of the effect of whatever other programs SRR participants received prior to arriving at the residence. We also do not have data from people who did not progress to a recovery residence or who dropped out early, and so all of the improvements reported are relative only to the included samples, and all of the data are reliant on the accuracy of self-report.
There is also a high rate of study attrition beyond the third REC-CAP completion in residences and so the data beyond this point will need further testing, and there is no true baseline assessment for the HARP group as they were initially assessed using the REC-CAP at varying points after starting the program. Thus their earlier higher capital scores may reflect program gains already accrued. Finally, whilst the groups can be shown to be statistically balanced to create comparable groups that allow us to quantify change over time, there may be exogenous factors that may affect treatment outcomes, and further qualitative work is required to derive a deeper understanding as to how change has been embedded.
Nonetheless, the study continues to build on an emerging body of research showing that recovery capital grows across recovery residence engagement with the current paper extending these beneficial effects to specialist recovery treatment in a criminal justice setting. We will look to build on these effects both by studying prison programs beyond HARP and also by seeking research funding to randomize substance using offenders to TC compared to non-TC supports prior to engaging with recovery residences.
Disclosure statement
No potential conflict of interest was reported by the author(s).
References
- Ashford, R. D., Brown, A., Brown, T., Callis, J., Cleveland, H. H., Eisenhart, E., Groover, H., Hayes, N., Johnston, T., Kimball, T., Manteuffel, B., McDaniel, J., Montgomery, L., Phillips, S., Polacek, M., Statman, M., & Whitney, J. (2019). Defining and operationalizing the phenomena of recovery: A working definition from the recovery science research collaborative. Addiction Research & Theory, 27(3), 179–188. https://doi.org/10.1080/16066359.2018.1515352
- Austin, P., & Stuart, E. (2015). Moving towards best practice when using inverse probability of treatment weighting (IPTW) using the propensity score to estimate causal treatment effects in observational studies. Statistics in Medicine, 34(28), 3661–3679. https://doi.org/10.1002/sim.6607
- Bennett, T., & Holloway, K. (2004). Drug use and offending: Summary results of the first two years of the NEW-ADAM programme. The Research, Development and Statistics Directorate, Home Office, 179.
- Best, D., Irving, J., & Albertson, K. (2016). Recovery and desistance: What the emerging recovery movement in the alcohol and drug area can learn from models of desistance from offending. Addiction Research & Theory, 25(1), 1–10. https://doi.org/10.1080/16066359.2016.1185661
- Best, D., & Ivers, J. H. (2021). Inkspots and ice cream cones: A model of recovery contagion and growth. Addiction Research & Theory, 30(3), 155–161. https://doi.org/10.1080/16066359.2021.1986699
- Best, D., Sondhi, A., Best, J., Lehman, J., Grimes, A., Conner, M., & DeTriquet, B. (2023). Using recovery capital to predict retention and change in recovery residences in Virginia, USA. Alcoholism Treatment Quarterly, 41(2), 250–262. https://doi.org/10.1080/07347324.2023.2182246
- Betty Ford Institute Consensus Group. (2007). What is recovery? A working definition from the Betty Ford Institute. Journal of Substance Abuse Treatment, 33, 221–228.
- Cano, I., Best, D., Edwards, M., & Lehman, J. (2017). Recovery capital pathways: Modelling the components of recovery wellbeing. Drug and Alcohol Dependence, 181(September), 11–19. https://doi.org/10.1016/j.drugalcdep.2017.09.002
- Cloud, W., & Granfield, R. (2008). Conceptualizing recovery capital: Expansion of a theoretical construct. Substance Use and Misuse, 43(12–13), 1971–1986. https://doi.org/10.1080/10826080802289762
- Cole, S., & Hernán, M. (2008). Constructing inverse probability weights for marginal structural models. American Journal of Epidemiology, 168(6), 656–664. https://doi.org/10.1093/aje/kwn164
- Cook, A., Pelfrey, W., & Morris, N. (2019). Helping addicts recovery progressively: Program evaluation final report. Richmond, VA: Virginia Commonwealth.
- Cullen, F. T., Jonson, C. L., & Nagin, D. S. (2011). Prisons do not reduce recidivism: The high cost of ignoring science. The Prison Journal, 91(3_suppl), 48S–65S. https://doi.org/10.1177/0032885511415224
- DeLeon, G. (2000). Community as method. Theory, model and method. Springer.
- Delgadillo, J., Payne, S., Gilbody, S., & Godfrey, C. (2013). Psychometric properties of the Treatment Outcomes Profile (TOP) psychological health scale. Mental Health and Substance Use, 6(2), 140–149. https://doi.org/10.1080/17523281.2012.693521
- Des Jarlais, D., Lyles, D., & Crepaz, N. (2004). Improving the reporting quality of non-randomized evaluation of behavioral and public health interventions: The TREND statement. American Journal of Public Health, 94, 361–366. https://doi.org/10.2105/ajph.94.3.361
- Facchin, F., & Margola, D. (2016). Researching lived experience of drugs and crime: A phenomenological study of drug-dependent inmates. Qualitative Health Research, 26(12), 1627–1637. https://doi.org/10.1177/1049732315617443
- Faries, D., & Kadziola, Z., et al. (2010). Analysis of longitudinal observational data using marginal structural models. In D. Faries (Ed.), Analysis of observational health care data using SAS. SAS press.
- Granfield, R., & Cloud, W. (1999). Coming clean: Overcoming addiction without treatment. NYU Press.
- Groh, D. R., Jason, L. A., Ferrari, J. R., & Davis, M. I. (2009). Oxford House and Alcoholics Anonymous: The impact of two mutual-help models on abstinence. Journal of Groups in Addiction and Recovery, 4(1–2), 23–31. https://doi.org/10.1080/15560350802712363
- Groshkova, T., Best, D., & White, W. (2013). The assessment of recovery capital: Properties and psychometrics of a measure of addiction recovery strengths. Drug and Alcohol Review, 32(2), 187–194. https://doi.org/10.1111/j.1465-3362.2012.00489.x
- Groshkova, T., Best, D., & White, W. (2011). Recovery Group Participation Scale (RGPS): factor structure in alcohol and heroin recovery populations. Journal of Groups in Addiction & Recovery, 6(1–2), 76–92. https://doi.org/10.1080/1556035X.2011.571132
- Härd, S., Best, D., Sondhi, A., Lehman, J., & Riccardi, R. (2022). The growth of recovery capital in clients of recovery residences in Florida. A quantitative pilot study of changes in REC-CAP profile scores. Research Square.
- Hernán, M., & Robins, J. (2020). Causal inference: What if. Chapman & Hall/CRC Press.
- Hiller, M. L., Knight, K., & Simpson, D. D. (1999). Prison‐based substance abuse treatment, residential aftercare and recidivism. Addiction, 94(6), 833–842. https://doi.org/10.1046/j.1360-0443.1999.9468337.x
- Humphreys, K., & Lembke, A. (2013). Recovery-oriented policy and care systems in the United Kingdom and United States. Drug and Alcohol Review, 33(1), 13–18. https://doi.org/10.1111/dar.12092
- Imai, K., & Ratkovic, M. (2014). Covariate balancing propensity score. Journal of the Royal Statistical Society Series B: Statistical Methodology, 76(1), 243–263. https://doi.org/10.1111/rssb.12027
- Jason, L. A., Davis, M. I., & Ferrari, J. R. (2007). The need for substance abuse after-care: Longitudinal analysis of Oxford House. Addictive Behaviors, 32(4), 803–818. https://doi.org/10.1016/j.addbeh.2006.06.014
- Kelly, J., & Greene, M. (2014). Beyond motivation: Initial validation of the commitment to sobriety scale. Journal of Substance Abuse Treatment, 46(2), 257–263. https://doi.org/10.1016/j.jsat.2013.06.010
- Linden, A., Uysal, S. D., Ryan, A., & Adams, J. L. (2016). Estimating causal effects for multivalued treatments: a comparison of approaches. Statistics in Medicine, 35(4), 534–552.
- Mahoney, E., Karriker-Jaffe, K. J., Mericle, A. A., Patterson, D., Polcin, D. L., Subbaraman, M., & Witbrodt, J. (2013). Do neighborhood characteristics of sober living houses impact recovery outcomes? A multilevel analysis of observational data from Los Angeles County. Health & Place, 79, 102951. https://doi.org/10.1016/j.healthplace.2022.102951
- Martin, S. S., O'Connell, D. J., Paternoster, R., & Bachman, R. D. (2011). The long and winding road to desistance from crime for drug-involved offenders: The long-term influence of TC Treatment on re-arrest. Journal of Drug Issues, 41(2), 179–196. https://doi.org/10.1177/002204261104100202
- Mericle, A. A., Carrico, A. W., Hemberg, J., Stall, R., & Polcin, D. L. (2019). Improving recovery outcomes among MSM: The potential role of recovery housing. Journal of Substance Use, 24(2), 140–146. https://doi.org/10.1080/14659891.2018.1523966
- Mumola, C. J., & Karberg, J. C. (2007). Drug use and dependence, state and federal prisoners, 2004. US Department of Justice, Office of Justice Programs, Bureau of Justice Statistics.
- National Association of Recovery Residences. (2012). A Primer on Recovery Residences: FAQ. Archived by WebCite®. http://www.webcitation.org/6B7e01VSk
- National Institute on Drug Abuse. (2020). Criminal Justice DrugFacts [Internet]. National Institute on Drug Abuse. https://www.drugabuse.gov/publications/drugfacts/criminal-justice on 2021
- Polcin, D. L., Korcha, R., Bond, J., Galloway, G., & Lapp, W. (2010). Recovery from addiction in two types of sober living houses: 12-Month outcomes. Addiction Research & Theory, 18(4), 442–455. https://doi.org/10.3109/16066350903398460
- Prendergast, M. L., Hall, E. A., Wexler, H. K., Melnick, G., & Cao, Y. (2004). Amity prison-based therapeutic community: 5-Year outcomes. The Prison Journal, 84(1), 36–60. https://doi.org/10.1177/0032885503262454
- Substance Abuse and Mental Health Services Administration. (2018). Table 6.32A – Substance use disorder in past year among persons aged 18 or older, by past year probation and parole/supervised release statuses and demographic characteristics: Numbers in thousands, 2017 and 2018. SAMHSA.
- Vanderplasschen, W., Colpaert, K., Autrique, M., Rapp, R., Pearce, S., Broekaert, E., & Vandevelde, S. (2013). Therapeutic communities for addictions: A review of their effectiveness from a recovery-oriented perspective. The Scientific World Journal, 2013, 427817. https://doi.org/10.1155/2103/327817
Appendix A:
Absolute standardized differences