
Abstract
This study aims to demonstrate how interactions between a Visual Analytics (VA) application and students shape an interactive and multimodal reading practice. VA is a technology offering support with analysing vast amounts of data through visualisations. Such information-rich interactive interfaces provide possibilities for students to gain insights, find correlations, draw conclusions and gain insights, but they also generate complexities concerning how to ‘read’ multimodal information on a screen. Inspired by Design-Based Research, interventions were designed and conducted in five social science secondary classrooms. The interactions between the VA application Statistics eXplorer and the students were video captured. A socio-material semiotic approach guides the analyses of how interactions between all actors (the interactive visualisations, the written text, the teachers, students, etc.) produce a reading network. The results show a reading characterised by being performative, collaborative, and dynamic. A combination of visuals and text supports the reading. However, visuals such as colour, highlighting and movement dominantly attract students’ attention, while written text often becomes subordinate and sometimes even ‘invisible’. Hence, this paper argues that it is vital for teachers to didactically support students’ visual reading skills.
Introduction
Today, it is impossible to gain an overview of the information created and accumulated by both human and non-human actions (Marr, Citation2015; Mediratta, Citation2015; O’Neil, Citation2016). This has implications for our daily life, affecting how information is handled, interpreted, and understood. However, technologies such as Visual Analytics (VA) have been developed to support people by placing the data volumes in visual contexts (Andrienko et al., Citation2011). Patterns, trends and correlations can be exposed and detected through such interactive data visualisations, and understandings which might go undetected in text-based documents or static diagrams (Nissen & Stenliden, Citation2020; Pettersson, Citation2019; Purchase, Citation2014). However, while interactive data visualisations may help to process information efficiently, they also affect and change the reading (Bearne, Citation2003; Bowen & Roth, Citation2005; Serafini, Citation2012). Bearne (Citation2009) asserts that the intensified use of both text and visual information on screens has significantly changed the concept of reading. The differences lie particularly in the variety of modes provided. Interpreting and comprehending the meaning of visual data such as interactive diagrams and graphs offered by a VA application necessitates a literacy built on multimodality, with a visual mode and sign interpretation combined with a text-based mode, see (Glazer, Citation2011; Roberts & Philip, Citation2006).
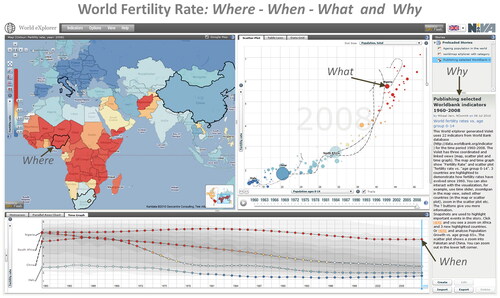
Figure 1. The multimodal interface of a VA application. The words Where, What, Why, When with corresponding arrows have been added to the picture, they do not appear on the ordinary interface. (Image originator M. Jern, NVCA, Linköping University.).
This kind of interface requires multiple skills to interpret, negotiate and make meaning from the information on display. The multimodal ‘text’ includes interactive visualisations, written text, graphs, charts, hyperlinked text, movement, colour, etc. plus various combinations of these. The question is how to view and read the visuals, the written and the way they are combined. At the interface, there are a lot of information carriers (Bodén, et al., Citation2022). For example, a map usually presents an argument or particular point of view, and the reading of a map as an information format requires an understanding of the map or the visuals’ propositions. Moreover, there is no stable configuration to be read as the interactivity induces changes in the interface. Both the visuality and the interactivity affect the reading and how meaning is conveyed.
In school, it has always been important to consider what being literate implies and reflect upon possible redefinitions (Walsh, Citation2010). Currently, it has become essential that students turn into competent readers of not only linear text but also texts in a variety of forms, constructed by both a variety of modes and an interactive fluidity (Mullis & Martin, Eds, Citation2019) as is the case with interactive data visualisations (cf Bodén & Stenliden, Citation2019; Clinton-Lisell, et al., Citation2021; Serafini, Citation2017). It is critical that students in school learn how to handle, interpret, read and understand large volumes of information presented at such interfaces. This in turn makes it important to thoroughly understand how an interactive and multimodal reading practice is constructed (Rowsell & Walsh, Citation2011). It is vital to explore how images, visuals, written text etc. work together, and how they are viewed and can be interpreted (Ho et al., Citation2011; Kress, Citation2010; Lundblad & Jern, Citation2012; Roberts & Philip, Citation2006). Bodén and Stenliden’s (Citation2019) results indicate that there may be distinct features that characterise interactive visual reading which they argue are worthy to explore further. This study takes these prompts seriously and explores how a VA application’s interactive multimodal interface and students (aged 13–15) interact in social science secondary classrooms. The aim is to produce knowledge of how interactive multimodal reading is constructed. The following research questions guide the study:
How is a network established when reading an interactive and multimodal text?
What characterises the reading of interactive and multimodal texts?
The study is part of a larger project financed by the Swedish Research Council (Grant number 2015-01280) with an overall focus on Visual literacy and Knowledge visualisation in compulsory school. Thereby, the study builds further on results from the Design-Based Research (DBR) project: Visual Storytelling in Education (VISE). The project introduces a specific VA application, Statistics eXplorer (Lundblad, Citation2013), with interactive visualisations of official statisticsFootnote1 in school. The application is also the focus of this study.
Earlier studies: literacy, interactivity, multimodality and text
Literacy and reading have long been attributed to written texts.Footnote2 Reading literacy was defined by the Progress in International Reading Literacy Study (PIRLS) as ‘the ability to understand and use those written language forms required by society and/or valued by the individual (Elley, Citation1992). However, during the last decades, the expansion of digital technology has gradually affected and changed the assumptions about texts and literacy in society (Jewitt, Citation2002, Citation2005; Kress, Citation2003; Leu et al., Citation2012; Serafini, Citation2011; Unsworth & Cléirigh, Citation2009). The New London Group initiated this discussion in the mid-1990s (Cope & Kalantzis, Citation2015) due to the increased access to digital texts and the change in reading practices (Gilster, 1997, in Cope & Kalantzis, Citation2006).
Digital texts, reading and literacies
Digital texts, as explained by (Walsh, Citation2006, Citation2008), consist of several modes, or contexts of communication, such as printed text, images, movement, films, sound, colour, etc. Compared to a primarily monomodal text, where written text dominates, digital text must be understood as multimodal (Brown, Citation2016; Cho & Afflerbach, Citation2017; Jewitt, Citation2005; Serafini, Citation2017). Such texts are more complex (Kress, Citation2003; Kress & Van Leeuwen, Citation2001) and require expanded literacy abilities (Godhe, Citation2014; Kress, Citation2010; Lankshear & Knobel, Citation2011; Olin-Scheller & Wikström, Citation2010). As pointed out by Coiro (Citation2003, Citation2014) and Serafini (Citation2011, Citation2012), when interacting with various modes, readers must be more active and employ other strategies as there is no pre-established beginning, middle or end in the reading (Hamat et al., Citation2010; Serafini, Citation2010). Simpson et al. (Citation2013) refer to this type of reading as being multidirectional. Concerning printed text, the range of modes available on the screen opens up far more choices of how to read, where to read and what to read (Bearne, Citation2009; Serafini, Citation2011, Citation2012, Citation2014; Walsh, Citation2006). This is in line with Kress’s (Citation2010) expression ‘reading as design’, meaning that reading is selecting and giving attention to what is displayed and steered by what is in focus due to the reader’s interests.
Altogether, embracing the variety of texts made available by digital technology, a recent PIRLS definition of reading literacy adds an important new sentence to the earlier definition which emphasises that the ability to read is to: ‘…construct meaning from texts in a variety of forms’ (Mullis & Martin, Citation2019). This study focuses on how this kind of reading is constructed. As appropriate to the definition, stated for example by Kędra (Citation2018) and Sundin (Citation2015), several qualifiers to literacy have appeared, for example digital-, information-, media- and visual literacy. The various literacy perspectives focus on certain specific aspects and have been developed within different fields, but they often overlap each other (Sundin, Citation2015). For example, interactive data visualisations are related to several of the mentioned literacy perspectives, but on account of the increased presence of visual information in such visual applications, it is especially relevant to focus on visual literacy (Bresciani & Eppler, Citation2009; Elkins, Citation2008; Felten, Citation2008).
Visual literacy, visual composition and visual guidance
Visual literacy has been defined by many, often as the double capability to assemble meaning from visual images, interpret them, and also to be able to produce images for others, thereby communicating a message (Avgerinou & Pettersson, Citation2011; Bamford, Citation2003; Felten, Citation2008; Metros, Citation2008). A more recent definition according to Serafini (Citation2017) is that visual literacy is a process to produce meanings in a transaction with multimodal ensembles comprising visual images, different design elements as well as written text, to meet what might be called for in specific contexts and settings.
When reading such an interactive text that also builds on visual representation, Kress and Van Leeuwen (Citation2006, p. 177) propose that the representational and interactive composition and meaning of visual texts relate to three interconnected aspects. They highlight how (1) the placement of elements, for example, the various ‘zones’ of the image, left/right, top/bottom, centre/margin, create information value/quality, (2) the salience of elements, for instance positioning items in the foreground or background, or using size, contrasts in tonal value or colour, differences in sharpness, etc., attract the viewer’s attention, (3) the presence or absence of framing devices such as lines dividing, connecting or disconnecting elements in the image and manifesting whether something belongs there, belongs together or does not belong together at all, etc. Through visual guidance, images also act as signposts to the order in which the visualisation should be ‘read’ and discussed in a combinable manner (Eppler, Citation2013). Several studies are pointing to the importance of visual design and visual elements such as forms and spaces, dots, lines, colour, typography, and how visuals and text are arranged (Burmark, Citation2002; Kress & Van Leeuwen, Citation2006; Samara, Citation2007; Watzman, Citation2003) but according to Jin (Citation2013) there are limitations when it comes to research on interactive multimodal texts; little empirical work has been reported and most design guidelines are based on static text. Clinton-Lisell et al. (Citation2021) have, however, shown that the effectiveness of interactive features depends on whether readers are made aware of how to use them in their reading.
Interactivity, visuality and reading abilities
According to Kucirkova (Citation2017), interactive features are central to the reading process. They are activated, for example, by touching, tapping or swiping an area and this generates a certain response, encouraging the reader to be active and respond to the text by touching and clicking. She explains that interactivity is induced through the format and content, which can be described as features prompting a response. In line with this, Bodén and Stenliden (Citation2019) show how secondary students in social science classrooms become ‘interlinked’ with the visual elements/properties displayed at the interactive interface when reading interactive graphs and maps. The interactions between the students and the visuals are shaped by their performativity and visuals such as highlighting, movement and colour influence the reader’s gaze, producing multiple possibilities for the visuals and the vision to connect. As they demonstrate the performativity of the visuals, together with the interactivity, induce an increased complexity that either strengthens or weakens the interactions, and this affects how visual literacy emerges. These readers use distinct types of strategies that Bodén and Stenliden (Citation2019) suggest for further exploration.
Furthermore, Kucirkova (Citation2017) emphasises that the research domain of digital interactivity lacks consistency and that the relationship between printed texts and digital multimodal ones is under-theorized. There are some studies concerning students and interactive digital texts/books, also referred to as e-texts, consisting of narrative electronic texts, illustrations, hot-spots, sound effects and embedded glossaries etc. (Clinton-Lisell et al., Citation2021; Kelley & Kinney, Citation2017; Takacs et al., Citation2015). Yet, these studies mostly compare reading times, comprehension and learning outcomes between printed and digital books, with Kucirkova’s (Citation2017) review of children’s digital interactive books as an exception. The emphasis has so far mostly been on the importance of reading strategies concerning multimodal texts, usually presented as a need for an overall awareness of how to search for and find images, identify relevant information, interpret the meaning, evaluate, design, and create effectively, apply an ethical and critical approach, etc. (ACRL, Citation2011). Nonetheless, these strategies are seldom developed through studies of how the actual reading of a multimodal and interactive text is constructed, and there are few explicit descriptions of the interactions between students, the visuals and the written text on screens. Brown (Citation2016) states that although access to interactive multimodal texts continues to increase, very few studies explore how they influence students’ literacy development. Research related to reading interactive multimodal texts, such as the interface of a VA application with a mix of interactive diagrams, maps, written text and hyperlinks in educational settings, is rare. Hence, there is a need for a theoretically sound examination of how reading is constructed, in detail, when students interact with multimodal and interactive texts on screens.
The construction of a reading network
Reading practices is often understood as being located within humans, but at the same time, Pennycook (Citation2018) highlights that human cognitive/sensory (bodily, visual or oral) experiences are not separated from materiality, spatiality, artefacts, entities, etc. Correspondingly, Mackey (Citation2016) argues that the role of literacy in our lives is better understood if the concept is viewed as, a form of material as well as intellectual engagement. Similarly, Kümmerling-Meibauer (Citation2015) analysed the materiality and interaction of children’s reading and theoretically suggests reading as representing interactivity as an integral option distributed through all aspects of the experience: illustrations, sounds and texts and for both the reader’s independent and shared reading (cf. Bizzochi, Citation2001).
Consequently, to enable a study of the interactions between both social (students and teachers) and material actors (visualisations, written text, cursors, computers, etc.), (Callon, Citation1986; Fenwick & Edwards, Citation2010; Latour, Citation1993, Citation2005; Law, Citation2008, Mullis and Martin Citation2019) in reading, a socio-material approach is crucial (Kucirkova, Citation2021). This entails a view of the students, the interactive visualisations using maps, colours, bubbles in a scatter plot, etc., the cursor, presentation programs, the teachers, and several other aspects as heterogeneous actors interacting and taking part in the reading activity. So, rather than focusing on meaning-making through the human interaction with artefacts/the multimodal texts/the representations or their use of the tools/the manoeuvring/the interactivity (Latour, Citation1998; Latour, Citation2005), the approach enables this study to explore how interactive multimodal reading is constructed in terms of how social and material actors perform together when many different factors come into play, as a complex act of resemiotization (Iedema, Citation2003) or, as Pennycook (Citation2010) puts it, relocalization emerges. Cope and Kalantzis (Citation2010) consider the role of material features of texts and human senses in reading activities as synaesthesia. Kress (Citation2010) defines the shift between various modes as transduction. Another concept for this is semiotic remediation (Shipka, Citation2011). In this study, translation (Callon, Citation1986; Latour, Citation1987) is applied to denote the process of resemiotization.
Translation is the transformation process of different actors taking part in, for example, a multimodal reading activity. It is a process of interactions that affects and changes every actor/everyone/everything that transfers, relocalizes, reformulates, re-presents, etc. In this study, a reading activity is viewed as constructed by interactions between various actors taking part in the activity. Through these interactions, the reading activity constitutes a network, which emerges due to the ability of the actors to align in pursuit of their interests, for example when visual information displayed at an interface of a VA is in focus and the information is to be translated/read. In this respect, a reading activity in this study is defined as a network of socio-material actors brought together to form links through interaction (Law & Hassard, Citation1999). The more relations or interactions there are between the actors, the stronger the network becomes (Law & Hassard, Citation1999).
The actors in a reading network take form and adopt attributes as a result of their relations with the other actors. It is thereby possible to say that they are intermeshed and interdependent by relational materiality and its performativity (Hayles, Citation1999; Law, Citation2008). As for this study, it is implied that the different actors cannot be seen as separate, fixed or stable. On the contrary, they will be looked upon as actors with a possibility to influence and change each other. At times, the interactions in the network might be difficult to sustain because actors inside or outside a network may challenge the actions of actors. Such trials of strength in the network may dissolve established links or alliances. To strengthen the relations, different lines of force may be added by the actors to further stabilise or mobilise the network (Law, Citation1987). Through such relational materiality, it is possible in this study to explore how social and material actions construct a reading network (Latour & Woolgar, Citation1979; Law & Hassard, Citation1999).
This theoretical frame guides the study and keeps the attention in the analyses on interactions within the networks of reading, the translations between the different actors, for example, the students, the teacher and features in the VA. The focus is directed towards the interactions between the visualisations, written text and students, and how they produce various networks, i.e. how relational materiality and its performativity influence and affect the construction of interactive multimodal reading.
Method
This study is part of a larger DBR project, as mentioned earlier. DBR is an iterative procedure designed by and for researchers and educators seeking to increase the impact of educational research in improving practice (Anderson & Shattuck, Citation2012; Easterday et al., Citation2017). DBR focuses on the design and examination of interventions within an educational context. To set up interventions, (a process of design, implementation, evaluation, re-design and re-evaluation), a collaboration was established over five years, between teachers at three schools, with expert knowledge of the practice, and researchers, with experience in Statistics eXplorer, the chosen VA application. The empirical data used in the present study derives from one of the participating schools dedicated to exploring how interactive multimodal reading is constructed in social science classrooms.
Statistics eXplorer, a VA application
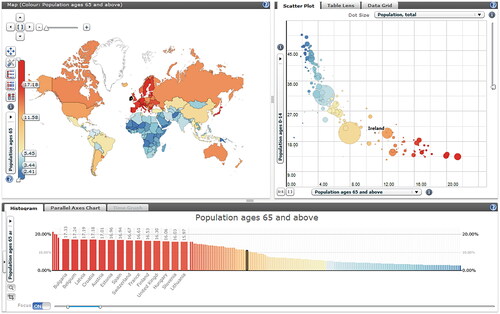
Statistics eXplorer facilitates innovative methods for information and geographical visualisations such as the choropleth map, dynamic histogram, table lens, parallel axes plot, ‘profile plot’, scatter plot and time graph, pie and time glyphs, and flow maps, etc, applied to and customised for statistics data, see .
Figure 2. Visualisation components available for composing a Vislet (image originator M. Jern, NVCA, Linköping University).
Data in the form of official statisticsFootnote3 are normally preloaded with a set of basic indicators such as demographics, economic indicators, education statistics, etc., but the user can also load external data through optional database interfaces such as SDMX, PC-AXIS or other API solutions to be mixed with preloaded data. To detect complex patterns, it is possible to view the statistics data through several different visual representations simultaneously, see , each of which is best suited to highlight specific features. Also, interactive features that support a spatial analytical reasoning process are offered, such as tooltips, brushing, highlighting, visual inquiry, and conditioned statistics filter mechanisms that help to detect outliers. When reading by exploring and making sense of the visual information, a coherent workspace that helps to emphasise the discoveries is needed. When Statistic eXplorer is used as educational material in schools, the teacher may select appropriate statistics according to present educational content by suitable visual information and a text-based story with hyperlinks to important visuals, so-called snapshots, see .
Figure 3. Example of an interactive educational document, a Vislet, based on public World Bank indicators with educational text, map, motion chart, snapshots, and time series—the methodological concept (image originator M. Jern, NVCA, Linköping University).
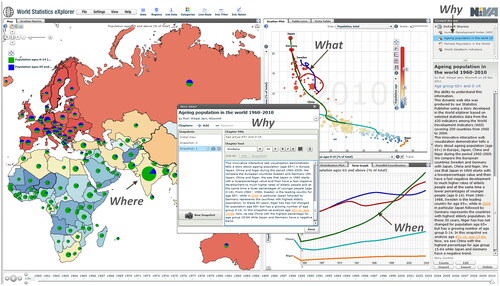
The chosen visual representations and the created snapshots can be turned into a visualised interactive story about the educational content. This story may be published on any website as a Vislet. In other words, a Vislet facilitates the transition of selected statistics into communicative sense-making entities with integrated metadata and interactive time-animated visualisation that could engage the students.
To clarify, the interactive and multimodal text on which this study focuses is the interface of a Vislet.
Designing the classroom interventions
The study was conducted in one school, with two teachers and their 13-14-year-old students in two social science classes. The teachers and researchers first met on four occasions, when they discussed and elaborated upon lesson plans didactically designed to introduce the VA application into the social science classrooms. The teachers were introduced to the Statistics eXplorer and instructed on how to produce a Vislet. The teachers constructed assignment instructions and explanations of specific content and created hyperlinks within the VA (snapshots) as well as web links. In this way, Vislets on the theme ‘World economy and population’ were created, consisting of visualised statistics of Gross Domestic Product (GDP), Human Development Index (HDI), Population, and Import and Export of Goods.
The interventions in this phase, i.e. the realisation of the lesson plans, lasted from two to three lessons. The lessons lasted 40–60 min and started with a short introduction to the Vislet by the teachers. Thereafter the students were instructed regarding their assignments. The students then worked in pairs, solving the assignments in the Vislet.
Data production
The interactions between the VA application and the students were followed and captured by web cam recordings, totalling 50 h. Students’ faces, voices and gestures, as well as the activities on the screens, were hereby captured. In addition to the these recordings, the empirical material also includes field notes taken by the researchers. Written consent to participate was collected.
Analytical attention
The analytical attention of this study is directed towards the interactions between the visualisations, written text, students, and the various networks produced, i.e. assemblages of links formed by the actors (Law, Citation2008). The intention is to apply what Law ( Citation2004) calls ‘method assemblages’ as a way to detect, explore and trace patterns of the socio-material relations in the data. As opposed to arranging the data more conventionally into a pre-given list or fixed shape, this entails a tentative and hesitant unveiling of the data. In the process of selecting data to be analysed, some of the socio-material interactions/relations were chosen and others were not. This ‘cutting the network’, as explained by Strathern (Citation1996), is a necessary aspect when applying a socio-material approach. According to Law (Citation2004), the method of crafting assemblages entails the practice of not only noticing the obvious but also detecting and amplifying signals of relations that otherwise would have faced the risk of going unnoticed.
The video recordings selected for analysis were chosen according to the concept of intensification (Stafford & Terpak, Citation2001). This way of proceeding is described by Massumi (Citation2002) as an open-ended practice of sense-making and a multisensory experience where perception, cognition and affect are interlinked. The chosen pieces were transcribed and turned into three events that illustrate how interactive multimodal reading is constructed. When producing the events, the researcher followed all the actors, making sure no boundaries separate them, as described by Callon (Citation1986). When analysing the events from the classrooms, this meant not censoring the actors, using a common vocabulary when describing actors and actions, and avoiding any distinctions between the actors interacting in the networks (Callon, Citation1986).
Analytical concepts put to work were interactions, relational materiality, performativity, networks, trials of strength and lines of force.
Construction of interactive multimodal reading
In this section, classroom events are analysed to distinguish how reading networks between students and a VA are established, and what characterises the reading of such an interactive multimodal text. The results are also illustrated by screenshots from the interface.
Searching for a starting point
The first event displays how the two students Ellie and Sara and the interactive multimodal text on the interface begin to interact. It is the students’ first lesson working with the VA application.
Reading network 1
Ellie and Sara sit next to each other, placed in front of their computers where the Vislet is displayed. At first, they chit-chat and glance sporadically at the interface. After a while, several interactions take place, such as Ellie’s hand moving the cursor to the area of the map, and the cursor stops there for a moment. Then it scrolls up and down, demonstrating the different visuals in the Vislet such as the map, the scatter plot, and the bar chart. Also, the written text in the assignment text box is visible. After some scrolling up and down the interface, the cursor returns to the map and the zooming function is activated. Through this, the map gets enlarged and diminished a few times. For an instant, Ellie and Sara look at their screens, but then their gazes sweep around in an unfocused manner at the interface. The interactions at the screen stop and the girls look at other students and small talk again. Thereafter the cursor continues to move around in the map area and Ellie’s gaze focuses on the screen as it is zoomed in and out. Suddenly Ellie says:
-“What are we supposed to do now?”
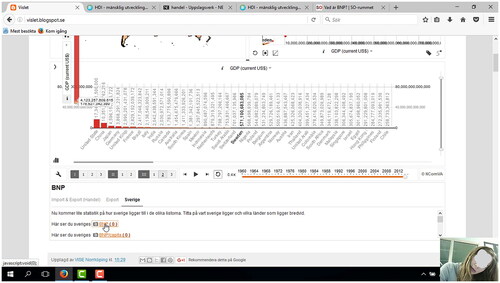
Shortly after, the cursor moves towards the big, blue-coloured island of Greenland, and as it, tooltips (moves over) the borders, a black and white text box with Greenland in written text folds out and information about its GDP is displayed, see . Immediately, Ellie’s gaze is firmly fixed on that area.
Figure 4. The interface, in which Ellie’s gaze focuses the information in the black and white text box that suddenly are displayed.
This event demonstrates how some actors, by exploring the interface, attempt to define the nature of the problem; what is this, where and how does one start and what is supposed to happen? Initially, there are some interactions between the visuals and the girls, but no actions such as ‘reading activities’ seem to occur. The few interactions can be viewed as transient and elusive, and no links are being formed. Accordingly, a very weak reading network emerges initially. This is illustrated by the continuing movements of the cursor, zooming, and scrolling the interface up and down. Except for a short moment when it stops at the map, it does not stop at any of the other visualisations, or the written text. Ellie’s and Sara’s gazes are moving around without focussing on anything in particular, sometimes the girls are leant back, and at times they look away from their screens. After a while, the girls lose interest and start to talk about other things. It appears as if the connections between the girls, the visuals and the written text are difficult to establish, and it seems problematic for the girls to decide where to start the reading. The confusion is also demonstrated by Ellie asking what to do. Since hardly any socio-material relations between the actors are established, it is difficult to commence constructing the reading, i.e., no translation takes place. It is suggested that this has to do with the absence of a ‘starting point’. In this absence, the interactions between the actors seem to be insecure and doubtful. It takes time and effort to define the other actors in this kind of reading, what they are and what they can do and/or what they contribute.
However, the event shows how the interactive and multimodal interface induces the actors’ willingness to keep on trying to establish links and start the reading. Ellie and Sara return to the screen and glance at it repeatedly, especially at the map, the cursor keeps moving around in a non-linear way, and visualisations and the written text turn visible several times. These interactions are interpreted as the actors trying to cooperate in their attempts to figure out where and how to start the reading. Hence, different semiotic carriers of information come into view that affects the students’ gazes as they continue the search for a starting point, i.e. the actors’ performativity affects the relational materiality between them. This is what happens as Ellie’s gaze focuses, and stays focussed on the screen, at the same time as the cursor interacts with the big, blue-coloured visual (the island of Greenland) in the map, and the black and white text box unfolds as the cursor tooltips the borders. Through those coordinated interactions, the network is stabilised, and a starting point is established by the actors. With these interactions, a reading activity is initiated. Most likely, both interactivity and multimodality appear to open possibilities that help to uphold and sustain the interest of the students. For Ellie and Sara, the visuals act as lines of force that enable the actors to connect, and when doing so, a starting point is eventually found. When that happens, the interactions support and shape the construction of a reading network. The most frequent starting points are found, as in this event, when students and visuals within the visualisations of the map, the scatter plot or the bar chart, connect and interact. As demonstrated, the cursor merely passes by the written text in the assignment text box and the girls do not connect with it at all.
Producing a reading direction
Interactions between the students, the visuals and the written text in the second event demonstrate how and where the reading proceeds, that is how the reading network is shaped. This might also be described as emerging literacy of interactive and multimodal texts (LIMT).
Reading network 2
Shortly after finding a starting point for reading on the map, Sara notices the assignment text box where the written instructions are located.
-“But there may be some questions down here? Here it says…” (Sara reads some of the written text, but then stops).
Simultaneously the cursor on Ellie’s screen scrolls down to the assignment text box but Ellie and the written text do not connect; her gaze is not focusing on it. Shortly thereafter the cursor moves up to the map again. Instead of interacting with the text, the girls express that they do not know what to do and once again they begin to chit-chat. After a while, they ask the teacher for help, and he instructs them about the assignment and tells them to check out the scatter plot visualization. Their assignment is to find out about the GDP of Sweden, but due to a zooming mistake (the bubbles of all the countries are not visible), they cannot read the information in that area. Instead, the girls are encouraged by the teacher to turn to the bar chart. At once, Ellie leans close to the screen and her gaze focuses on that area. In the assignment text box, underneath the bar chart, the indicator GDP is pre-adjusted in an orange snapshot link. The cursor quickly clicks on the link, see , and then the bar chart demonstrates the top countries to the left, and in the middle, the bar for Sweden is highlighted.
It flashes past for a millisecond and then it disappears. Due to the fisheye function in the VA application, countries further down in the bar chart quickly become visible, but the bar for Sweden is not visible anymore.
-“Eeehh, it disappeared,” says Ellie.
The cursor once again moves towards the orange link, clicks on it and the bar for Sweden is visible again but then disappears. Ellie’s gaze focuses on the screen.
-“Hey, I saw Sweden but then it disappeared,” says Ellie.
As the cursor clicks on the link again, the highlighted bar for Sweden is visible once again, although just for an instant.
-“Here… here, I need to press this,” says Ellie.
Then the cursor clicks several times on the orange link and then the screen simultaneously displays the view where the bar for Sweden is highlighted. By interacting with the cursor, the orange link and the highlighted bar, Ellie can read the information in the bar chart and solve the assignment.
Figure 5. The interactive interface when Sweden is highlighted (bolded) in the bar chart for a very short moment.
After establishing a starting point, the interactions shift from the map to the text box and then move back to the map. The network faces a trial of strength as the reading activities, to begin with, are vague and indefinite, and the established links, as the starting point was found, risk dissolving. The cursor keeps moving around the interface and once again it seems difficult for the students, visuals and written text to connect and form links. When the students do not know what to do the teacher act as a line of force, instructing them about the assignment and directing the reading towards the scatter plot area. However, in that area also the reading network faces a trial of strength, this time due to the zooming mistake which results in the necessary information in the scatter plot is not visible at the interface anymore. Once again, the teacher acts as a line of force, mobilising the network when encouraging the students to turn to the bar chart. There, the interactions become intense between the visuals (the orange link and the highlighted bar) and the students. This event exemplifies that when producing a reading direction, precisely as when finding a starting point, visuals stand out and come into sight prior to the written text. For example, it appears as if Ellie’s gaze and the coloured countries on the map, the orange link, and the highlighted bar, quickly connect and begin to interact. The visuals seem to attract the eye rather easily and interactions are established in quite an effortless way. The production of the reading direction at this point can be characterised as systematic and efficient, as it swiftly shifts several times between the orange link in the text box and the highlighted bar in the bar chart. Through this strong relational materiality and performativity of the actors, the students can read the information needed to solve the assignment. Thus, to begin with, the reading direction is produced mainly by interactions between visuals and students, and as these actors affect each other in this process of translation, the reading network is strengthened.
However, this phenomenon of visual dominance also appears to complicate/undermine the formation of links between students and written text. When a reading direction is initially constructed, the written text seems to be subordinate and visuals dominate, which affects the reading direction in the way that the written text is obscured, almost invisible. Because of the successful translations between the visuals and the students’ gazes, relations with other actors, such as the written text, might become weakened or cut off. This points towards a complexity regarding the socio-material relations. The strong performativity of visuals is in one way a line of force, as it quickly generates relational materiality with the students. On the other hand, that strong performativity may also be a trial of strength since it hinders the relations between students and written text. A distinct example of how the dominance of visuals almost obstructs the visibility of the text is when the students are trying to answer a question about what the Human Development Index (HDI) is. By clicking on a coloured link, the students are directed to a web page where the concept is explained in written text, see . Despite the salient headline (English translation: HDI—index of human development), followed by a written explanation of what the HDI is, Ellie’s gaze immediately focuses on the red-coloured bars in the bar chart, below the text, and the cursor moves there.
Figure 6. The interface with information about the concept of HDI. The written text explains the concept HDI, and the bar chart illustrates its value for different countries.
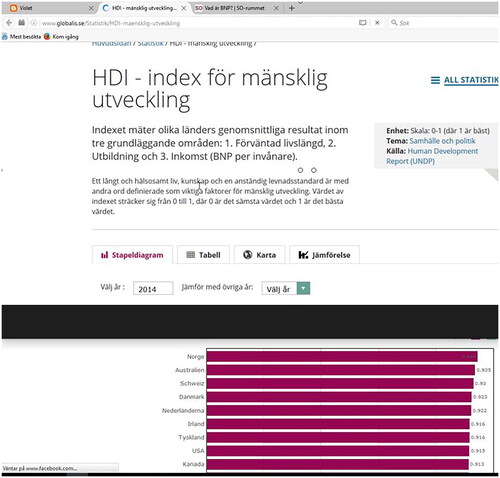
Time and again, the girls talk about what the HDI might be, and the cursor repeatedly clicks on the red bars in the bar chart, but they only display the HDI value of separate countries, without any explanation of the concept. The girls’ gazes do not focus on the headline, or the following, clarifying text. The effect is that no translations between the students and the written text evolve. After a while, the students seem to realise the necessity of reading both visuals and text, as they do not comprehend and understand their assignment. Subsequently, links between the students and the written text are formed, relational materiality emerges, and from now on, the reading network is mobilised to include written text as an actor as well. Henceforth, the cursor moves to the assignment text box frequently, the students’ gazes focus on the written text and sometimes they read it out loud — the network is further strengthened. It is clear that producing a reading direction merely based on interactions between students and visuals results in an ‘insufficiently’ constructed reading of the multimodal and interactive interface, pointing towards a necessity for the reading network to actively also include written text as an actor.
Transforming the reading surface
The reading is affected in several ways by the text’s interactive multimodal features. The various modes and interactive functions in the Vislet, provide possibilities to change the composition of how the multimodal text is displayed on the interface, i.e. to transform the reading surface. For example, when students and the interactive function of zooming in and/or out of different areas interact, this affects what can be read – the reading surface is either enlarged (focussing on specific details) or diminished (focusing on the overall picture). At times students and interactive functions interact in a successful way and translation occurs, with the readable information easily distinguishable and designed in a distinct way that strengthens the reading network. When this happens, the zooming becomes a line of force. However, sometimes the network faces trials of strength such as when the zooming is misdirected, and the reading therefore fails. This is, for example, what happens when a red-coloured country on the map is zoomed in too far, see . The result is that the entire map area turns all red.
Figure 7. The interface when the map is zoomed in to far so that the entire map area turns red, and the map contours disappears.
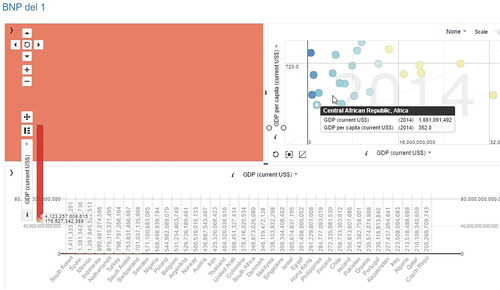
Since no zooming out/back is done, reading in that area is no longer possible. However, what happens then, is that the reading is directed elsewhere — it shifts from the map to the scatter plot. In that area interactions with another interactive feature take place, namely the change of statistical indicators (the display of different related statistics/content). The cursor clicks on the indicator lists on the x- and y-axes and several indicators fold out. The students lean close to the screen, their gazes focus on the scatter plot area and after a short while the cursor clicks on the indicators GDP (per capita) and GDP (total). The reading surface is instantly transformed and displays new, readable information. The countries’ bubbles now demonstrate other statistical data compared to the one previously presented, and as the cursor moves across the bubbles, black and white text boxes fold out, making it possible to read that information about each country. When the reading network faces a trial of strength, in the form of the unreadable map area, the possibilities provided by the interactivity act as a line of force. In this translation process, by shifting the reading direction to another area and actively transforming the surface, the reading network dynamically manages to design a new reading surface. Hence, the relational materiality and performativity of the interactive multimodal text and the students’ gaze strongly affect both the reading direction and the reading surface.
Performative, collaborative and dynamic reading
So far, the results have demonstrated how interactions within the reading network establish a starting point, a reading direction, and a reading surface. The third event outlines the characteristics of the reading as a performative, collaborative and dynamic process. It is a complex process depending on which of the actors interact, which starting point is found, what reading direction is produced and how the reading surface is designed. It has been found that there are multiple ways to construct this type of LIMT.
In this event, the interactions take place at both the assignment text box and the bar chart.
Reading network 3
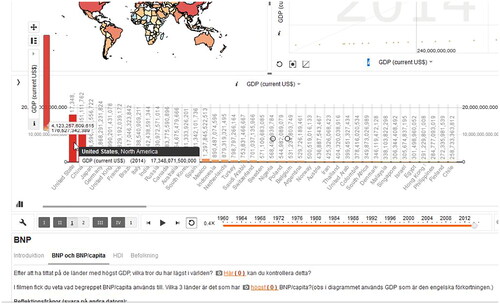
The cursor moves to the assignment text box. Ellie’s gaze is focused on the screen, her eyes follow the lines. The text informs that the assignment is to find out the countries with the highest GDP. The cursor follows the line and stops at the orange-coloured word ‘highest’. Then it clicks on the interactive orange link, and the interface immediately changes and demonstrates that information.
-“The ones with the highest GDP?” Sara reads out loud.
The cursor changes position from the written text towards the left side of the bar chart where the countries with the highest GDP are displayed. They are presented in red bars and the cursor slowly follows each one of the top three. Simultaneously a black and white text box with the name of the country and the total sum of GDP becomes visible, see . Ellie utters the names of the countries for Sara to write them down.
Figure 8. The interface where the bar, illustrating the USA, in the bar chart is tool tipped by the cursor and a black and white text box appears with written text information.
It is discernible in this event that written text, together with visuals, is a crucial actor which has been included in the network. During the reading networks’ construction of the reading, it appears as if the actors improve their LIMT abilities by including previously unseen actors or areas. The relational materiality and its performativity between students, visuals and the written text are vital for the reading construction. This event illustrates how the initially hesitant and vague non-linear reading through interactions is translated into systematic and efficient reading. It is characterised as performative, formed by strong links and easy-going interactions between the written text in the assignment box, visuals such as the orange link and the red bars, the cursor, and the girl’s voice and gaze. Here, the process of translation has taken place as the interactions have affected and changed the actors, mobilising them into a strong and stabilised, reading network.
The event also shows how the reading is characterised as collaborative. This is apparent when Ellie’s gaze and the cursor’s arrow follow the lines in the assignment text box, and when the cursor’s arrow slowly follows each one of the top three red bars and Ellie utters their names. Another example of how the performativity of the cursor’s arrow and its movements and the student’s gaze support the reading of the written text is illustrated in a screenshot from the web page shown earlier about the concept of HDI. Previously, the interactions ceased when no links between the students and the written text occurred, and the students returned to the Vislet. But this time, as the girls return in their search for information, relational materiality is evident between the actors. Ellie’s gaze focuses on the area with the written text, she reads the text out loud, and the cursor’s arrow simultaneously follows the lines she reads, see .
Figure 9. The interface that displays written text about HDI in the moment when the cursor’s arrow is placed next to the words following the last written line at the same time as Ellie reads the text out loud.
It appears that the cursor’s moving arrow is operating as a line of force that assists the student’s gaze to pinpoint what and where to read. Just as the index finger might support a reader to stay on the correct line in a book, reading all the words in the sentences, a similar function seems to be displayed by the cursor’s arrow focussing on the written text and the visuals on screen. Straightforward interactions like these, when the movements of the cursor’s arrow reinforce where to read by following the written text or the visuals, seem to further consolidate the links in the reading network, assisting the actors with focussing intensely without losing track when reading the interface.
Interactions with the interactive features in the event also demonstrate how the reading is characterised as dynamic. For example, when the cursor clicks on the interactive orange link, the interface immediately transforms, presenting other statistical information. Compared to a printed book, where the pages are fixed and immutable, this possibility to change the actual reading surface affects the design of the reading. Depending on what information the actors select, by interacting with each other, they design what is possible to read. Furthermore, if the actors somehow cannot read the information presented in one area of the screen, they have the possibility to shift the reading direction and alter the reading interactions to another area. So, the interactivity challenges the order of what to read and how to navigate within the texts, or in other words, how to design the reading. It is evident that the interactive multimodal text offers a variety of semiotic carriers of information, and the reading network that is produced depends on which of all the actors connect, or not, which demonstrates the endless multiple ways to construct the reading.
Discussion
This study highlights the importance of students’ capacities to handle, interpret, read and understand large volumes of information presented by powerful interactive data visualisations. As this kind of text engages multiple skills, it is critical to thoroughly understand how an interactive multimodal reading practice is done. The key contribution of this study is that it demonstrates how networks, consisting of actors such as students, interactive, maps, colours, bubbles in a scatter plot, the cursor, the teachers, etc., dissolve but also are established. The main point being that it describes how this interactive multimodal reading emerges and develops, how networks of multiple actors, both social and material, in the reading process come together (or not) in the achievement (or failure) of LIMT.
Several earlier reports in the field have pointed out that changing conditions for text are transforming reading into an activity which includes an increased number of ingredients and complexity. With detailed descriptions of some of these complexities, our results concerning how reading is achieved add value to the research field of reading interactive multimodal texts.
The results show in detail how the absence of a given starting point for reading and non-linear reading cause obstacles to the establishment and maintenance of a strong reading network. Another result is how reading efforts are to a large degree characterised by the importance of establishing a reading direction. Demonstrated is how this develops from vague and indefinite to systematic and efficient. In order to solve their assignment, the students depend on being able to read both visuals and written text within the interactive multimodal text. Although the strong performativity of visuals is often an important line of force and supports the reading, it can also be a trial of strength since, in some part of the process, it contributes to obscuring the importance of the written text (i.e. finding the assignment or an explanation of a key concept). In a similar manner, the study has illuminated how the interactivity can also act as both a line of force and a trial of strength. The empirical example is how a zooming mistake (that makes information disappear) in the next phase reveals another path to reach the needed content. Thereby, exposed is how both performativity and interactivity add a lot of complexity, since they can affect both the reading direction and the appearance, and content, of the reading surface.
The study has also depicted how the reading through performativity and collaboration is characterised by being dynamic in different ways. In this respect, depending on what information the actors interact with, the network designs what is possible to read. The different reading networks develop different ways to read the text. This means that some areas are read, while others are not. As has been mentioned above, definitions of notions such as text, reading and literacy have been adjusted alongside the development from written text to interactive and multimodal texts (Bodén, et al., Citation2022; Jewitt, Citation2005; Kress, Citation2003; Moreno & Mayer, Citation2007). Several features of such reading have been emphasised; being multidirectional, that choices must be made of how to read, where to read and what to read, and a demand for an ongoing process of ‘reading as design’ (Bearne, Citation2009; Kress Citation2010; Serafini, Citation2011, Citation2012, Citation2014; Simpson et al., Citation2013; Walsh, Citation2006). This study contributes with more elaborated examples of concrete readings in real life classrooms. What becomes evident through this study is that the choices to be made, as well as the design of the reading, are to a large extent affected by material actors — more specifically, whether and how interactions emerge between them and the social actors in this dynamic reading process.
Literacy has a double-edged character; it is about both consuming (reading texts) and producing (constructing texts). This study concerns the challenges and processes of reading in what have been labelled as literacy of interactive multimodal texts (LIMT).Footnote4 We suggest this as an important field of study within visual literacy issues. Others have underlined that contemporary literacy is best considered as both a material and intellectual engagement where human cognitive experiences are not separated from materiality, spatiality, artefacts, entities, etc. (Bizzochi, Citation2001; Kümmerling-Meibauer, Citation2015; Mackey, Citation2016; Pennycook, Citation2018). Our study strengthens those views. Consequently, by applying a socio-material approach, with an ambition to explore how LIMT is constructed (or fails to come into existence) when social and material actors interact, cf. resemiotization (Iedema, Citation2003) or relocalization (Pennycook, Citation2010), this study contributes empirical research concerning what characterises such reading in real-life situations.
The generalisability of the results is limited since it deals with novel readers of an interactive and multimodal text, or in this case a new and very specific such text (Statistic eXplorer) for the students to handle. It is likely that the next time they work with the same VA, or other interactive and multimodal texts, their familiarity with such applications will facilitate their ability to combine written text with visuals and their performativity. However, the question of whether and to what extent this is transferable to other texts that require LIMT is a matter for further research.
A similar limitation of this study is that it has been conducted at an early stage of using VA in schools (as part of a larger project). The focus has been on how the reading of interactive multimodal texts is established and what characterises that reading. The question of what will characterise the shapes of a manifest LIMT ability when it is exercised in an everyday manner is beyond the scope of this study. Nevertheless, much can be learned from how socio-material actors come together and establish a functional reading. Further studies of more mature readers are also desirable since we are convinced that LIMT will be, or already is, a necessary ability in school in the contemporary technified society.
An urgent issue for further research is how students’ abilities to handle reading, when that is part of an ongoing design process, can be supported by teachers. Besides that, schools must cope with teaching situations where teachers can’t know exactly how/where/what students have read in interactive texts. Altogether, it seems like a crucial task to develop didactic designs, including learning activities, to support the achievement of LIMT. This in turn is necessary to be able to act as an active participant in the information-rich era.
Acknowledgements
The authors thank in particular the teachers and students who participated in the study. We also express our warm thanks to Professor Mikael Jern posthumously. His work was essential for our study and made visual storytelling possible for education. Furthermore, we thank Magnus Johansson for his great support of processing the figures.
Disclosure statement
No potential conflict of interest was reported by the author(s).
Additional information
Funding
Notes
1 Official statistics are data from data sources like the World Data Bank, Eurostat and Statistics Sweden. For further information see UN Resolution from 29th of January 2014.
2 When describing text consisting of letters, different terms are used. Some researchers refer to printed or print-based text, others use the term textual words, static, or written text. In this study the term written text is applied.
3 Official statistics are data from data sources like the World Data Bank, Eurostat and Statistics Sweden. For further information see UN Resolution from 29th of January 2014.
4 For a study on producing an interactive and multimodal presentation using the same VA used in this study see Stenliden and Nissen (Citation2022) and Bodén, Stenliden, and Nissen (Citation2022).
References
- Anderson, T., & Shattuck, J. (2012). Design-based research: A decade of progress in education research? Educational Researcher, 41(1), 16–25.
- Andrienko, G., Andrienko, N., Keim, D., MacEachren, A. M., & Wrobel, S. (2011). Challenging problems of geospatial visual analytics. Journal of Visual Languages & Computing, 22(4), 251–256.
- Association of College and Research Libraries (ACRL) (2011). ACRL visual literacy competency standards for higher education. American Library Association. http://www.ala.org/acrl/standards/visualliteracyp
- Avgerinou, M. D., & Pettersson, R. (2011). Toward a cohesive theory of visual literacy. Journal of Visual Literacy, 30(2), 1–19. https://doi.org/10.1080/23796529.2011.11674687
- Bamford, A. (2003). The visual literacy white paper (p. 7). A Report Commissioned for Adobe Systems Pty Ltd.
- Bearne, E. (2003). Rethinking literacy: Communication, representation and text. Reading, 37(3), 98–103.
- Bearne, E. (2009). Multimodality, literacy and texts: Developing a discourse. Journal of Early Childhood Literacy, 9(2), 156–187.
- Bizzochi, J. (2001). Ceremony of innocence: A case study in the emergent poetics of interactive narrative [Doctoral dissertation]. Massachusetts Institute of Technology.
- Bodén, U., & Stenliden, L. (2019). Emerging visual literacy through enactments by visual analytics and students. Designs for Learning, 11(1), 40–51. https://doi.org/10.16993/dfl.108
- Bodén, U., Stenliden, L., & Nissen, J. (2022). Students’ insights from interactive visualizations arranged multimodally in knowledge visualizations. Educare-vetenskapliga skrifter, 1, 32–70.
- Bowen, G. M., & Roth, W. M. (2005). Data and graph interpretation practices among preservice science teachers. Journal of Research in Science Teaching, 42(10), 1063–1088. https://doi.org/10.1002/tea.20086
- Bresciani, S., & Eppler, M. J. (2009). The risks of visualization: A classification of disadvantages associated with graphic representations of information. In P. J. Schulz, U. Hartung, & S. Keller (Ed.), Identität und vielfalt der kommunikations-wissenschaft. UVK Verlagsgesellschaft mbH.
- Brown, S. (2016). Young learners’ transactions with interactive digital texts using e-readers. Journal of Research in Childhood Education, 30(1), 42–56. https://doi.org/10.1080/02568543.2015.1105887
- Burmark, L. (2002). Visual literacy: Learn to see, see to learn. Association for Supervision and Curriculum Development.
- Callon, M. (1986). Some elements of a sociology of translation: Domestication of the scallops and the fishermen of St Brieuc Bay. In J. Law (Ed.), Power, action, and belief: A new sociology of knowledge (pp. 196–233). Routledge & Kegan Paul.
- Cho, B. Y., & Afflerbach, P. (2017). An evolving perspective of constructively responsive reading comprehension strategies in multilayered digital text environments. In S. E. Israel (Ed.), Handbook of research on reading comprehension (pp. 109–134). The Guilford Press.
- Clinton-Lisell, V., Seipel, B., Gilpin, S., & Litzinger, C. (2021). Interactive features of E-texts’ effects on learning: a systematic review and meta-analysis. Interactive Learning Environments, 1–16. https://doi.org/10.1080/10494820.2021.1943453
- Coiro, J. (2003). Exploring literacy on the Internet. The Reading Teacher, 56(5), 458–464.
- Coiro, J. (2014). Online reading comprehension: Challenges and opportunities. Texto Livre: Linguagem e Tecnologia, 7(2), 30–43.
- Cope, B., & Kalantzis, M. (2006). From literacy to ‘multiliteracies’: Learning to mean in the new communications environment. English Studies in Africa, 49(1), 23–45.
- Cope, B., & Kalantzis, M. (2010). New media, new learning. In D. R. Cole & D. L. Pullen (Eds.), Multiliteracies in motion (pp. 87–104). Routledge.
- Cope, B., & Kalantzis, M. (2015). The things you do to know: An introduction to the pedagogy of multiliteracies. In A pedagogy of multiliteracies (pp. 1–36). Palgrave Macmillan.
- Easterday, M. W., Rees Lewis, D. G., & Gerber, E. M. (2017). The logic of design research. Research and Practice. https://doi.org/10.1080/23735082.2017.1286367
- Elkins, J. (2008). Introduction: The concept of visual literacy and its limitations. In J Elkins (ed.), Visual Literacy (pp. 1–9). Routledge.
- Elley, W. B. (1992). How in the world do students read? IEA study of reading literacy. International Association for the Evaluation of Educational Achievement (IEA).
- Eppler, M. J. (2013). What is an effective knowledge visualization? Insights from a review of seminal concepts. In Knowledge visualization currents (pp. 3–12). Springer. DOI https://doi.org/10.1007/978-1-4471-4303-1_1
- Felten, P. (2008). Visual literacy. Change: The Magazine of Higher Learning, 40(6), 60–64.
- Fenwick, T., & Edwards, R. (2010). Actor-network theory in education. Routledge.
- Glazer, N. (2011). Challenges with graph interpretation: A review of the literature. Studies in Science Education, 47(2), 183–210. https://doi.org/10.1080/03057267.2011.605307
- Godhe, A.-L. (2014). Creating and assessing multimodal texts, negotiations at the boundary [Doctoral dissertation]. University of Gothenburg.
- Hamat, A., Nor, N. F. M., Azman, H., Bakar, N. A., & Noor, N. M. (2010). I-ELLS: A research-based design for an online interactive literacy system. Education and Information Technologies, 4(3), 165–173.
- Hayles, N. K. (1999). How we became posthuman: Virtual bodies in cybernetics, literature, and informatics. The University of Chicago.
- Ho, Q., Lundblad, P., Åström, T., & Jern, M. (2011). A web-enabled visualization toolkit for geovisual analytics, 2011. In Proceedings of SPIE, the International Society for Optical Engineering: SPIE: Electronic Imaging Science and Technology, Visualization and Data Analysis, 78680R-78680R-12. https://doi.org/10.1117/12.872250
- Iedema, R. (2003). Multimodality, resemiotization extending the analysis of discourse as multi-semiotic practice. Visual Communication, 2, 29–57.
- Jewitt, C. (2002). The move from page to screen: The multimodal reshaping of school English. Visual Communication, 1(2), 171–195.
- Jewitt, C. (2005). Multimodality, “reading”, and “writing” for the 21st century. Discourse: Studies in the Cultural Politics of Education, 26(3), 315–331.
- Jin, S. H. (2013). Visual design guidelines for improving learning from dynamic and interactive digital text. Computers & Education, 63, 248–258.
- Kędra, J. (2018). What does it mean to be visually literate? Examination of visual literacy definitions in a context of higher education. Journal of Visual Literacy, 37(2), 67–84.
- Kelley, E. S., & Kinney, K. (2017). Word learning and story comprehension from digital storybooks: Does interaction make a difference? Journal of Educational Computing Research, 55(3), 410–428.
- Kress, G., & Van Leeuwen, T. (2001). Multimodal discourse: The modes and media of contemporary communication. Edward Arnold.
- Kress, G., & Van Leeuwen, T. (2006). The grammar of visual design (2nd ed.). Routledge. Taylor Francis Group.
- Kress, G. (2003). Literacy in the new media age. Routledge.
- Kress, G. (2010). Multimodality: A social semiotic approach to contemporary communication. Routledge.
- Kucirkova, N. (2017). An integrative framework for studying, designing and conceptualising interactivity in children’s digital books. British Educational Research Journal, 43(6), 1168–1185.
- Kucirkova, N. (2021). Socio-material directions for developing empirical research on children’s e-reading: A systematic review and thematic synthesis of the literature across disciplines. Journal of Early Childhood Literacy, 21(1), 148–174.
- Kümmerling-Meibauer, B. (2015). From baby books to picturebooks for adults: European picture books in the new millennium. Word & Image, 31(3), 249–264.
- Lankshear, C., & Knobel, M. (2011). New literacies: Everyday practices and social learning: Everyday practices and social learning. McGraw-Hill Education.
- Latour, B. (1998). From the World of Science to the World of Research?. Science, 280(5361), 208–209. 10.1126/science.280.5361.208
- Latour, B., & Woolgar, S. (1979). Laboratory life: The social construction of scientific facts. Sage.
- Latour, B. (1987). Science in action: How to follow scientists and engineers through society. Harvard University Press.
- Latour, B. (1993). We have never been modern. Harvard University Press.
- Latour, B. (2005). Reassembling the social: An introduction to actor-network-theory. Oxford University Press.
- Law, J. After method: mess in social science research. Routledge, London (2004).
- Law, J., & Hassard, J. (1999). Actor network theory and after. Blackwell.
- Law, J. (1987). Technology and heterogeneous engineering: The case of Portuguese expansion. In W. E. Bijker, T. P. Hughes, & T. J. Pinch (Eds.), The social construction of technological systems: New directions in the sociology and history of technology (pp. 111–134). MIT Press.
- Law, J. (2008). Actor-network theory and material semiotics. In B. S. Turner (Ed.), The new Blackwell companion to social theory (3rd ed., pp. 141–158). Blackwell.
- Leu, D., Everett-Cacopardo, H., Zawilinski, L., Mcverry, G., & O’Byrne, W. I. (2012). New literacies of online reading comprehension. In The encyclopedia of applied linguistics. Wiley-Blackwell. https://doi.org/10.1002/9781405198431.wbeal0865
- Lundblad, P., & Jern, M. (2012). Visual storytelling in education applied to spatial-temporal multivariate statistics data. In Expanding the frontiers of visual analytics and visualization (pp. 175–193). Springer.
- Lundblad, P. (2013). Applied geovisual analytics and storytelling. Department of Science and Technology, Linköping University.
- Mackey, M. (2016). Literacy as material engagement: The abstract, tangible and mundane ingredients of childhood reading. Literacy, 50(3), 166–172.
- Marr, B. (2015). Big data: using smart big data, analytics and metrics to make better decisions and improve performance. [Books24 × 7 version]. http://common.books24x7.com.e.bibl.liu.se/toc.aspx?bookid=80814
- Massumi, B. (2002). Parables for the virtual: Movement, affect, sensation. Duke University Press.
- Mediratta, A. (2015). Big data: Terms, definitions, and applications. EMC Corporation. https://education.dellemc.com/content/dam/dell-emc/documents/en-us/2015KS_Mediratta-Big_Data_Terms,_Definitions_and_Applications.pdf
- Metros, S. E. (2008). The educator’s role in preparing visually literate learners. Theory into Practice, 47(2), 102–109.
- Moreno, R., & Mayer, R. (2007). Interactive multimodal learning environments. Educational Psychology Review, 19(3), 309–326.
- Mullis, I. V., & Martin, M. O. (Eds) (2019). PIRLS 2021 Assessment Frameworks. International Association for the Evaluation of Educational Achievement. TIMSS & PIRLS International Study Center.
- Nissen, J., & Stenliden, L. (2020). Visualized statistics and students’ reasoning processes in a post-truth era. Journal of Interactive Learning Research, 31(1), 49–76.
- O’Neil, C. (2016). Weapons of math destruction: How big data increases inequality and threatens democracy. Allen Lane.
- Olin-Scheller, C., & Wikström, P. (2010). Literary prosumers: Young people’s reading and writing in a new media landscape. In: Education Inquiry, 1(1), 41–56.
- Pennycook, A. Language as a local practice. Routledge (2010). 1st ed
- Pennycook, A. (2018). Posthumanist applied linguistics. Routledge.
- Pettersson, R. (2019). Information design, volume 3: Image design [electronic resource]. International Institute for Information Design. Wien. https://www.iiid.net/PublicLibrary/Pettersson-Rune-ID3-Image-Design.pdf
- Purchase, H. C. (2014). Twelve years of diagrams research. Journal of Visual Languages & Computing, 25(2), 57–75. https://doi.org/10.1016/j.jvlc.2013.11.004
- Roberts, S., & Philip, R. (2006). The grammar of visual design. Australasian Journal of Educational Technology, 22(2), 209–228. https://doi.org/10.14742/ajet.1299
- Rowsell, J., & Walsh, M. (2011). Rethinking literacy education in new times: Multimodality, multiliteracies & new literacies. Brock Education. A Journal of Educational Research and Practice, 21(1), 53–62.
- Samara, T. (2007). Design elements: A graphic style manual. Rockport publishers.
- Serafini, F. (2010). Reading Multimodal Texts: Perceptual, Structural and Ideological Perspectives. Children's Literature in Education, 41(2), 85–104. 10.1007/s10583-010-9100-5
- Serafini, F. (2011). Expanding perspectives for comprehending visual images in multimodal texts. Journal of Adolescent & Adult Literacy, 54(5), 342–350.
- Serafini, F. (2012). Reading multimodal texts in the 21st century. Research in the Schools, 19(1), 26–32.
- Serafini, F. (2014). Reading the visual: An introduction to teaching multimodal literacy. Teachers College Press.
- Serafini, F. (2017). Visual literacy. In Oxford research encyclopedia of education. https://doi.org/10.1093/acrefore/9780190264093.013.19
- Shipka, J. (2011). Toward a composition made whole. University of Pittsburgh. https://doi.org/10.2307/j.ctt5hjqkk
- Simpson, A., Walsh, M., & Rowsell, J. (2013). The digital reading path: Researching modes and multidirectionality with iPads. Literacy, 47(3), 123–130.
- Stafford, B., & Terpak, F. (2001). Revealing technologies/magical domains in a box to images on a screen. In B. Stafford & F. Terpak (Eds.), Devices of wonder: From the world in a box to images on a screen (pp. 1–109). Getty Research Institute.
- Stenliden, L., & Nissen, J. (2022). Students’ multimodal knowledge sharing in school: Spatial repertoires and semiotic assemblages. Education and Information Technologies, 27(4), 5665–5688. https://doi.org/10.1007/s10639-021-10837-0
- Strathern, M. (1996). Cutting the network. Journal of the Royal Anthropological Institute, 2(3), 517–535.
- Sundin, O. (2015). Invisible search: Information literacy in the Swedish curriculum for compulsory schools. Nordic Journal of Digital Literacy, 10(4), 193–209.
- Takacs, Z. K., Swart, E. K., & Bus, A. G. (2015). Benefits and pitfalls of multimedia and interactive features in technology-enhanced storybooks: A meta-analysis. Review of Educational Research, 85(4), 698–739. https://doi.org/10.3102/0034654314566989
- Unsworth, L., & Cléirigh, C. (2009). Multimodality and reading: The construction of meaning through image-text interaction. Routledge.
- Walsh, M. (2008). Worlds have collided and modes have merged: classroom evidence of changed literacy practices. Literacy, 42(2), 101–108. 10.1111/j.1741-4369.2008.00495.x
- Walsh, M. (2006). The'textual shift': Examining the reading process with print, visual and multimodal texts. Australian Journal of Language and Literacy, 29(1), 24–37.
- Walsh, M. (2010). Multimodal literacy: What does it mean for classroom practice? Australian Journal of Language and Literacy, 33(3), 211–239.
- Watzman, S. (2003). Visual design principles for usable interfaces. In J. A. Jacko, & A. Sears (Eds.), The human-computer interaction handbook: Fundamentals, evolving technologies, and emerging applications (pp. 263–285). Erlbaum.