
Abstract
Previous research has found that patterns of sheltered homelessness and characteristics of people who use shelters vary between point-prevalence and period-prevalence tallies, but there are no comparable data for unsheltered homelessness. We derive a three-year period-prevalence measure of unsheltered homelessness from data collected in a point-in-time count, by weighting individuals by the inverse number of months, out of the last 36, that they report being homeless. We illustrate using data from the 2022 Point-in-Time Count in Nashville/Davidson County Tennessee, which found 634 unsheltered people. We estimate that the three-year prevalence of unsheltered homelessness would be at least 3.5 times the one-night count, but that far fewer people would meet the US Department of Housing and Urban Development’s definition of chronic homelessness. Over half of people sampled outdoors, especially those living with household members and pets, report never using shelter. Point-in-time counts can yield far more information useful for planning than the simple count itself.
Introduction
In the United States, the Department of Housing and Urban Development (HUD) requires communities to count the number of people experiencing homelessness biennially on a single night during the last 10 days of January (US Department of Housing and Urban Development, Citationn.d.-c). Many communities conduct the counts annually. HUD publishes an Annual Homeless Assessment Report to Congress based on these data. The Point-in-Time or PIT count is the only national effort to assess both sheltered and unsheltered homelessness and is widely cited. The most recent national tally found 582,000 people homeless on a single night in January 2022. Two fifths of these people were classified as unsheltered—that is, sleeping on the street, in encampments, in abandoned buildings, and in other places “not suitable for human habitation.” Both the overall number and the number of people without shelter have increased annually since 2016 (de Sousa et al., Citation2022, pp. iii, 1).
Although the number of people sleeping in shelters and similar programs can be ascertained by calling the programs, the unsheltered count is widely criticized on two grounds. First, the reported number is almost certainly an undercount because rough sleepers often have good reasons to remain hidden (Mosites et al., Citation2021). Indeed, efforts to assess the count, for example by planting confederates where the canvassers are supposed to go to determine whether they are counted or conducting service-based surveys after the count, show that many people are missed (Hopper et al., Citation2008). Counts are often undertaken by people with little methodological training, and methods vary across communities. Researchers (Roncarati et al., Citation2021; Tsai & Alarcón, Citation2022) and a US Government Accountability Report (US Government Accountability Office, Citation2020) urge HUD to undertake various efforts to improve the count. Some (Tsai & Alarcón, Citation2022) suggest replacing the night-time canvass with an effort by homeless service providers to enumerate everyone in a community who is experiencing homelessness in a “by name list.” We know of no effort to evaluate how many people are missed with this approach, particularly in large communities.
This paper focuses on a second problem: Because far more people have an episode of homelessness at some point over a longer period, such as a year or a lifetime, than are homeless on any given night, the one-night count minimizes the problem in the eyes of the public and policymakers. For example, HUD estimates that 1,214,000 people experienced sheltered homelessness at some point during 2021, the last year for which full-year data are available (Henry et al., Citation2023), but only 326,126 were sheltered during the one-night count in January 2021 (de Sousa et al., Citation2022). That is, the one-year period-prevalence measure was 3.7 times as large as the one-night point-prevalence estimate. There is no comparable estimate of period prevalence for unsheltered homelessness. This paper provides a method for calculating one.
Further, the characteristics of people, including disability status and patterns of homelessness (Henry et al., Citation2023), differ in point-prevalence and period-prevalence samples, because people who can extricate themselves from homelessness more readily (or receive more help to do so) differ from people who get mired in that state. This fact has been clearly demonstrated in the case of shelter users, where a homeless management information system can more readily track people’s stays over time across all shelters in a jurisdiction. Pioneering studies of patterns of shelter use across a two- to three-year observation period showed that three quarters to four fifths of both individuals in two jurisdictions (Kuhn & Culhane, Citation1998) and families in four jurisdictions (Culhane et al., Citation2007) had a single relatively short stay in shelter (with length varying by site). Smaller groups had long stays or episodic patterns of multiple stays. Roughly 10% of individuals and 20% of families had long stays, but in each case the long stayers used about half of the total shelter days. Thus, half of the people sampled on a single day would be in the long-stay group. Individuals with long stays and families with repeated stays tended to have more behavioral health problems than other groups, so a point-prevalence sample would overestimate these problems relative to a period-prevalence sample. A larger proportion of those in the point-prevalence sample would meet HUD’s definition of “chronic homelessness,” which requires that people have both a disabling condition and a duration of homelessness of at least a year when sampled or cumulatively over at least four episodes within the past three years (US Department of Housing and Urban Development, Citationn.d.-a). Point prevalence and period prevalence are both useful measures, but they should not be confused.
We illustrate a method of estimating both three-year prevalence for unsheltered homelessness and characteristics of people who experience unsheltered homelessness over that period from data gathered in a PIT count in a single US county. We use self-report data to estimate the extent to which people who are unsheltered on the night of the count use shelters at other times (so they would be captured in period prevalence measures of sheltered homelessness) and examine characteristics of people that shelters fail to accommodate. The method rests on assumptions that we cannot test with the data, and that are no doubt wrong in detail. We do not suggest that the estimates are perfect—simply that they are more accurate than relying on data collected on a single night to characterize period prevalence. We discuss these assumptions and other limitations in the discussion section. We believe that the most important of these limitations suggest that our estimates provide an undercount.
Our core idea is to weight people sampled on the night of the count by the inverse of the fraction of time they have been homeless over the past three years. If a person has been homeless for only one month out of 36, the method assumes that there are another 35 people like him or her who were also homeless for a month at some time in the three-year period, but who are no longer around to be sampled. People who have been homeless the entire time are assumed to represent only themselves. These data are generally available in PIT counts, because HUD requires communities to collect information about disability and the proportion of the last three years a person has been homeless in order to estimate the number of people classified as “chronically homeless” (US Department of Housing and Urban Development, Citationn.d.-c).
Method
The Nashville/Davidson County, Tennessee, Continuum of Care conducted a PIT count on the night of January 27 2022. Twenty-eight teams of counters, typically led by an experienced outreach worker who had canvassed her assigned area to locate encampments and likely sleeping places in the days leading up to the count, fanned out across the 526 square miles of the county. Most teams traveled their area by car, getting out when they encountered someone, or surveying known encampments on foot. As in most other jurisdictions, the count occurred in the middle of the night both because it is easier then to identify people who have no other place to sleep at night, and to avoid double-counting people who might move around earlier in the day or evening.
Counters announced themselves and invited people who were awake to complete a short, anonymous survey with answers entered into a REDCap program on the interviewers’ phones or tablets, offering bus passes as an incentive. (Camping in public places is a felony in Tennessee, and although that was not yet the case in January 2022, many respondents are reluctant to give names.) Interviewers read a brief consent script, secured verbal consent for the interview, asked whether the potential respondent had already completed a survey that night (to avoid double-counting), and if not, asked an additional 33 questions. These covered demographic data (four questions), information about other family or non-family members or pets staying with the respondent that night (nine), duration and patterns of homelessness (five), use of shelters (one), COVID-19 (two), disabilities and disability income (six), experience of violence (one), interest in housing (one), and status as a military veteran (four). The question about shelter use asked whether the respondent had stayed at any of three large named shelter programs (including a winter-sheltering program that places people in a rotating group of churches) “or any other emergency shelter at any time in the past year.”
People named as household members by the first member of a household and who were observed but not interviewed were counted. The count also included people who were observed sleeping and people who declined to complete the survey. In addition, canvassers noted vehicles, tents, and other “signs of life” where no one emerged to converse in the middle of the night and estimated the number of people who might be present, but people who were not actually observed were not included in the count.
Analyses include counts of those interviewed, those observed but not interviewed, and the additional range of estimates for signs of life. We also report characteristics of unsheltered people on the night of the count and over three years based on two projections. First, we impute time homeless and other characteristics of people who were observed but not interviewed to be identical to those of people interviewed in order to project characteristics of all people observed on the night of the count. We assume that whether a person is awake when the canvassers come by and whether a person chooses to answer questions at 02:00 are independent of both time homeless and other characteristics. Second, as explained in the core idea above, we project the three-year period prevalence of all who experienced unsheltered homelessness by weighting each person observed by the inverse proportion of time, measured in months, that the person was homeless over the last three years. We additionally examine family characteristics and the presence of pets that area shelters do not accommodate to understand the proportion of respondents who are unable to use shelters.
Results
In January 2022, canvassers observed 634 people who were homeless and unsheltered, and interviewed 347, of whom the 307 who reported number of months homeless are used to compare the observed distribution to the projected three-year distribution. Additionally, between 184 and 251 people were recorded in the “signs of life” count, but not included in the remainder of this article or reported to HUD. Examples include: “enclosed cargo truck and trailer with clothing hanging, camping equipment, tarps, and other items” (estimate of 2–4 people); “large refrigerator-sized box lying on side; appeared intentionally placed [with] fast food drink cups placed by opening” (1 person); “structure with tarps used for shelter, evidence of campfire, previous contact with person” (1 person); “encampment with 3 tents, tarps, clothing piles and other stray items/objects” (3–6 people). An additional 64 people who were in jail for under 90 days gave their address, as listed in jail records, as a local shelter, but some of them were probably sleeping rough.
The projected three-year unsheltered count (based on the one-night count of 634 and the projection from those who answered the question about months) is 2,208, or 3.5 times those who were observed on a single night. This number does not include people in the “signs of life” count, people in jail for short terms, or people who were doubtless missed by teams canvassing large territories in cars, so it is clearly an underestimate.
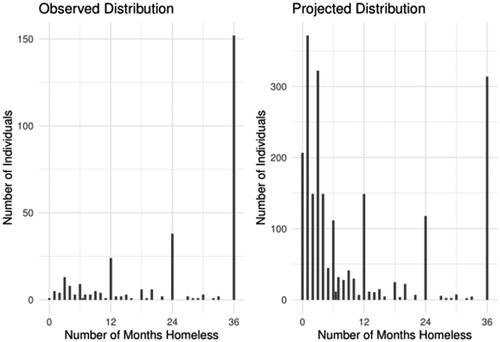
shows the observed distribution of months that people reported being homeless out of the last 36 (mean = 25.0, standard deviation [SD] = 12.6) and the projected distribution over a three-year period (mean = 10.3, SD = 12.5), with each person in the observed distribution weighted by the inverse proportion of reported time homeless. The projected distribution has a far larger proportion of people with short stays. Both distributions show spikes at one, two, and three years, a likely result of rounding length of time homeless in self reports, but the proportion who were homeless the entire three-year period (and often much longer) was far lower in the three-year projection (roughly one in seven) than in the one-night count (roughly one half).
Figure 1. Number of months homeless during the last 36 months as reported by 307 respondents who answered a question about months homeless during the unsheltered Point-in-Time Count in Nashville/Davidson County in January 2022, and projection to 2,208 people who experience homelessness over three years by weighting each person observed by the inverse of the proportion of time homeless. People who were observed but declined interviews or did not report time homeless are included in the projection, on the assumption that their distribution is the same as that of respondents who did report.
shows the characteristics of unsheltered people in the three-year projection and the one-night count (based on information from the 307 who reported number of months homeless, so that the distributions are comparable). We do not report confidence intervals since the count is not a sample from a larger population but suggest caution in interpreting low percentages or small percentage differences.
Table 1. Characteristics of 307 respondents who answered a question about months homeless during the unsheltered Point-in-Time Count in Nashville/Davidson County in January 2022, and projection to 2,208 people who experience homelessness over three years by weighting each person observed by the inverse of the proportion of time homeless.
The demographic characteristics of the projected sample are quite similar to those of the observed sample. The observed sample was about a year older than the projected sample and slightly less likely to be male (72% vs. 77%), but the racial distribution was similar. As elsewhere in the country (de Sousa et al., Citation2022), African Americans, who are overrepresented among people experiencing homelessness, are much more likely to be found in shelter than outside (constituting 42% of the total combined sheltered and unsheltered count of 1,916), but only 23% of those found unsheltered; African Americans make up 27% of the county’s population. About three tenths of respondents (in both the observed and projected distributions) said that they were with another household member (in only one case was this a minor child) or had a pet.
The largest difference between the observed and projected distributions was in patterns of homelessness, where, in addition to having shorter durations of homelessness, people projected to be homeless over three years were more likely be in their first episode (ever) and to have had only one episode of homelessness in the past three years.
People in the one-night sample reported higher levels of physical disabilities, substance use disorders, and any disability, but only slightly higher levels of mental illness than in the projected distribution. Thus, 56% of people interviewed in the one-night sample met HUD’s criteria for chronicity, compared to 30% in the projected distribution, although nearly identical percentages reported receipt of Supplemental Security Income/Social Security Disability Income (SSI/SSDI) (18% vs. 17%). Other characteristics reported by unsheltered interviewees on the night of the count were similar to the three-year projections. Almost everyone said they would be interested in housing if their needs were met.
Only 45% of unsheltered people who were interviewed on the night of the count said that they had used any homeless shelter at any time in the past year. This percentage was slightly lower than in the projected distribution. Not surprisingly, people living with other household members and pets were less likely to have used shelters: Χ2 (1, n = 288) = 4.44, p < .05.
Discussion
Limitations
This study clearly has important limitations. Some pertain to all one-time counts conducted with sleepy people in the middle of the night by interviewers who may be experienced outreach workers but are typically untrained in survey research. Counts miss people and data are based on self-report which include people’s own assessment of disabilities and the limits of memory (as shown, for example, in the annual spikes in the distribution of time homeless). Recall may be even more difficult when people are living unsheltered, especially if they are grappling with mental health or substance abuse. People’s own definition of “episode” may vary from HUD’s, which requires a break of seven consecutive nights of not living homeless to begin a new episode (US Department of Housing and Urban Development, Citationn.d.-a). Note that our projected count does not depend on the number of episodes, which are used only in determining whether a person meets HUD’s definition of “chronic” homelessness. HUD accumulates these data in Annual Homeless Assessment Reports to Congress because, however flawed, they are the best available.
Estimation of the number of “total months” someone has been homeless is too coarse a metric. A person coded as having been homeless for one month could have been homeless for any period between one day and 45 days. If the actual time homeless was one day, then our multiple (the inverse of the proportion of the last three years) should be 1,096; if two days, 548, and so forth. If the distribution over the 45 days was uniform, the average multiple would be 108, or 3 times as large as the multiple (36) we used in our estimation, resulting in a serious undercount. If the data skewed toward shorter periods, the multiple and the resulting undercount would be even larger. Uncertainty is much less problematic at the other end of the three-year distribution. As a result, it is virtually certain that our method yields an underestimate. The fact that we had only six respondents coded as homeless for one month means the problem is not as large as it could be, but interviewer notes said that one of these respondents was homeless for only a day.
Our method of projecting distributions has additional limitations. Our response rate was not high, but short of waking people up in the middle of the night, which canvassers did not do, it is unlikely to improve. Our method assumes stationarity—no trends over time and no seasonal trends. Both these assumptions are at best approximate. If, as seems likely, more people have new episodes and short episodes of unsheltered homelessness over the summer, then our three-year period-prevalence estimate, which misses these people, is an underestimate. Such people may be more likely to use shelters when the weather turns colder, increasing the small observed difference in shelter use between the point-prevalence and period-prevalence projections. If unsheltered homelessness is increasing over time, we overestimate prevalence for the 2019–2022 period, but may underestimate it for three years beginning in 2022. If people’s characteristics change over time (for example, acquiring a substance abuse habit or acquiring or losing a household member), or if people with particular characteristics are more or less likely to agree to be interviewed, this too would affect projections. Our method also assumes that an individual’s days of homelessness are scattered independently over the three-year period rather than clustered into episodes, an assumption that is clearly wrong. Given all these sources of imprecision, fine-grained interpretations of exact numbers and small differences should be avoided.
Conclusions
As serious as these limitations are, they are unlikely to change the overall conclusions. The projection shows that far more people experience homelessness over a three-year period than were homeless on a single night, and a much lower proportion of them would be classified as chronic by HUD’s definition. HUD’s one-night count of people in shelters is only about 27% as high as people who use shelters over a year. We project that in the study community, the one-night count of unsheltered people is about 29% as high as the number over three years, and fewer than half of those people would be included in a sheltered count. The limitations we have detailed suggest that our estimate is an undercount. These ratios no doubt vary from community to community, but we provide a method for communities to make their own estimate, using information that HUD requires them to collect. Although we have clear evidence that the PIT count misses people, both from the “signs of life” observations and from the impossibility of surveying a large geography in a single night, our projection is based only on people actually counted. The total number of people experiencing homelessness is likely to be substantially higher.
The study also suggests some important reasons that people decline to use shelters. Nashville shelters are not set up to accommodate family configurations other than a mother and with minor children, but other configurations, including couples and people with adult children, are common outdoors, as are people with pets. (A cold-weather shelter, open only a few days each year, will kennel pets.)
Suggestions for Improving Counts and Estimates of Period Prevalence
To determine whether people meet the criteria for chronic homelessness, HUD requires that PIT counts record the proportion of the past three years each person has been homeless. Thus, the data we used are widely available. Estimates would be improved if communities adopted the language HUD suggests in their Model Interview (US Department of Housing and Urban Development, Citationn.d.-b) : “if you add up all the times you have been homeless in the last 3 years, how long have you been homeless [ENTER DAYS OR WEEKS OR MONTHS OR YEARS],” although this will require a bit more interviewer training. Recall might be better for shorter periods, such as a year, and would yield a one-year prevalence. However, determining “chronic” status would require a follow-up question (e.g., “How about over the past three years…”).
In jurisdictions with excellent homeless outreach and universal entry of people encountered by outreach workers in homelessness management information systems or by-name lists, those systems could be used to obtain period-prevalence estimates of homelessness. If people are willing to give names in a PIT count, the coverage of those lists could be evaluated, and prevalence measures could be inflated by the proportion of people found during the count who are not already known to outreach. If length of time homeless is correlated with the likelihood that a person is found in the list of people known to outreach, time homeless could be used to refine the inflation factor. Outreach contacts over time could also be used as an alternative estimate of time homeless.
Broader Implications
HUD, homeless service providers, and city planners need to understand that the widely reported point prevalence of homelessness on a single night in January is a vast underestimate of people who experience homelessness over a period of time. Our study shows that unsheltered homelessness, like sheltered homelessness, is most often a one-time experience, even though half of people who may be observed at a single point in time have more chronic patterns. Homelessness is a temporary state that most people can put behind them, with varying degrees of help from the homeless service system and other resources. If planners misunderstand “the homeless” to be a static population, they will underestimate the resources needed to end homelessness. On the other hand, the proportion of people meeting HUD’s definition of chronicity is overestimated in the PIT count relative to a period-prevalence measure. This affects estimates of the types of housing people need to exit from homelessness.
The study also shows the ways that social policies shape what is known about homelessness. For example, although HUD describes adults in households without children as “people experiencing homelessness as individuals,” this does not mean that they lack family ties. Previous studies have shown that many families who experience homelessness have partners or minor children from whom they are separated, sometimes at the shelter door, because shelters will not accommodate them (Shinn et al., Citation2015). In the study community, a fifth of people who were unsheltered had other household members with them, a proportion that rises to nearly a third if we include pets. No doubt, as in other studies, additional adults had minor children who were not with them (Burt et al., Citation1999; Kushel et al., Citation2023). One reason that people remain unsheltered is that shelter policies do not permit them to stay with their loved ones, or their beloved pets (Henwood et al., Citation2021). Both shelters and housing options should be designed to allow households to remain intact.
Finally, although this is not new, this study reaffirms that people who are unsheltered are more likely than shelter users to be white, perhaps because living in a public place is especially hazardous for members of minority groups. Thus, communities that give priority for housing to people who are unsheltered effectively give priority to white people (Shinn & Richard, Citation2022). Racial justice demands that African Americans and Native Americans who face structural as well as individual barriers to housing and disproportionate rates of homelessness should not be pushed to the bottom of the line because they accept shelter.
Acknowledgments
We thank Alaina Boyer, Joshua Barocas, and Bobby Watts for consultation on the method reported here.
Disclosure Statement
The authors report there are no competing interests to declare.
Additional information
Notes on contributors
Marybeth Shinn
Marybeth Shinn, PhD is a Cornelius Vanderbilt Chair and professor at Vanderbilt University, Peabody College, Department of Human and Organizational Development. She studies how to prevent and end homelessness for different groups. She is a member of the Nashville/Davidson County Homelessness Planning Council.
Hanxuan Yu
Hanxuan (Astrid) Yu, MS, is a health policy data analyst in the Department of Health Policy at Vanderbilt University Medical Center. She applies a range of analytical methods, including discrete event simulation, microsimulation, and the Markov model, to address practical questions and support decision-making in the public health field.
Alisa R. Zoltowski
Alisa Zoltowski, PhD, received a double BS in biopsychology, cognition, and neuroscience (BCN) and statistics from the University of Michigan, and a PhD from the Vanderbilt Neuroscience Graduate Program, working in the Laboratory of Affective and Sensory Research (@AutismLASR). She is currently a postdoc in the Vanderbilt University Medical Center Department of Psychiatry.
Hao Wu
Hao Wu, PhD is an associate professor of psychology and human development. His research focuses on the evaluation of statistical models used in behavioral sciences, especially structural equation models. This includes identifiability, the quantification of various sources of uncertainty, model fit and effect size. Other interests include robust and nonparametric methods, hypothesis tests under nonstandard situations, and applied research with collaborators.
References
- Burt, M. R., Aron, L. Y., Douglas, T., Valente, J., Lee, E., & Iwen, B. (1999). Homelessness: Programs and the people they serve. Findings of the National Survey of Homeless Assistance Providers and Clients. The Urban Institute. https://www.urban.org/sites/default/files/publication/66286/310291-Homelessness-Programs-and-the-People-They-Serve-Findings-of-the-National-Survey-of-Homeless-Assistance-Providers-and-Clients.PDF
- Culhane, D. P., Metraux, S., Park, J. M., Schretzman, M., & Valente, J. (2007). Testing a typology of family homelessness based on patterns of public shelter utilization in four US jurisdictions: Implications for policy and program planning. Housing Policy Debate, 18(1), 1–28. https://doi.org/10.1080/10511482.2007.9521591
- de Sousa, T., Andrichik, A., Cuellar, M., Marson, J., Prestera, E., & Rush, K. (2022). The 2022 Annual Homelessness Assessment Report (AHAR) to Congress: Part 1: Point-in-time estimates of homelessness. Department of Housing and Urban Development. https://www.huduser.gov/portal/sites/default/files/pdf/2022-AHAR-Part-1.pdf
- Henry, M., Travis, A., de Sousa, T., Marson, J., Prestera, E., & Tano, C. (2023). The 2021 Annual Homeless Assessment Report (AHAR) to Congress, Part 2: Estimates of homelessness in the United States. Department of Housing and Urban Development. https://www.huduser.gov/portal/sites/default/files/pdf/2021-AHAR-Part-2.pdf
- Henwood, B., Dzubur, E., Rhoades, H., St. Clair, P., & Cox, R. (2021). Pet ownership in the unsheltered homeless population in Los Angeles. Journal of Social Distress and Homelessness, 30(2), 191–194. https://doi.org/10.1080/10530789.2020.1795791
- Hopper, K., Shinn, M., Laska, E., Meisner, M., & Wanderling, J. (2008). Estimating numbers of unsheltered homeless people through plant-capture and postcount survey methods. American Journal of Public Health, 98(8), 1438–1442. https://doi.org/10.2105/AJPH.2005.083600
- Kuhn, R., & Culhane, D. P. (1998). Applying cluster analysis to test a typology of homelessness by pattern of shelter utilization: Results from the analysis of administrative data. American Journal of Community Psychology, 26(2), 207–232. https://doi.org/10.1023/A:1022176402357
- Kushel, M., Moore, T., Birkmeyer, J., Dhatt, Z., Duke, M., Knight, K. R., & Ponder, K. Y. (2023). Toward a new understanding: The California Statewide Study of people experiencing homelessness. UCSF Benioff Homelessness and Housing Initiative. https://homelessness.ucsf.edu/our-impact/our-studies/california-statewide-study-people-experiencing-homelessness
- Mosites, E., Morris, S. B., Self, J., & Butler, J. C. (2021). Data sources that enumerate people experiencing homelessness in the United States: Opportunities and challenges for epidemiologic research. American Journal of Epidemiology, 190(11), 2432–2436. https://doi.org/10.1093/aje/kwab051
- Roncarati, J. S., Byrne, T. H., & McInnes, D. K. (2021). Invited commentary: Data sources for estimating numbers of people experiencing homelessness in the United States—Strengths and limitations. American Journal of Epidemiology, 190(11), 2437–2440. https://doi.org/10.1093/aje/kwab104
- Shinn, M., Gibbons-Benton, J., & Brown, S. R. (2015). Poverty, homelessness, and family break-up. Child Welfare, 94(1), 105–122. https://www.ncbi.nlm.nih.gov/pmc/articles/PMC5760188/
- Shinn, M., & Richard, M. K. (2022). Allocating homeless services after the withdrawal of the vulnerability index-service prioritization decision assistance tool. American Journal of Public Health, 112(3), 378–382. https://doi.org/10.2105/AJPH.2021.306628
- Tsai, J., & Alarcón, J. (2022). The annual homeless point-in-time count: Limitations and two different solutions. American Journal of Public Health, 112(4), 633–637. https://doi.org/10.2105/AJPH.2021.306640
- US Department of Housing and Urban Development. (n.d.-a). Definition of chronic homelessness. Retrieved July 22, 2022, from https://www.hudexchange.info/homelessness-assistance/coc-esg-virtual-binders/coc-esg-homeless-eligibility/definition-of-chronic-homelessness
- US Department of Housing and Urban Development. (n.d.-b). Model interview based unsheltered night of count survey. Retrieved November 4, 2023, from https://files.hudexchange.info/resources/documents/Model-Interview-Based-Unsheltered-Night-of-Count-PIT-Survey.pdf
- US Department of Housing and Urban Development. (n.d.-c). Point-in-time count and housing inventory count. Retrieved July 7, 2023, from https://www.hudexchange.info/programs/hdx/pit-hic
- US Government Accountability Office. (2020). Homelessness: Better HUD oversight of data collection could improve estimates of homeless population. https://www.gao.gov/assets/gao-20-433.pdf