
 ?Mathematical formulae have been encoded as MathML and are displayed in this HTML version using MathJax in order to improve their display. Uncheck the box to turn MathJax off. This feature requires Javascript. Click on a formula to zoom.
Abstract
Governmental and educational organizations have pointed out that students coming into the biological sciences require stronger skills in statistics and data modeling that are not usually addressed in typical engineering-based calculus courses. Our work here documents how faculty in biology and mathematics addressed this issue at a large urban university in the southwestern USA. The Calculus for Life Sciences course was redesigned to integrate data analysis and engage students in activities connecting the foundational and practical aspects of statistics-based calculus for professionals in life sciences. The goal was to obtain a better-prepared cohort of students with a positive perception of the use of mathematics and statistics in their careers. Over the course of four semesters, the course doubled the average enrollment of students, the failure rate reduced by more than 50%, and students reported positive attitudinal responses regarding the application of math to biological studies. The perception of mastery reported by students throughout the semester, however, did not correlate with the mastery of skills demonstrated on graded activities. This article provides a case study of the successes and pitfalls that we encountered as we attempted to shift all aspects of the course, including pedagogy, grading, and curriculum.
1. INTRODUCTION
Calls for increasing STEM students’ quantitative skills have been gaining increasing urgency in recent years as employers and policymakers strive to maintain competitive positions in an ever-changing and technologically advanced global marketplace [Citation16,Citation13,Citation14]. Many jobs currently rely on data-driven decisions that require quantitative thinking in different contexts, and mathematics is the underlying conceptual and technical common language. Therefore, the task of preparing students to work in integrated fields has to be shared across both mathematics and client discipline faculty. The Mathematical Association of America (MAA) has been discussing this concern for over two decades. In 2000, their Committee on Curriculum Renewal Across the First Two Years (CRAFTY) held a series of workshops across the USA with faculty from partner disciplines to assess curricular changes in mathematics that could set their students up for success in the advanced disciple courses. These conversations began with faculty from traditional science disciplines such as biology and chemistry and later branched into others such as public health, nursing, and economics. The first publication, called “Curriculum Foundations Project: Voices of the Partner Disciplines,” includes short summaries of recommendations regarding shifts in topic emphasis [Citation8]. In our work, we focused on the report discussing trends in the life sciences [Citation5], which summarizes the group’s discussion of how much mathematics knowledge—and what particular skills—biology majors need as they progress through their undergraduate studies.
Dilts and Salem [Citation5] described several themes that emerged:
New areas of biological investigation, together with advances in technology, have resulted in an increase in the quantification of biological theories and models.
The collection and analysis of data that is central to biological investigations inevitably leads to the use of mathematics.
Mathematics provides a language for the development and expression of biological concepts and theories. It allows biologists to summarize data, describe it in logical terms, draw inferences, and make predictions.
Statistics, modeling, and graphical representation should take priority over calculus.
The teaching of mathematics and statistics should use motivating examples that draw on problems or data taken from biology.
Creating and analyzing computer simulations of biological systems provide a link between biological understanding and mathematical theory.
The report also recognized the value of using spreadsheet applications. They conclude, “One important software application used by biologists is the spreadsheet. Increasingly, spreadsheet applications contain sophisticated statistical tools sufficient for use with undergraduate biology majors.”
This report resonated with other initiatives in STEM. The study titled The Mathematical Sciences in 2025 by the National Research Council advocated for mathematical sciences to be conducted cross-disciplinary [Citation10]. The Society for Industrial and Applied Mathematics (SIAM) advocated the importance of mathematical modeling throughout the undergraduate curriculum [Citation19]. The Common Vision project of the mathematics professional societies advocated for integrating mathematics and statistics [Citation18]. The National Academy of Sciences emphasized similar needs in the Bio2010 reports regarding the importance of mathematics and modeling in the future of biology [Citation12].
These initiatives have triggered the interest of researchers and educators working at the interface of mathematics and biology to develop new approaches integrating more modeling and statistics in life science courses [Citation1], although the large-scale change that advocates had hoped to see has not occurred yet. To strengthen and expand these efforts, NSF funded a National Consortium for Synergistic Undergraduate Mathematics via Multi-institutional Interdisciplinary Teaching Partnerships (SUMMIT-P) project that includes mathematics faculty from across the country working with faculty in a variety of client disciplines that range from biology and engineering to nursing and economics. The work among the 10 projects of SUMMIT-P varies. Some sites are developing units to augment current mathematics courses while others are developing or revising courses designed to fully integrate mathematics and the client discipline course. As part of the SUMMIT-P initiative, our group of faculty at a large urban university in the southwestern USA has chosen the latter path: we have been working on redesigning the Calculus for the Life Sciences course, aligning with other researchers in the SUMMIT-P initiative that are developing new frameworks to integrate modeling and statistics in life science courses [Citation6, Citation7, Citation3].
This report covers the redesign effort on Calculus for the Life Sciences spanning four semesters, from Fall 2017 to Spring 2019. Prior to the redesign, the Calculus for the Life Sciences course had experienced a drop in enrollment due to several factors, perhaps including the rumored student concern about the degree of the demanding mathematical content needed to succeed. We predicted that a redesigned course that focused on quantitative concepts aligned with the prescriptions from CRAFTY would increase student enrollment and better prepare students to apply quantitative reasoning to biological concepts.
2. METHODS
2.1. Course Description Prior to Redesign
The original Calculus for the Life Sciences was a mathematics course that developed traditional basic concepts of calculus with life science applications. The topics were arranged linearly, beginning with differential and integral calculus and culminating with an introduction to elementary differential equations. It was designed for biology students with examples connected to biological problems. For example, maxima and minima were studied in the context of Circadian Body Temperature [Citation9]. In the lab sections, computer skills (including Excel and Maple) were developed and applied to more complex biological models. The course followed the textbook “Calculus: A Modeling Approach for the Life Sciences” by Mahaffy and Chavez-Ross [Citation9]. The lecture material was 70% of the grade. The remaining 30% corresponded to the lab. Three-fourths of the lecture score was based on exams and final, and the rest was divided between homework graded using the online platform WeBWork and lecture participation.
2.2. Conceptual Framework for the Redesign
Our redesign was driven by two conceptual changes with respect to the course described above. The first conceptual change was to motivate mathematics based on social and scientific contexts that students could relate to. This was prompted by the fact that students were not expected to have completed any college biology course in their program by the time they had enrolled in the course. The examples from the course prior to the redesign were extracted from ecological, physiological, molecular, and cellular contexts that students were not necessarily familiar with or had no apparent connection with their career interests. A student interested in microbiology, for example, may find little insight in having to learn a foreign example on megafauna to motivate the learning of a new mathematical method. Besides, learning mathematics using specialized and elaborated biological examples can lead students to think that mathematical models are only useful in complex biological contexts. Our aim instead was to use data analysis and quantitative reasoning as a pragmatic and strategic use of mathematics. The motivation was to help students identify that they could use those skills in their professional careers, for example, by analyzing data in industrial and research laboratories, as well as in more personal areas, such as judging data trends in the news or in their own finances. The second conceptual change was the need to identify the mathematics that students needed in their biology program and its relation to data analysis, as well as the aspects of calculus that were most relevant to support this mathematical education. For example, regression methods facilitate the analysis of data by fitting mathematical models. Interpreting these models (in terms of rates), generating these models from first principles, and understanding the fitting process (minimization using the least-squares method) requires calculus. Our compromise was to focus on a handful of models that arise in most biological contexts, providing a toolset that would help students in their future careers, from biological research to the judgment of new treatments as medical doctors.
2.3. Student Characteristics
All undergraduates enrolled in our course were part of programs that required a college math course in the first year. Half of the students in Calculus for the Life Sciences were biology majors; the rest of the students’ majors were distributed, for the most part, among environmental sciences or kinesiology, or they were undeclared majors. As a reference, the size of the freshman biology cohort was about 325–375 students per academic year, and the number of students enrolled in our course during these four semesters was in the 80–100 range per semester (160–200 per academic year).
2.4. Course Organization
Calculus for the Life Sciences was a 4-unit course. Three units were associated with the lecture formats, offered to all students twice a week for 75 min per session. In addition, each student was required to enroll in a 1-unit lab that was divided into sections of 10–35 students. These labs, which met once a week for 160 min, were designed to provide more active learning opportunities. This reinforced the contents of the lecture and included both computer-based activities using spreadsheets to model data and hands-on simulation projects. The lectures and labs were both aligned with the two conceptual principles of the redesign, using relatable contexts to motivate mathematics and justifying the need for calculus in biology.
2.5. Content Redesign
Prior to the redesign, the working group met with instructors in courses related to Biostatistics, Chemistry, Ecology, Molecular Biology, and Genetics. These courses require mathematical skills, and students in life sciences take them concurrently or after Calculus for the Life Sciences. Materials and recommendations from those instructors were considered for the redesign of the course to reinforce concepts that are key in the development of students in life sciences’ programs. The basic mathematical skills that were discussed included: how to apply mathematical skills to expressions that use different symbols as well as use the definition and properties of derivatives and definite integrals to interpret biological rates and balances (like in cell metabolism) and probabilistic concepts (like in Genetics). The first iteration of the course redesign was implemented in Fall 2017 and included the following learning outcomes.
Analyze data combining basic statistics and linear regression methods using linear and non-linear mathematical models that are common in life sciences.
Interpret visually the instantaneous rate of change of common functions in life sciences and derive mathematically the main properties of derivatives.
Apply the properties of derivatives to study generic functions and solve rate and optimization problems.
Interpret visually the definite and indefinite integrals of a function and derive mathematically the main properties of integrals.
Apply the properties of integrals to solve differential equations associated with rate problems as well as obtaining statistical properties of common probability distributions in life sciences.
Plot, analyze, and manipulate data using Google spreadsheets.
These outcomes were aligned with the following CRAFTY recommendations: (2) focus on collection and analysis of data that is central to biological investigations, (3) help students summarize data, describe it in logical terms, draw inferences, and make predictions, (4) emphasize statistics, modeling, and graphical representation over complex calculus procedures, (5) use motivating examples using biological problems and data, (7) use of spreadsheets applications. This was supported by input from faculty teaching biology at our institution.
Building on material prior to the redesign, the course was organized into three parts: I. Functions, II. Derivatives, III. Integrals (see Supplementary File 1). Statistical concepts were introduced in the first and third parts of the course. The concepts of mean, standard deviation, and linear regression (least-squares method) were introduced during the first three lectures to analyze data, generate mathematical functions from data, and motivate the need for mathematical optimization. The study of functions included common models in biological sciences that could be transformed to linear functions, for example, exponentials (population growth), power functions (rank distributions), and rational functions (Michaelis–Menten kinetics). Specific data examples are provided in the Supplementary File 2. These concepts were also used to support students’ use of mathematical reasoning. For example, having students prove that when a data set is multiplied by a factor (e.g., changing units), the mean and standard deviation are rescaled by that same factor. At the end of the semester, students used indefinite integrals to solve differential equations to obtain a mechanistic insight of the initial models using growth rate and decay rate terms. Definite integrals were used to calculate the mean and standard deviation of common probability distribution functions found in biology (uniform, exponential, and normal distribution).
The mathematical concepts in the course were approached from both foundational and applied angles. The goal from the foundational perspective was to provide mathematical proofs to the applied methods used in the course. Students, for example, were challenged to use the definition of derivative to calculate the instantaneous rate of change of functions such as . This was aimed to help them understand the relationship between derivatives and rates, obtain the emerging rules of derivatives from the definition, and appreciate the practicality of applying derivative rules instead of the definition when calculating derivatives of functions in general (see Supplementary File 1).
The goal from the practical perspective was to support the professional development of students by motivating their learning in mathematics using topics that students could relate to (not all students had taken college biology courses at this point). The section on statistics and functions used data, for example, from social media and human populations (Earth and US cities), and enzymatic reactions; the section on derivatives and integrals used, in addition to examples from medical drugs, familiar contexts from social media (analyzing trends on likes) or popular culture such as escaping zombie apocalypse scenarios. This aligned with the first conceptual redesign principle: using examples to which students can relate to. The weekly lab session was also redesigned so students would apply calculus methods to investigate additional examples and problems using spreadsheets for data analysis, applying the technology recommendation of the CRAFTY report for Biology. Google spreadsheets were adopted so students could store, manipulate, graph, and analyze data. Google spreadsheets were easily shared, which facilitated the collaboration of students working on team lab projects. Throughout the semester, student lab teams used shared Google Docs to generate Handbooks of Calculus for Life Sciences that summarized the main techniques and applications practiced.
2.6. Grading Redesign
Contract grading aligns grades with mastery of specific skills [Citation11]. This is a non-traditional grading scale that aims to help students assess their own progress. It also gives students a better idea of what “A work” involves distinguishing problems as more difficult than those that comprise “B” work. It also delineates specific benchmarks for passing, that is, “C” work. This can be contrasted with typical average grading where a student can earn a “C” after receiving an A in one section but also receiving an F (failing to show any understanding) in another.
In our redesign, the C level grading involved tests of basic skills. The skills of students were tested individually in three midterms exams related, respectively, to functions, derivatives, and integrals (Fall 2018 only included the first two midterms). These exams covered fundamental concepts, such as definitions and mathematical procedures. Each student also had to complete take-home problems that covered a broader range of skills in Bloom’s taxonomy. Each section in an exam problem or take-home problem was coded to assess a specific skill and was graded with no partial credit (i.e., 0 or 1). The take-home problems were assigned based on a level: C, B, and A (see samples in Supplementary File 3). The team project in the lab was graded as a group. The alignment of grades and skills is described in .
Table 1. Contract grading adopted initially in the course redesign.
In Spring 2018, adjustments were made to grading by adding the third midterm, projects, and modifications to the long-term activity in the lab. Instead of a Handbook, students worked on a semester-long experiment on population dynamics. The students used M&M candies of various colors to model a population of organisms, where the traits were the color and position of the letters “M&M” (up or hidden) of each M&M were drawn randomly from a container. Students generated replicates based on different rules to remove or keep specific M&Ms in the population. In the first part of the semester, the data were used to practice calculating means and standard deviations, model fitting, and using the model (function) for predictions. As derivatives and integrals were covered in the course, students investigated mechanistic terms of growth and decay to generate a model consistent with the data. These changes in focus reflected the CRAFTY emphasis of using findings to generate hypotheses to motivate new experiments or explain observations. The lab required a final report based on a long-term problem that involved experiments, modeling, and analysis. This evaluated the students’ ability to work in teams to solve a real problem, write a professional report, and summarize their work in an oral presentation, which addressed departmental learning outcomes for the major.
In Fall 2018, the course design was very similar to that of Spring 2018, but the contract grading system was changed to a more traditional grading system, where exams contributed 60%, homework contributed 30%, and the lab activities contributed 10%, with a traditional grading scale. In the contract grading adopted in prior semesters, it was more difficult to assess the grade of a student during the semester, and that had been a source of student concern. Table S1 provides the relation between the cumulative percentual score and the letter grade.
In Spring 2019, we adopted the textbook by E.N. Bodine, S. Lenhart, and L.J. Gross entitled “Mathematics for the Life Sciences” [Citation1]. In prior semesters, formal lecture notes and supplemental course materials were disseminated online via the course management system, with no textbook. This was difficult for students seeking extra practice examples. Therefore, we chose a textbook that had been adopted by other colleagues in the NSF SUMMIT-P initiative and reflected CRAFTY recommendations and the pedagogical philosophy of the course combining data analysis and calculus [Citation6]. Specific sections, examples, and problems from the textbook were recommended in each class as reinforcement for concepts practiced in the course.
2.7 Survey Instruments
Two surveys were used to measure student engagement. The first, called a Knowledge Survey, was developed by the instructor to be linked to the course learning outcomes. The second was designed by the SUMMIT-P evaluators to provide formative feedback from all 10 of the project sites. We first describe the two surveys in more detail and then compare the results of these surveys to the enrollment and actual performance of students across the four semesters.
2.7.1. Knowledge Survey
The Knowledge Survey (KS) instrument organized the course’s expected student learning outcomes in sequential tasks associated with specific skills and abilities [Citation15,Citation20,Citation2]. Each task was associated with a level in Bloom’s Taxonomy (e.g., remembering, explaining, applying, analyzing, evaluating, and creating). The Knowledge Survey contained 173 items (see Supplementary File 4). For each skill, there were three possible responses:
Yes, I can complete the task (scored as 1 point)
I could complete the task after reviewing the material for at most 20 min (scored as 0.5 points)
No, I cannot complete the task (scored as 0 points).
The survey was administered online via the course management system. Students completed this self-assessment of their perceived competencies at the beginning (KS1), middle (KS2), and end (KS3) of the course, and received summary scores reflecting their self-perception of mastery. The KS was designed to indicate specific skills that students could focus on improving during course activities. Assuming that student perceptions were accurate, the KS results provided indicators to help the instructor and TAs develop activities that were aligned with student progress towards the specific goals of the course.
Basic statistics were used to compare results among the three sample dates and among semesters [i.e., mean, median, first and third quartiles (Q1 and Q3)]. The data were not normally distributed; therefore, a Wilcoxon test [Citation4] was applied to compare the means of Spring 2019 (last semester) and every other semester at the same sample time, that is, KS1 vs. KS1, KS2 vs. KS2, and KS3 vs. KS3.
The distribution of scores of each KS was also compared with the final performance score of each student. The performance of students was defined as the global score (weighted as 60% tests, 30% HW, and 10% lab) for students in Fall 2018 and Spring 2019. Student performance in the initial two semesters was based on contract grading, so the performance score was calculated by transforming the final letter grade into a numerical value, using the midpoint of a traditional range used in the following two semesters, from 0 to 100 range (see Table S1 for the score grading scheme). The Pearson correlation coefficient was calculated for the global score as a function of the Knowledge Survey score for each sample time each semester [Citation17].
2.7.2. Attitude Survey
The attitude survey was developed as an internal tool for formative assessment, deployed at each of the 10 SUMMIT-P campuses during the final few weeks of each semester (Supplementary Material, SUMMIT-P Student Attitude Survey). There were 27 items with Likert scale responses attempting to gauge students’ perceptions of mathematics in general, the nature of doing mathematics, and their views of applications in a mathematics course (this was also used in mathematics courses for business, economics, nursing, etc.). It has been used for evaluation for other projects, but its validity has not yet been verified. Thus our use can inform the larger project regarding construct validity. The questions were aggregated into three constructs: (a) math flexibility (), (b) thinking versus “plug and chug” (i.e., simply requiring rote memory and repetition) (), and (c) application and real-world value (). Item 6 did not fit in the constructs and was discarded.
Table 2. Math flexibility questions.
Table 3. Thinking versus “plug and chug” questions.
Table 4. Application and real world value related questions.
3. RESULTS
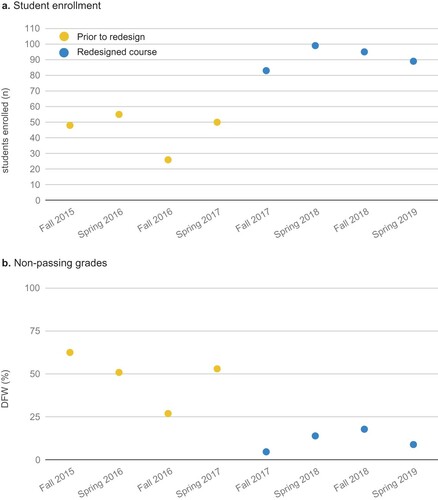
The number of students enrolled in the course after the redesign doubled over the four semesters (a). The average number of students in the four semesters prior to the redesign was 45 ± 13 (SD), in contrast with 91 ± 7 after the redesign. The first semester of the redesign registered a significant increase in student enrollment (83 students); this number has been more stable than the variations in enrollment prior to the redesign (standard deviation of 7 versus 13). The redesign also had a positive impact on reducing the non-passing grades (b). The average non-passing percentage (DFW; students earning grades D, F, or withdrawal) declined from 48 ± 15% (SD) to 11 ± 6% when comparing the four semesters before and after the redesign. The percentage of non-passing grades declined dramatically in the first semester of the redesigned course (4.8%), then subsequently increased, remaining within the 10–20% range (see detailed data in Table S2).
Figure 1. Enrollment and grades. (a) Number of students enrolled (n) each semester. (b) Percentage of non-passing grades for each semester (DFW represents students who earned grades of D and F or unofficially withdrew). The colors are associated to the data of the course prior to the redesign (yellow) and the redesigned course (blue).
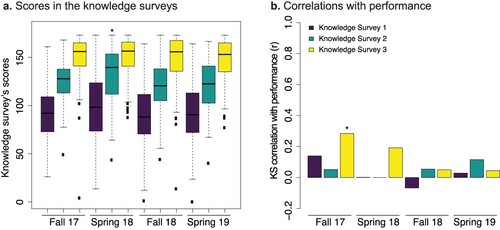
The scores obtained in the Knowledge Survey (KS) at the beginning, middle, and end of the semester (KS1, KS2, KS3, respectively) were compared (a). In all semesters, the scores from this self-perception survey increased as the course progressed. Out of 173 points possible, the median of the first survey fell between 90 and 100 points, between 120 and 140 points in the second, and between 150 and 155 points in the last. There were no significant differences between means obtained in each stage of the semesters compared to the same stage in Spring 2019 (the last semester), except for the mid survey (KS2) in Fall 2019, which showed a slightly larger mean (p-value = 0.004). Generally, the correlation between student performance and knowledge survey scores was positive but not statistically significant (b). The only significant correlation was seen in the third survey (KS3) in the first semester of the redesign, Fall 2017 (r = 0.28, p-value = 0.018). The correlation of the third survey (KS3) in the second semester of the redesign (Spring 2018) was the second-highest but was not statistically significant (r = 0.19, p-value = 0.062). The correlation values comparing performance and third KS perceptions for the third and fourth redesign semesters were much lower (Fall 2018, r = 0.05, p-value = 0.65; Spring 2019, r = 0.044, p-value = 0.7).
Figure 2. Knowledge survey analysis. (a) Boxplots of the knowledge survey scores at three stages for each semester: Knowledge Survey 1 – beginning (purple), Knowledge Survey 2 – middle (turquoise), and Knowledge Survey 3 – end (yellow). The black line represents the median; the box is the interquartile range (IQR), that is, from the 25th percentile (quartile 1, Q1) to the 75th percentile (quartile 3, Q3) of data. The upper whisker is the largest KS value in the sample contained within the third quartile (Q3) plus 150% of the IQR range; the lower whisker is the smallest of the KS value in the sample contained within the first quartile (Q1) minus 150% of the IQR range. The star indicates that the mean of a sample was statistically significantly different than the mean of the analogous survey in the last semester (Spring 19). (b) Pearson’s correlation of the performance of students as a function of knowledge survey’s scores at the three stages of each semester as in panel a (see legend on top left). The star indicates that the correlation was statistically significant. The correlation values for Knowledge Surveys 1 and 2 in Spring 18 were near zero (thin lines).
and display the results of the SUMMIT-P survey of attitudes toward mathematics. In order to organize the results, the questions were aggregated into three constructs: (a) math flexibility (), (b) thinking versus “plug and chug” (i.e., simply requiring rote memory and repetition) (), and (c) application and real-world value ().
Figure 3. Student attitudinal survey analysis for Spring 2019. (a) Questions related to math flexibility. (b) Questions related to thinking (positive) vs. “plug and chug” (negative). (c) Questions related to application and real-world value. The qualitative scale of the survey was 2 (strongly agree), 1 (agree), 0 (neutral), –1 (disagree), and –2 (strongly disagree). The number of each question is displayed in the x axis. Those questions with a negative sign were reversed in value because they were negatively coded.
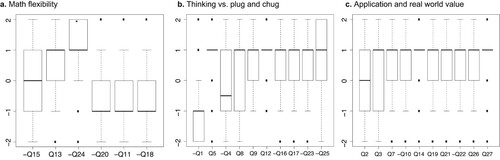
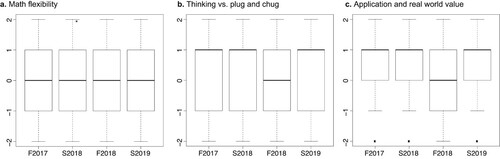
Figure 4. Attitudinal survey summary across semesters. Combined math flexibility questions (a), thinking vs. plug and chug questions (b), and application and real-world value questions (c). The qualitative scale reflects strongly agree (+2), agree (+1), neutral (0), disagree (–1), and strongly disagree (–2). The abbreviations on the x-axis correspond to Fall 2017 (F2017), Spring 2018 (S2018), Fall 2018 (F2018), and Spring 2019 (S2019). The elements of the box plot are the same as in and . The individual results for each question in the attitudinal survey are provided in Supplementary Figures 1, 2, and 3.
indicates that in the last iteration of the course redesign (Spring 2019), students had an overall positive response towards the attitudinal goals of the course. Within the construct of “Math Flexibility” (a), we see that 50 percent of student responses were placed on the neutral-agreed levels regarding the statement “In mathematics, you can be creative and discover things by yourself” (Q13), and 50 percent disagreed and strongly disagreed that “Math problems can be done correctly in only one way” (Q24). These two results aligned with the goals of the course. Fifty percent of the responses to the statement “Some people are good at math, and some just aren’t” (Q15) fell between disagree, neutral, and agree levels, while our expectation of the course was to obtain more responses on the disagree side. Fifty percent of the replies to the statements “In mathematics, something is either right or it is wrong” (Q20), “To solve math problems you need to know the right procedure, or you cannot do anything” (Q11), and “Good mathematics teachers show you the exact way to answer the math questions you’ll be tested on” fell on the range between neutral and agree levels with a larger fraction on the agreeing part. This response was the reverse of our expectation that students would recognize mathematics as a rigorous but flexible and creative discipline.
The majority of responses of students to 8 out of 10 statements related to thinking versus “plug and chug” aligned with the attitudinal goals of the course (b). The vast majority of students agreed that “My math class really required me to think about what I was doing rather than just plugging numbers into formulas” (Q5) and “The course has helped me understand the basic principles of the course”. Fifty percent of the responses to the statements, “I feel as though I have a secure foundation in the basics of this course” (Q9), and “This course required much more thinking than memorization” (Q17), were on the neutral and agree level and were skewed towards agree. Fifty percent of the responses to the statements, “Most of what I learned in this course was too difficult to grasp” (Q16), and “There was not enough time to fully grasp and understand all the important concepts” (Q23), fell on the neutral to disagree levels and were skewed towards disagree. Fifty percent of the responses to the statement, “Understanding the concepts held little or no value on the tests in this course” (Q25), fell within the neutral to strongly disagree levels with the median around the agree level. Fifteen percent of the responses to the statement, “When I learned this course, I think I really understood and did not just mimic techniques” (Q8), fell between the disagree and agree levels, but were heavily skewed towards agree. These were all positive outputs with respect to the expectations of the course as reflected in the scale of (b). Regarding the two negative outputs with respect to course expectations, the statement “During this course, I could do some of the problems, but I had no clue as to why I was doing them” (Q4) received 50 percent of the responses between disagree and agree but was skewed towards agree. Fifty percent of the responses to the statement, “The best way to do well in this course is to memorize all the formulas” were on the agree and strongly agree levels.
The majority of responses of students to 9 out of 10 statements related to application and real-world value of the course aligned with the attitudinal goals of the course (c). Almost all students agreed that “This course gave me thinking and problem-solving skills” (Q14) and “In this course, I was given the opportunity to apply the mathematics I learned to real world problems” (Q27). Fifty percent of the responses to the statements “I feel that I can apply what I’ve learned in this course to real world problems” (Q7), “This course helped me see how math is useful” (Q19), “What I learned in this course will be applicable to things I may have to do in the future” (Q21), and “In the long run, I think taking this course will help me” (Q26) fell within the neutral and agree levels, and were skewed towards agree. Fifty percent of the responses to the statements “I see no practical use for what I’ve learned in this course” (Q10) and “This course was too abstract, not practical enough” (Q22) fell within the levels neutral and disagree, and were skewed towards disagree. Fifty percent of the responses to the statement “I believe that what I’ve learned in this course will be useful to me after college” (Q3) fell within the levels disagree and agree, but were heavily skewed towards agree. These were all responses that aligned positively with the expectations of the course. The only case that was not that positive were the responses to the statement “I’ve applied what I’ve learned in this course to my work in non-mathematics courses” (Q2), which fell in the disagree to agree level with a median around neutral.
Overall the attitude of students in the first three semesters were similar to the results of the last iteration of the course (Spring 2019), except for the third iteration (Fall 2018; ). When combining the cluster of “Math flexibility” statements, 50 percent of the responses fell on the −1 to +1 levels with a median around neutral (a). When combining the cluster of “Thinking vs. plug and chug” statements, 50 percent of the responses fell on the −1 to +1 levels, but were skewed towards the positive side, with the median located at +1 (b). The outlier was Fall 2018, which displayed a median located around the 0 level. When combining the cluster of “Application and real-world value” statements, 50 percent of the responses fell on the 0 to +1 levels, but were skewed towards the positive side, with the median located at the +1 level (c). The outlier was again Fall 2018; 50 percent of the responses fell on the −1 to +1 levels with a median located around the 0 level.
4 DISCUSSION
The redesign appealed to students. The average enrollment doubled with respect to the four semesters prior to the redesign. The enrollment in the redesigned courses was in the range of 80–100 students. Our initial expectation, however, was that the enrollment would increase steadily towards the 100–200 student range, based on information that we had prior to the 8 semesters reported here. Since many factors influence enrollment in all courses, we hope to determine whether anything related to the course design is limiting the increase in enrollment. The non-passing grade rate in the redesigned course was on the 10–20% range, which is much lower than the non-passing grade prior to the redesign (48 ± 15%), and the student attitudinal response indicated a positive perception of the course, in particular regarding application and real-world value. The initial increase in enrollment, however, was achieved without students having any reference on the modifications to the redesigned course. Thus it appears that the increase in passing-grade rates and positive student attitudinal responses has not translated into higher enrollment, suggesting other possible influences that we hope to identify. One explanation could be that students that had a negative perception of the course might have been discouraging other students from enrolling. One way to assess and address this would be to include a question in the attitudinal survey to know whether students had received negative comments from other students about the course prior to enrollment. Another possible route to increase the enrollment would be to coordinate with undergraduate advisors in life sciences majors, so they can share the positive results obtained in the course. Alternatively, it could be that the stagnant enrollment was due to a structural issue in life science majors, for example, due to a possible increase of transfer students with credits equivalent to Calculus for the Life Sciences from other Universities or Community Colleges.
Our expectation was that by adopting a curriculum that aligned with CRAFTY recommendations, we would increase the student perception of mathematics as a rigorous but creative, flexible, conceptual, and valuable discipline for their sciences. Overall, the student attitude survey results reflect that we are going in the right direction. Their perception of math being a flexible discipline was not as well supported as we would like, but the median responses were on the neutral level. Due to the preconception of most students that math is a procedural and algorithmic discipline, we consider that having a neutral median is a good start. The student attitude towards thinking versus “plug and chug” was more positive, and the recognition of applications and real value of the course received the most positive responses. In order to keep improving on these three aspects, we are currently designing an overarching problem based on real data that students could engage from the beginning of the course. This would be a challenging problem that would complement the current M&M lab experiment-data activity and provide an additional opportunity to bridge procedural, conceptual, and interpretative practices in the use of mathematics.
Our initial goal with the Knowledge Survey was to have a tool that could help assess the alignment between student performance, student skill perception, and instructor perception of teaching. Unfortunately, the student skill perception scores did not display a statistically significant correlation with student performance, except for the first semester of the redesign. In fact, the scores for the Knowledge Survey were consistent over the four semesters, irrespective of the changes included in the course. Out of a maximum score of 173, students’ self-assessments had a median score in the 90–100 range at the beginning of the course, in the 120–140 range mid-semester, and in the 150–155 range at the end of the semester. This indicated that students perceived that they acquired or increased their skills on topics related to the course. But the lack of correlation between these scores and student performance indicated a gap between the actual student skill set and their mastery perception. This could be due to several factors. First, the survey might be too long, and asking students to respond to 173 questions three times during the semester might introduce test fatigue and imprecise evaluation of their perceptions. Second, the survey should include questions to assess the reliability of student responses. Third, the assessment of skills by the activities of the course might be too limited compared to the sampling space of the survey. Fourth, the transition from contract grading towards a more traditional grading might also have reduced the students’ ability to distinguish the value of related questions in the Knowledge Survey that belong to different Bloom’s Taxonomy levels. Fifth, as new learners, students might have perceived their skills inaccurately regarding related tasks that were associated with different actionable verbs (Bloom’s Taxonomy). For example, calculating the vertex of specific parabolas (Knowledge Survey Item 62) might have been confused with deriving a general mathematical expression to obtain the position of the vertex of any parabola (Knowledge Survey Item 63). Such a level of detail probably increased the noise in the response from students. These five aspects will be taken into consideration in future iterations of the redesign to improve the Knowledge Survey towards our goals.
Our efforts to provide a high-quality course aligned with the CRAFTY prescriptions, as well as the needs of our own campus, is an ongoing effort. Our goal is to keep working with our colleagues in the SUMMIT-P faculty learning community to improve and learn from other initiatives in calculus for the life sciences. In particular, in future iterations, we aim to incorporate activities directly related to the application of mathematics to solve problems addressed in courses taken by life science majors such as biostatistics, chemistry, ecology, molecular biology, and genetics. We are currently screening these courses to identify the mathematics concepts that are applied in those courses, incorporate them as practice problems in our Calculus for the Life Sciences curriculum, and share with students the science courses that use the specific problems. We are also planning to develop online materials that could help instructors in those courses revisit the same activities to align better with Calculus for the Life Sciences.
Finally, an essential aspect that we hope to pursue is confirming that statistical reasoning favors the learning of calculus concepts by life science students. Our activities were designed with learning outcomes in mind. Based on the performance of students in exams, homework, and lab activities, our assessment is that, on average, students demonstrated a good understanding and application of basic data analysis and calculus concepts. We recognize that the quantitative measurement of learning gains will require careful design in subsequent studies. In our cohort, some students had previously taken calculus courses, for example, advanced placement, while others had only taken algebra and precalculus courses, limiting carefully controlled analyses of this relationship as a post-hoc comparison. Some students had been exposed to statistics in other courses, such as biostatistics and laboratories, while others had no experience in data analysis or spreadsheets. Therefore, it will be necessary to develop a pre- and post-course test that will allow us to evaluate these nuances. Based on the positive attitude of students and performance observed in our study, we speculate that there is a reinforcement between statistical reasoning and calculus for life science students, but careful research will be necessary to confirm this claim.
5. CONCLUSION
Two redesign principles guided our effort: first, motivating mathematics with examples and contexts that students can relate to, and, second, infusing data analysis and statistical reasoning to motivate the need for calculus for biology majors. Our compromise was to start with descriptive statistics so students could generate functions from data, motivate optimization problems (least-squares fit), and interpret later fitted data with mathematical models generated from differential equations. This course redesign using the CRAFTY recommendations led to an increase in enrollment and a positive response towards the application and real value of Calculus for Life Sciences. In particular, our efforts to emphasize statistical ideas in the first third of the course has supported students’ understanding of data analysis techniques. Our emphasis on integrating biology and social examples that are familiar and compelling contributed to students’ perception of the value of mathematics. Finally, our efforts to leverage Google’s statistical tools and group editing properties enabled lab groups to experience ways to use technology effectively. The Knowledge Survey results did not correlate with student performance, but it was still a helpful tool for two reasons. First, it enabled the instructor to communicate the intent of the Student Learning Outcomes in detail. Second, the fact that the outcomes were consistent across semesters indicated that overall, students perceived that they were learning valuable mathematics instead of just viewing the course as a hurdle to overcome. In future iterations, we expect to reduce the number of questions in the Knowledge Survey to develop it into a useful metric for course alignment. We are also considering the idea of incorporating a semester-long modeling project that involves real data. The specific goal for this project would be to find data that resonates with students’ interests. We are also working towards incorporating mathematical problems from partner disciplines’ courses to improve the alignment and the ability of students in applying mathematical concepts across disciplines, and student attitudes towards the mathematics that underlie biological concepts. It is hoped that the efforts described here provide guidance on how to approach course redesigns that align with the CRAFTY recommendations as well as those interested in the applications of self-assessment and evaluation tools like the Knowledge Survey and Attitudinal Student Surveys.
Supplemental Material
Download Zip (9.2 MB)ACKNOWLEDGEMENTS
The opinions expressed here are those solely of the authors and do not reflect the opinions of the funding agency. Financial support via the California State University (CSU) Course Redesign with Technology award to AL is gratefully acknowledged. We are grateful for thoughtful discussions and suggestions from STEM faculty across several participating campuses.
DISCLOSURE STATEMENT
No potential conflict of interest was reported by the author(s).
Additional information
Funding
Notes on contributors
Antoni Luque
Antoni Luque is a theoretical biophysicist investigating the architecture and ecology of viruses. He has taught courses in mathematics for STEM disciplines, where he has incorporated various pedagogical techniques such as learning glass online lectures, flipped classroom, and team-based learning.
James Mullinix
James Mullinix is a Ph.D. student in the Computational Science program at San Diego State University, where he is developing new computational method to investigate the geometry of biological structures. James Mullinix has a long experience as a teaching assistant in calculus courses and was trained to implement active learning approaches in his sessions. He was involved in the redesign and instruction of the lab in Calculus for the Lab Sciences.
Matt Anderson
Matt Anderson’s research centers on the physics of ultrashort pulsed laser light. His current interests center on the generation, modulation, and measurement of femtosecond vortex beams. He also studies physics education research, with an emphasis on pedagogical applications of his invention, the Learning Glass Lightboard technology.
Kathy S. Williams
Kathy S. Williams has taught courses dealing with introductory biology, coevolution, insect ecology, and general ecology for over 30 years at San Diego State University. She began doing STEM education research over 20 years ago, and her research now focuses on improving student success through effective curriculum design, developing and using conceptual assessments for learning, and studying science faculty with education specialties (SFES).
Janet Bowers
Janet Bowers researches the ways in which students' development of mathematical understandings can be supported through advanced technologies. She is currently the director of the Math and Statistics Learning Center at San Diego State University.
Related Research Data
References
- Bodine, E. N., S. Lenhart, and L. J. Gross. 2014. Mathematics for the Life Sciences. Princeton, NJ: Princeton University Press.
- Bowers, N., M. Brandon, and C. Hill. 2005. The use of a knowledge survey as an indicator of student learning in an introductory biology course. Cell Biology Education. 4: 311–322.
- Bowers, J., K. Williams, A. Luque, D. Quick, M. Beisiegel, J. Sorensen, J. Kunz, D. Smith and L. Kayes. 2020. Paradigms for creating activities that integrate mathematics and science topics. Journal of Mathematics and Science: Collaborative Explorations. 16: Article 6. https://doi.org/https://doi.org/10.25891/14f6-by82.
- Dalgaard, P. 2008. Introductory Statistics with R. New York, NY: Springer Science & Business Media.
- Dilts, J., and A. Salem. 2004. Biology Report, Pages 15–17 in The Curriculum Foundations Project, William Barker, and Susan Ganter, Editors. Washington, DC: Mathematical Association of America. www.maa.org/cupm/crafty/cf_project.html.
- Eaton, C. D., and H. C. Highlander. 2017. The case for biocalculus: Design, retention, and student performance. CBE—Life Sciences Education. 16: 1–11.
- Eaton, C. D., H. C. Highlander, K. D. Dahlquist, G. Ledder, M. D. LaMar, and R. C. Schugart. 2019. A “rule-of-five” framework for models and modeling to unify mathematicians and biologists and improve student learning. PRIMUS. 29: 799–829.
- Ganter, S. L., and W. Barker. 2004. Curriculum Foundations Project: Voices of the Partner Disciplines. MAA Reports. Washington, DC: Mathematical Association of America.
- Mahaffy, J., and A. Chavez-Ross. 2009. Calculus: A Modeling Approach for the Life Sciences (Volumes 1 and 2). London, UK: Pearson Custom Publishing.
- Nandi, B., and A. Chakravarti. 2013. An introduction to mathematical modeling. Jeevanu Times. 13: 16–18.
- Nilson, L. 2015. Specifications grading: restoring rigor, motivating students, and saving faculty time. https://ebookcentral.proquest.com https://www.insidehighered.com/views/2016/01/19/new-ways-grade-more-effectively-essay.
- NRC (National Research Council). 2003. BIO2010: Transforming Undergraduate Education for Future Research Biologists. Washington, DC: The National Academies Press.
- NRC (National Research Council). 2007. Rising Above the Gathering Storm: Energizing and Employing America for a Brighter Economic Future. Washington, DC: The National Academic Press.
- NRC (National Research Council). 2012. Discipline-based Education Research: Understanding and Improving Learning in Undergraduate Science and Engineering. Washington, DC: The National Academic Press.
- Nuhfer, E., and D. Kipp. 2001. The knowledge survey: A tool for all reasons. To Improve the Academy. 21: 59–78.
- PCAST (President’s Council of Advisors on Science and Technology). 2012. Engage to Excel: Producing one Million Additional College Graduates with Degrees is Science, Technology, Engineering, and Mathematics. Report to the President. Washington, DC: Executive Office of the President of the United States, The White House.
- Rice, J. A. 2013. Mathematical Statistics and Data Analysis. 3rd Edition. Belmont, CA: Cengage Learning.
- Saxe, K., and L. Braddy. 2015. A Common Vision for Undergraduate Mathematical Sciences Programs in 2025. Washington, DC: Mathematics Association of America.
- SIAM (Society for Industrial and Applied Mathematics). 2014. Modeling Across the Curriculum II. Philadelphia, PA: SIAM.
- Wirth, K., and D. Perkins. 2005. Knowledge Surveys: The ultimate course design and assessment tool for faculty and students. Proceedings: Innovations in the Scholarship of Teaching and Learning Conference, St. Olaf College/Carleton College, April 1-3, 2005, 19p. ‘https://www.macalester.edu/geology/facultystaff/karlwirth/’.