
 ?Mathematical formulae have been encoded as MathML and are displayed in this HTML version using MathJax in order to improve their display. Uncheck the box to turn MathJax off. This feature requires Javascript. Click on a formula to zoom.
Abstract
Inverse and injective functions are topics in most college algebra courses. Yet, current materials and course structures may not afford students’ conceptual understanding of these important ideas. We describe how students’ work with digital activities, “techtivities,” linking two different looking graphs that represent relationships between variables in the same dynamic situation, can help to address this problem. To bolster our argument, we provide empirical data from a broader study, drawing on student work and instructor interviews across three institutions. We conclude with illustrations of how techtivities can serve as instructional anchors for injective and inverse functions.
1. INTRODUCTION
Functions play a central role in college algebra. Understanding functions is important not only for students’ mathematical progress; it can inform how people interpret information presented in graphs in the media in their role as educated citizens. However, too often students in college algebra encounter textbooks that present topics, such as functions, in terms of techniques and procedures [Citation4], rather than relationships between variables. This difficulty is not limited to college algebra students. Even advanced university mathematics students have demonstrated limited meanings for inverse [Citation7] and injective (one-to-one) [Citation1] functions. One way to address this challenge is to promote students’ reasoning in undergraduate mathematics courses such as college algebra [Citation5].
We discuss how students’ work with digital activities or “techtivities,” linking two different looking graphs to the same dynamic situation, can serve as anchors for instruction [Citation8] around inverse and injective functions. We begin by providing some background around inverse and injective functions. Next, we describe design principles of the techtivities, illustrating with an example. To bolster our argument, we provide empirical data from student work and instructor interviews. We conclude with illustrations of how techtivities serve as instructional anchors for injective and inverse functions.
2. BACKGROUND: INVERSE AND INJECTIVE FUNCTIONS
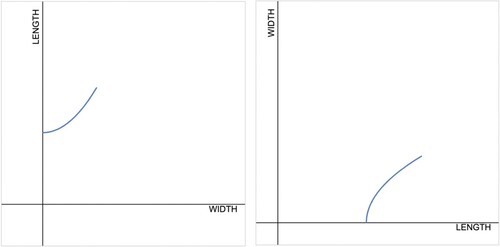
Inverse and injective functions are two types of functions that students encounter in college algebra. Textbook presentations can group these two topics, starting with the definition for injective functions [Citation9]. Injective functions map distinct elements from the domain of a given function to distinct elements in its codomain. Figure shows two different graphs, representing a relationship between length and width, for a situation involving a dynamic kite that is growing and shrinking in size. Both graphs represent injective functions because each value of width maps to a distinct value of length and vice versa. A given function has an inverse function if and only if it is injective. A function and its inverse have a specialized relationship between their respective domains and ranges. The range of the given function is the domain of its inverse, and the range of the inverse function is the domain of the given function. This relationship is illustrated in Figure .
Figure 1. Two graphs representing injective and inverse functions.
Sullivan III [Citation9] starts with the definition of injective functions and then introduces the horizontal line test as an additional tool for identifying injective functions from a Cartesian graph as follows: “If every horizontal line intersects the graph of a function in at most one point, then
is one-to-one” (p. 434). We identify two shortcomings that can emerge if the horizontal line test is central to students’ understanding of injective functions. First, while students may be able to determine whether a function is injective via the horizontal line test, they can have difficulty explaining why a function is injective [Citation1]. Second, mathematical assumptions underlying the horizontal line test can be ambiguous in standard textbook presentations. The horizontal line test applies for univariate functions, given by
, and graphed in a Cartesian plane with
and
representing the horizontal and vertical axes, respectively. Hence, while the horizontal line test may be efficient under certain circumstances, students relying solely on this test may miss the specialized relationships between variables that are central to injective functions.
Sullivan III’s [Citation9] presentation for graphing inverse functions begins with the graph of an injective function and proceeds to graph the inverse function
on the same coordinate axes by reflecting
about the line
. To illustrate, Figure shows a graph of
along with a graph of its inverse function
. While this graphical display is clever, it can mask the meaning of variables, particularly if a function is presented in terms of a contextual situation, such as conversion between different units of currency [Citation10].
Figure 2. Inverse function relationship.
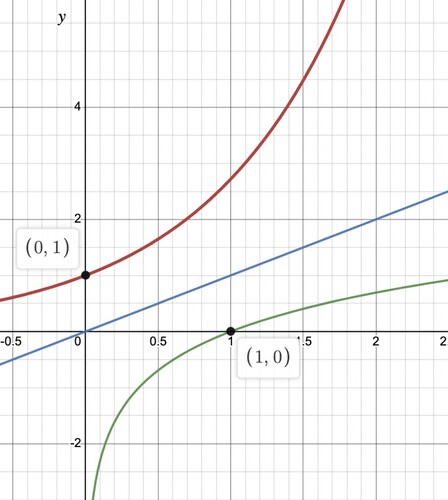
It is key for students to understand that a function and its inverse represent an invariant relationship between variables, which entails covariational reasoning [Citation6,Citation7]. For example, the graphs shown in Figure represent an invariant relationship between the variables of length and width. If both graphs in Figure were to be sketched on the same coordinate axes, such as in Figure , the invariant relationship between length and width may be less explicit. For example, the point on the y-axis for the graph at left in Figure represents a width of zero and a non-zero length. If this graph was to be sketched on the same axes as the graph at right in Figure , that point will instead represent a length of zero and a non-zero width. When studying inverse functions, it is preferable for students to sketch graphs of functions and their inverses on different sets of axes (i.e., Figure ), so that the graphs can represent the relationships between variables in a more meaningful manner [Citation10].
3. TECHTIVITIES: DYNAMIC SITUATIONS IN DIGITAL ACTIVITIES
Anchoring mathematical topics with contextual situations can help students to transition from concrete to abstract reasoning [Citation8]. This is more than just a “hook” to pique students’ interest; students can refer back to the situation when abstraction increases [Citation8]. We describe how digital activities, such as the techtivities, can serve as an anchor around instruction for inverse and injective functions.
“Techtivity” is a portmanteau that Olson coined, to blend the notions of technology and activity. The techtivities are a set of Desmos classroom activities [Citation2] designed to adhere to each of the following principles: privilege students’ thinking and reasoning, provide students with feedback and a place to reflect, foreground exploration and background accuracy, incorporate variation among a background of invariance, and to broaden and challenge what counts in mathematics [Citation3].
The techtivities can be used interchangeably in a course. Instructors can use the entire set of activities or choose a smaller subset to highlight specific content and learning objectives. In each, students sketch and interpret different-looking graphs that represent the same relationship between variables (see Figure ). This exploration can engender students’ covariational reasoning, which is key for their understanding of functions [Citation11].
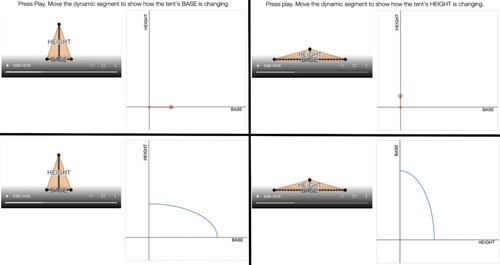
Each techtivity starts with an animation of a playful scenario, along with text identifying specific attributes in the situation. Scenarios include a circus performer being shot out of a cannon, a cart traveling around a ferris wheel, a toy car traveling near a stationary object, and a dynamic tent that raises and lowers. The Dynamic Tent techtivity starts with an animation of a tent that raises and lowers as its height and base length vary (Figure ). At first, the height increases as the base length decreases. After the tent reaches a maximum height value, the height decreases while the base length increases.
Figure 3. Screen captures of the dynamic tent animation.
Each techtivity follows a similar sequence. First, students explore changes in individual attributes by dragging sliders along the axes of a Cartesian plane (see Figure , upper left and right). After this, students sketch a graph to represent a relationship between those attributes (see Figure , lower left). Then students encounter a new Cartesian plane, with the attributes represented on different axes, and the process repeats (see Figure , lower right). After each part, students receive computer feedback, in the form of an animation of the sliders or a dynamic graph sketch. Reflection questions follow each graph sketch.
Figure 4. Dynamic tent activity progression.
Reflection prompts invite students to investigate relationships between the height and base of the dynamic tent. The first comes after the initial graph sketch (Figure , lower left) and asks “Are there any different lengths for the base when the tent will be the same height? Why or why not?”. By asking if there are multiple bases that could have the same height, we aim to address relationships between variables inherent in injective functions. The second comes after the last graph sketch (Figure , lower right), and asks: “Did you expect the graph to look like this? Why or Why not?” With this question, we invite students’ reactions to a new graph that represents the same relationship between the tent’s height and base. The third is a variation on the first reflection question and aims to address the opposite direction of the relationship of the variables inherent in the injective function. This time, students are to respond to a hypothetical student, Dee, who wonders about the relationships between the tent’s height and base. Students are asked: “Dee wonders if different heights of this tent could have the same length for the base. How would you respond to Dee?” In each reflection, students can respond using informal language, which they then may connect to more formal mathematical ideas (see Table ).
Table 1. Inverse function terminology and associated dynamic tent references.
4. RESPONSES TO THE DYNAMIC TENT TECHTIVITY
In this section, we first present data from students’ work on the Dynamic Tent techtivity, from two small sections of college algebra (n = 26), co-taught by Olson and Robinson. Second, we examine student responses to the second reflection question: “Did you expect the graph to look like this?” To situate this smaller sample (n = 26), we also look at responses from a broader population of college algebra students (n = 524), across three institutions. Third, we discuss spontaneous instructor comments related to the viability of the techtivities for anchoring instruction around inverse and injective functions.
4.1. Student Graph Overlays for the Dynamic Tent
Olson and Robinson co-facilitated the techtivities at three different times in each semester, with the Dynamic Tent occurring in the third implementation. Each semester, students worked on the Dynamic Tent the same week when the topics of inverse and injective functions were introduced. Before students worked on the Dynamic Tent, Olson and Robinson introduced the definitions for injective and inverse functions, referencing other techtivities students had encountered earlier in the course [Citation5]. In the next class session, students worked on the Dynamic Tent, followed by additional instruction and practice centered around inverse functions.
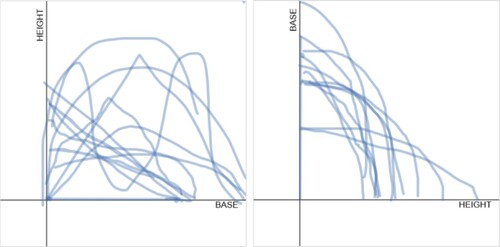
The overlays in Figure show both student-generated graphs representing a relationship between the height and base of the Dynamic Tent, for students in a single section (n = 12). The first graphs students sketched (Figure , left) contain substantial variability both amongst individual graphs and with respect to the computer-generated graph (Figure , lower left). The second graph represented the same relationship between height and base but with the axes switched. Students’ second graphs (Figure , right) displayed less variability and greater accuracy with respect to the computer-generated solution (Figure , lower right). The graphs from these 12 students were representative of the set of students across both semesters (n = 26). Notably, students could engage in sketching these relationships even though they had yet to realize the first and second graphs represented inverse functions.
Figure 5. Dynamic tent graph overlays.
4.2. Student Responses: Did You Expect the Graph to Look Like This?
Reflecting on students’ work, we noted some emerging themes in students’ responses to the second reflection question: “Did you expect the graph to look like this?” We selected this question because we wanted to learn more about students’ rationales for sketching the second graphs. In the smaller sample, 24 of the 26 students chose “yes” when asked if they expected the graph to look like what they had drawn. Ten students included either height or base (or both) in their responses. Furthermore, four of those students’ responses provided clear evidence of covariational reasoning (e.g., “As the base decreases, the height always increases”). Eight students used specific mathematical terminology (e.g., inverse, one-to-one), making connections to course content. Seventeen students described transformations between the first graph and the second (e.g., the axes are switched). Students’ responses suggested they were working to make sense of the situation in terms of graph attributes (height, base) and relationships between those attributes.
Emerging themes from the smaller sample were reflective of themes that we noted in the broader data set. Overall, 458 of the 524 respondents chose “yes” when asked if they expected the graph to look like what they had drawn. Of those 524 respondents, 33.4% included either height or base (or both) in their responses. Furthermore, 21% provided clear evidence of covariational reasoning in their responses. Additionally, 11.5% used specific mathematical terminology (e.g., inverse, one-to-one), to make connections to course content, and 49.8% described transformations between the first graph and the second. As was the case for the smaller group, the broader set of responses suggested students were working to make sense of the situation in terms of graph attributes (height, base) and relationships between those attributes.
Attending to attributes in a situation contributes to students’ notions of an invariant relationship between variables represented by inverse functions [Citation6]. Instructors may highlight student responses demonstrating covariational reasoning to address how the relationship between the height and base remains the same, despite the different-looking graphs. Furthermore, students’ spontaneous noting of the variables “switching” positions on the axes may begin to anchor some of the symbolic work with inverse functions. When finding an inverse from a given function, instructors often tell students to “switch” the variables, then solve. Students work with the Dynamic Tent techtivity can help them to ground such directions in an activity that is sensible to them.
4.3. Instructor Reflection: Inverse Function and the Dynamic Tent
Across the three institutions, college algebra instructors reported the value of the techtivities for their instruction related to inverse function. Johnson conducted individual interviews with instructors (n = 20), to learn their perceptions of the benefits and challenges of using the techtivities in their instruction. Although Johnson did not ask specific questions about inverse functions, seven instructors spontaneously described how the techtivities influenced or could relate to this topic.
Below is a sample response that one instructor provided when Johnson asked: “How have the techtivities impacted your college algebra instruction this semester?”
We (sic), it was kind of interesting this time we did the tent and then I said ok I want you to do this kite techtivity and I want you to think about inverse functions. How it relates to inverse functions. So I kind of like that I did it in-between them. Used those words. Because we had just covered inverse functions but their homework wasn’t due yet. So they were right in that zone where they didn’t really get it because you don’t really get it until you get the homework, right? But they had been introduced to it. So that was a really good part of my instruction that wouldn’t have happened without the techtivities. Then they could use that context of the techtivity for the inverse function thing and I think that was a really good learning tool.
5. CONNECTIONS TO PRACTICE
To anchor ideas inherent in the definition for injective functions, instructors could ask students to reflect on whether the two different graphs from the Dynamic Tent (Figure , lower left and lower right) represent functions. Looking at the first graph (Figure , lower left) an instructor could ask: “Does this relationship represent a function such that height is a function of the base?” Then looking at the second graph (Figure , lower right) an instructor could ask: “Does this represent a function relationship such that base is a function of the height?” Students responding to these questions could reflect on potential directions of a function relationship between the attributes and confirm that both graphs represent functions. Then instructors could introduce the terminology of injective functions to describe relationships with this property. This could allow students to ground the notion of injective functions in something they experienced and help students make meaning of the horizontal line test, beyond just a procedure to execute when encountering a graph.
Instructors also can anchor the terminology and symbolic notation for inverse functions with the Dynamic Tent. Below is a standard definition for inverse functions provided by Sullivan III [Citation9] (p. 435).
Suppose is a one-to-one function. The correspondence from the range of
to the domain of
is called the inverse function of
. The symbol
is used to denote the inverse function of
. In other words, if
is a one-to-one function, then
has an inverse function
and
.
A typical symbolic procedure students encounter is to find the equation of an inverse function. Instructors also can use elements from the techtivities to anchor important steps in this process. Given an injective function, students are to “swap” the variables in the equation (i.e., interchange all of the
variables with
variables and interchange all of the
variables with
variables) then solve the resulting equation for
, which represents the inverse. To anchor the variable “swap,” instructors can direct students’ attention to the “swapping” of variables that happened in the graphs for the Dynamic Tent (Figure , lower left and lower right). Graphing the function and its inverse on two separate coordinate grids (as in Figure ) can further illustrate why the
variables become
variables for the inverse and vice versa.
6. DISCUSSION/IMPLICATIONS
The notion of function is central to college algebra, and students can struggle to make meaning of inverse [Citation10] and/or injective functions [Citation1]. If instructors introduce function concepts only by presenting definitions with abstract terminology and formal symbolic notation, they may perpetuate students’ struggles. Connecting abstract ideas to concrete activities, such as the techtivities, can help to anchor new concepts and definitions to familiar situations.
Covariational reasoning is the key for students’ function learning [Citation11], and it is important for students to have explicit opportunities to engage in such reasoning in college algebra. Notably, engaging in covariational reasoning can engender students’ development of productive meanings for inverse functions [Citation6]. Even though the second reflection question on the Dynamic Tent does not ask students directly about the base and height, we see students appealing to relationships between these variables to explain why the graph (Figure , lower right) looks the way it does. By centering relationships between variables, instructors can foster students’ mathematization of playful situations, such as the Dynamic Tent, which can contribute to students’ understanding of the invariance inherent in inverse functions [Citation6].
Our work with the Dynamic Tent has influenced the way we think about teaching inverse functions. Exploring both possible directions of a relationship between variables (i.e., Is base a function of height? Is height a function of base?) can help students to ground the new concept of inverse function within their pre-existing knowledge of functions. Such opportunities can foster students’ conceptualization of specialized relationships between variables represented by functions and their inverses. This extends beyond just introducing new symbolic rules or algorithmic processes and has potential to make those processes more meaningful for students.
Mathematics classrooms can be placed where students play and explore, even in undergraduate settings. Interacting with the techtivities can help students do just that, for a purpose of growing their understanding of functions, as well as to create space for mathematics to be something other than a quest to find answers [Citation5]. Making room for activities such as the techtivities requires an investment in time and academic currency. The investment can pay off with improved instruction and learning around topics that have proven difficult, such as inverse and injective functions.
ACKNOWLEDGMENT
Research was supported in part by U.S. National Science Foundation Improving Undergraduate STEM Education Award #2013186 “Promoting Mathematical Reasoning and Transforming Instruction in College Algebra.”
DISCLOSURE STATEMENT
No potential conflict of interest was reported by the author(s).
Additional information
Funding
Notes on contributors
Gary A. Olson
Gary A. Olson serves as Director of General Education Mathematics at the University of Colorado Denver. He has over 15 years of experience teaching undergraduate courses and provides teacher training for graduate teaching assistants and professional development for faculty interested in incorporating active learning techniques into the classroom. He advocates for the use of both tactivities and techtivities in the classroom to promote reasoning and connections throughout the undergraduate curriculum.
Heather Lynn Johnson
Heather Lynn Johnson is Professor of Mathematics Education at the University of Colorado Denver. She designs interactive, online tasks to provide students opportunities to expand their mathematical reasoning, and she teaches teachers to grow their students’ mathematical reasoning. Johnson shares her research and reflections on Twitter @HthrLynnJ and on the website HthrLynnJ.com.
Rebecca Robinson
Rebecca Robinson is a doctoral student and graduate teaching assistant at the University of Colorado Denver in the Department of Mathematical and Statistical Sciences. Her research is in graph theory and she is passionate about both teaching and encouraging and advocating for women in STEM.
Robert Knurek
Robert Knurek is a doctoral student and graduate research assistant at the University of Colorado Denver. He is currently interested in researching students’ mathematical reasoning during graphing tasks.
Kristin A. Whitmore
Kristin A. Whitmore is a doctoral student in mathematics education, graduate research assistant, and part-time graduate instructor at the University of Colorado Denver. She is intrigued by instructor pedagogy that provides meaningful opportunities for student reasoning.
REFERENCES
- Bansilal, S., D. Brijlall, and M. Trigueros. 2017. An APOS study on pre-service teachers’ understanding of injections and surjections. The Journal of Mathematical Behavior. 48: 22–37. doi:10.1016/j.jmathb.2017.08.002.
- Desmos (n.d.) See How Graphs Work. https://teacher.desmos.com/collection/614cb66216afe74d1ebae02d.
- Johnson, H. L., G. Olson, B. Tsinnajinnie, and L. Bechtold. 2022. Boundary transitions within, across and beyond a set of digital resources: Brokering in college algebra. Digital Experiences in Mathematics Education. 9: 209–231. doi:10.1007/s40751-022-00113-2.
- Mesa, V., H. Suh, T. Blake, and T. Whittemore. 2012. Examples in college algebra textbooks: Opportunities for students’ learning. PRIMUS. 23(1): 76–105. doi:10.1080/10511970.2012.667515.
- Olson, G. A., and H. L. Johnson. 2022. Promote students’ function reasoning with techtivities. PRIMUS. 32(5): 610–620. doi:10.1080/10511970.2021.1872751.
- Paoletti, T. 2020. Reasoning about relationships between quantities to reorganize inverse function meanings: the case of Arya. The Journal of Mathematical Behavior. 57: 100741. doi:10.1016/j.jmathb.2019.100741.
- Paoletti, T., I. E. Stevens, N. L. F. Hobson, K. C. Moore, and K. R. LaForest. 2018. Inverse function: Pre-service teachers’ techniques and meanings. Educational Studies in Mathematics. 97(1): 93–109. doi:10.1007/s10649-017-9787-y.
- Stephan, M. L., L. T. Reinke, and J. K. Cline. 2020. Beyond hooks: Real-world contexts as anchors for instruction. Mathematics Teacher: Learning and Teaching PK-12. 113(10): 821–827. https://pubs.nctm.org/view/journals/mtlt/113/10/article-p821.xml.
- Sullivan III, M. 2020. Algebra & Trigonometry Enhanced with Graphing Utilities, Eighth Edition. Hoboken, NJ: Pearson Education, Inc.
- Teuscher, Palsky, and Palfreyman. 2018. Inverse functions: Why switch the variable? The Mathematics Teacher. https://pubs.nctm.org/downloadpdf/journals/mt/111/5/article-p374.pdf.
- Thompson, P. W., and M. P. Carlson. 2017. Variation, covariation, and functions: Foundational ways of thinking mathematically. In J. Cai (Ed.), Compendium for Research in Mathematics Education, pp. 421–456. Reston, VA: National Council of Teachers of Mathematics.