
Abstract
Flooding is the most frequent and costliest natural disaster in the United States, yet most households are uninsured or underinsured against flood and may incorrectly expect that government agencies provide sufficient post-flood assistance. This paper synthesizes existing research on flood risks, flood insurance, and their impacts on the U.S. housing market. We focus on the single-family market segment, as primary residences tend to be the largest category of wealth for most households. We conclude with policy implications and suggestions for future research.
Flooding is the most frequent and costliest natural disaster in the United States. Scientists predict even more serious flood losses in the future due to the combined forces of increased development in areas subject to flooding coupled with climate changes, including changing storm and precipitation patterns and sea level rise. According to some estimates, coastal flooding, exacerbated by sea level rise, may inundate 2% of U.S. homes by 2100 and contribute to neighborhood-wide effects, such as impassable roads, that will impact far more residences (Bretz, Citation2017). These changes could adversely affect housing markets in many locations over the coming decades.
Currently, most homeowners are uninsured against flood damage. Federally backed or regulated lenders require flood insurance on loans collateralized with property in the 100-year floodplain, mapped and designated as Special Flood Hazard Areas (SFHAs) by the Federal Emergency Management Agency (FEMA). However, many homeowners in the SFHA, such as those who own their home free and clear, are not subject to this requirement. Moreover, property damage from floods can, and often does, occur outside the SFHA from more extreme events, unmapped storm water flood risks, or because maps are outdated. The lack of widespread take-up of flood insurance among those at risk not only imposes financial strain on households suffering losses, but could have spillover effects in communities by slowing the rebuilding and repair of damaged homes and businesses. In addition, losses on uninsured property and costs of assistance to the uninsured may be passed on to lenders, servicers, and to taxpayers. As flooding increases and flooded areas continue to expand, community-wide effects are likely to be exacerbated.
This paper first describes the nature of flood risk in the United States and how flood risk is modeled. We then turn to a discussion of how flood insurance is currently provided and how take-up rates could be expanded. This is followed by a discussion of cognitive biases that influence decisions on flood risk insurance purchase. Following these sections, we discuss the impacts of flood risk on mortgage and housing markets, including housing prices. The paper concludes with a summary of the key findings, policy options, and a roadmap for future research.
Flood Risk in the United States
Flood Risk and its Evolution
There are three primary types of flooding in the United States. One is coastal flooding from tides or storm surge caused by winds from tropical storms and hurricanes pushing water inland. Second is fluvial, or riverine flooding that occurs when a river or stream overflows its banks. This type of flooding can be a gradual process, as in overbank flooding, or could occur rapidly, known as flash flooding. Riverine or coastal flooding can also occur when flood defenses, such as levees or floodwalls, fail. Third, pluvial, or surface water flooding, also referred to as storm water or rainfall flooding, occurs when heavy precipitation overwhelms local drainage and is exacerbated by the prevalence of impervious surfaces. Pluvial flooding can occur away from rivers and streams where there is a topographical depression, or bathtub effect, causing runoff to pool in an area of relatively lower elevation.
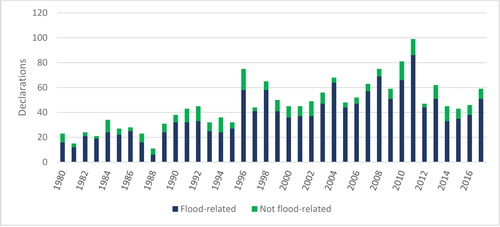
Flood risk is increasing in the United States and is reflected in a growing number of flood-related Presidential disaster declarations. Under the Robert T. Stafford Disaster Relief and Emergency Assistance Act (1988) (PL 100-707), the President may issue an emergency or major disaster declaration when an event is “of such severity and magnitude that effective response is beyond the capabilities” of state and local governments. Such declarations enable FEMA to provide assistance to impacted communities and/or households. Since 1980, the number of Presidentially declared major disasters has escalated, reaching a peak in 2011 at 99 declarations (see ). Notably, more than 80% of the 1,743 declarations made through 2017 were tied to floods and flood-related events such as hurricanes and severe storms (shown in blue in ).
Figure 1. Major disaster declarations 1980 to 2017.
Note. All figures created by the authors with public data from FEMA.
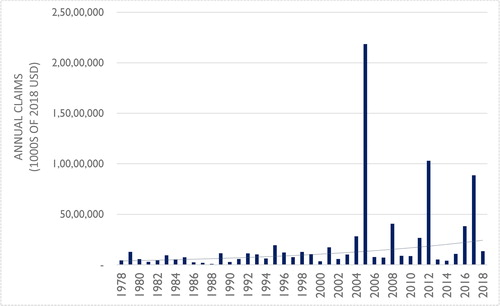
Flood insurance claims from the National Flood Insurance Program (NFIP) also show an increasing trend, as depicted in . Over its 50-year history, the NFIP’s six costliest years have all occurred in the last 15 years. In 2005, the program paid out more—$17.7 billion—than it had over the program’s history to that point. In 2012, Super Storm Sandy led to nearly $10 billion in claims paid, another extreme loss year. And Hurricanes Harvey, Irma, and Maria in 2017 led to just over $8.7 billion in claims paid. The years of highest paid claims have been associated with major hurricanes, but inland flooding has also caused substantial losses.
Figure 2. Total NFIP claims paid by year (2018 values).
Note. All figures created by the authors with publicly available data from FEMA.
Increasing losses are due in part to development decisions in flood-prone areas. There is substantial path dependency in development; once structures and infrastructure are in place, it is very difficult to abandon areas (Cronon, Citation2009; Bleakley & Lin, Citation2012). Many metropolitan areas were built up near water for use in transportation, agriculture, and commerce. Moreover, localities gain from the expansion of the real estate development in their communities through the higher local property tax revenue that such development brings. While providing economic benefits, however, there are costs when flood waters rise. As shown in , the four largest cities in the United States are on bodies of water—New York City, Los Angeles, Chicago, and Houston. also shows that property values are highest near the coast. Finally, beyond simply greater exposure, the expansion of impervious surfaces can increase flood risk as water cannot be absorbed in the soil.
Figure 3. Total property value in dollars.
Note. Map made with interpolated county-level data from the Census Bureau, downloaded from www.economist.com.
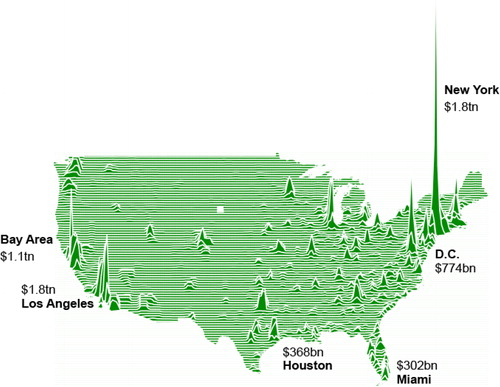
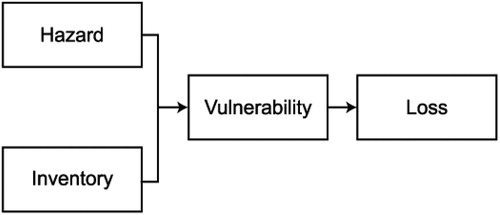
Figure 4. Structure of catastrophe models.
Climate changes are also increasing flood risk, both through changing precipitation patterns and sea-level rise. Climate-induced changes in rainfall patterns are projected to lead to increasing flooding. (Mallakpour & Villarini, Citation2015; Prein et al., Citation2017). A statistical model of the relationships between precipitation and flood damages in the United States, when linked to climate projections for changes in rainfall, predicts increasing flood damages in many areas of the country as the planet warms (Wobus et al., Citation2014). In addition, sea-level rise has already led to a higher probability of coastal flooding, which will continue in the coming years (Sweet & Park, Citation2014). As an example, a recent study of New York City finds that floods that were once characterized as 1-in-500 year events in the preindustrial era are already occurring at a 1-in-25-year interval and are likely to drop to a 1-in-5-year event in the next thirty years (Garner et al., Citation2017).
Many coastal communities are beginning to struggle with greater tidal flooding, or “sunny day flooding.” A report by the Union of Concerned Scientists finds that in their intermediate global sea level rise scenario of 4 feet by 2100, more than 270 communities in the United States will face chronic inundation by 2060, with at least 10% of the land experiencing flooding 26 times per year (Spanger-Siegfried et al., Citation2017). In their high global sea-level rise scenario of 6.5 feet by 2100, the number of chronically inundated communities would grow to 360 by 2060.
Flood Risk Assessment
In the United States, FEMA flood maps have become the de facto public information product for characterizing the current flood hazard facing a community. These maps, called Flood Insurance Rate Maps (FIRMs), are designed to implement the requirements of the National Flood Insurance Program (NFIP). FIRMs define flood zones. Two zones comprise the 100-year floodplain—the A zone and the V zone. These areas are estimated to have a 1% chance of flooding in any given year. A zones are inland floodplains and coastal floodplains subject to waves of less than 3 feet. V zones are narrow strips on the coast subject to breaking waves of at least 3 feet. The 100-year floodplain (A and V zones) is also referred to as the Special Flood Hazard Area (SFHA). FIRMs also generally show the base flood elevation (BFE) or the estimated height of waters in a 100-year flood within the SFHA, as well as the 500-year floodplain. FEMA maintains the National Flood Hazard Layer (NFHL), a publicly available digital database of flood maps and related data. As of June 2013, the NFHL data covered about 92% of the U.S. population (FEMA, Citation2013).
FEMA FIRMs have been criticized over the years. One concern is that many are outdated (National Research Council, Citation2015). While maps are supposed to be updated every five years, in reality, many maps are based on data or modeling that is much older. A 2016 report by FEMA’s Office of Inspector General finds that over half of stream/coast miles mapped by FEMA required updating or had not been assessed (Office of Inspector General, Citation2017). Another concern is that many maps do not generally capture pluvial flooding, yet climate scientists predict increasing intensification of rainfall events (Prein et al., Citation2017). Finally, many stakeholders are concerned that FEMA maps create a false sense that flood risk is binary by focusing on whether a property is “inside” or “outside” of the SFHA.
In an analysis of flood claims data throughout the country between 1978 and 2012, roughly 30% of claims were for properties outside SFHAs (Kousky & Michel-Kerjan, Citation2017). Many recent storms, including named hurricanes, led to flooding that extended beyond the SFHA and generated flood depths that exceeded the BFE by several feet (FEMA, Citation2015a). Risk outside the SFHA is not well communicated. The Technical Mapping Advisory Council, an independent group created in 2012 to advise FEMA on mapping, has recommended that FEMA move toward a structure-specific depiction of risk, as opposed to the simplistic message of being inside or outside of the SFHA (Technical Mapping Advisory Council, Citation2015).
Several other entities provide flood hazard information, often to fill in perceived gaps in the information on the FIRMs. Private companies, non-governmental organizations, academics, and even other federal agencies produce flood risk information; some groups limit attention to certain aspects of flooding, such as increases in sea-level rise, or just focus on current risk while other groups are more comprehensive. These groups also vary in their geographic coverage and how easily accessible the information is to residents or decision-makers. Some employ probabilistic flood risk models and some use modeling results to create risk scores or metrics for individual properties.
Proprietary catastrophe models for many perils have been developed by private firms and are typically used by the private insurance industry (for more detail, see Grossi & Kunreuther, Citation2005). These models generally have four modules. First, a model determines the hazard, which in the case of a flood, may be characterized by its frequency, associated water depth, and possibly velocity. Next, the exposure (or inventory) of properties at risk must be defined. This includes not only locating the structure as precisely as possible, but also identifying the relevant structural characteristics of the property that impact on the amount of damage sustained. The hazard and exposure (inventory) modules are then linked to calculate the vulnerability to damage of the structures at risk. This step in the catastrophe model quantifies the physical impact of the natural hazard phenomenon on the property and this can vary across models. Based on a particular vulnerability metric, the financial loss to the property inventory is estimated. Loss generally includes the direct impacts, such as property damage, but may include indirect losses, such as business interruption (for more on disaster losses, see Kousky, Citation2014).
While U.S. hurricane and earthquake models have been available for decades, the development of U.S. inland flood modeling is still nascent. This can be attributed to the presence of the NFIP and the lack of private sector demand for inland flood models until recently. A fundamental challenge of the modeling process is that flood risk is sensitive to individual structure characteristics and precise location.
Flood Insurance in the United States
The reluctance of the private sector to offer flood coverage led to the creation of the National Flood Insurance Program (NFIP) in 1968. Since its creation, the NFIP has been the main provider of flood insurance. Housed in FEMA, communities can voluntarily join the NFIP by adopting minimum floodplain management regulations; their residents then become eligible to purchase flood insurance policies through the program. Currently, over 22,000 communities nationwide, accounting for the majority of people at risk of flooding, participate in the program. A residential property can be insured up to $250,000 for the building structure and up to $100,000 for the contents. A business can insure both structure and contents up to $500,000. Coverage limits were set at their current levels in 1995 and are not indexed to inflation. As of September 2019, there were about 5 million policies-in-force nationwide representing roughly $1.3 trillion in coverage.
In 1973, Congress passed the Flood Disaster Protection Act, (P.L. 93-234) which established the requirement that property owners in a SFHA with a federally-backed mortgage or a loan from a federally regulated lender purchase flood insurance for the life of the loan. In 1974, Congress added a notification requirement that federally regulated lenders, which provide the substantial majority of mortgage loans in the United States, inform borrowers if their property is located in an SFHA. Some states also have disclosure laws that require property owners to inform prospective buyers if a property is located in a SFHA.
Take-up rates for flood insurance vary considerably geographically, but are generally low, even in areas subject to the mandatory purchase requirement. Recent data suggest an average take-up rate in SFHAs of around 30%, but with much greater market penetration along the hurricane-prone coasts (Kousky et al., Citation2018). Many of those uninsured could be without a mortgage, and thus not subject to the mandatory purchase requirement (discussed further below). Outside the SFHA, very few properties have a flood policy, even in areas at risk of flooding. For example, one study of New York City (Dixon et al., Citation2013) estimated that fewer than 20% of flooded buildings in Hurricane Sandy—where flood waters reached beyond the SFHA—had flood insurance. A recent estimate suggests that FEMA maps substantially underestimate the number of structures in 100-year floodplains and that it could be roughly three times higher at around 41 million people (Wing et al., Citation2018).
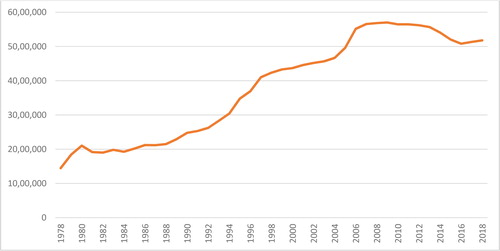
The number of policies in the NFIP grew fairly steadily until 2009 and has been declining slightly since then, as shown in . There is speculation that price increases resulting from legislation passed in 2012 and 2014 may have fueled some of the decline. Currently, roughly 60 private firms write policies and process claims on behalf of the NFIP, but bear none of the risk and are not involved in rate setting. These “write-your-own” (WYO) companies market policies and process claims (many use a vendor) in exchange for a fee.
Figure 5. NFIP policies-in-force over time.
The NFIP is heavily concentrated geographically. Roughly 35% of all policies are in Florida and another 12% are in Texas. Louisiana comes in third (with almost 9% of all policies), California fourth (6%), and New Jersey fifth (just over 4.5%) (Kousky, Citation2018). Only 1% of counties in the United States generate 51% of total policies nationwide. These 30 counties, depicted in , are concentrated in areas of very high flood risk—Florida, the Gulf and Atlantic coasts, and Sacramento, California.
Figure 6. Top 30 counties in United States by number of NFIP policies.
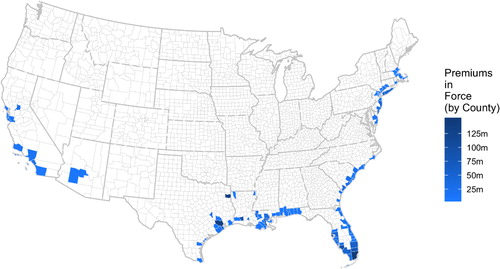
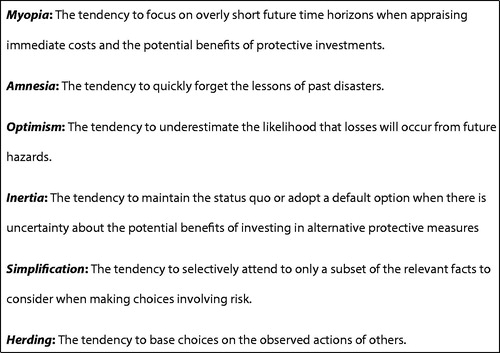
Figure 7. Cognitive biases that impact on protection against natural disaster.
NFIP policies are priced based on flood zone and property characteristics, such as elevation, number of stories, and whether the property has a basement. The programs contains several cross-subsidies from lower-risk to higher-risk properties (Kousky et al., Citation2017). One report found that for most policies, premiums may be representative of the flood risk for the structure class as a whole, but not for individual structures within the class (National Research Council, Citation2015). Structure-specific rates would provide opportunities to communicate the degree of the flood hazard to property owners and provide floodplain managers (Kunreuther et al., Citation2017). FEMA is currently in the process of revising its rating through a program referred to as Risk Rating 2.0. This will modernize rate-setting and develop property-specific prices. FEMA is currently planning to roll out Risk Rating 2.0 in 2021.
There is a very small, but growing, private flood insurance market in the United States, often providing coverage to high valued homes above the NFIP cap of $250,000 (a so-called “excess” flood policy). Private insurers target areas where they can offer broader,1 or less expensive, coverage than the NFIP. The number of residential private flood policies nationwide currently represents somewhat more than 5% of total NFIP policies (Kousky et al., Citation2018).
Several studies have sought to identify the determinants of flood insurance demand. Unsurprisingly, they generally find that take-up rates are higher in areas where the hazard is greater. Studies also find that as education of homeowners and home values increase, so too does coverage or the likelihood of insuring (Kousky, Citation2011; Landry & Jahan-Parvar, Citation2011; Atreya et al., Citation2015; Brody et al., Citation2017; Petrolia et al., Citation2013) surveyed coastal homeowners and found that those who anticipated higher damage from a flood were more likely to insure.
Researchers have also found that after a serious flood event or a year with high flood damages, take-up rates for flood insurance increase, but the effect dies out in a few years (Browne & Hoyt, Citation2000; Gallagher, Citation2014; Atreya et al., Citation2015). Much of this increase, however, could be driven by a requirement that recipients of federal disaster aid in the SFHA purchase flood insurance policies. An examination of take-up rates for flood insurance after hurricanes found that this requirement increased take-up rates by about 5%, with only an additional 1.5% increase in take-up rates not due to this requirement (Kousky, Citation2017). These policies may not be maintained, however; the increase in policies disappears three years after the disaster.
Price is a key driver of the demand for flood insurance, but price elasticity has been difficult to estimate empirically due to a number of challenges. The first is the mandatory purchase requirement: Homeowners subject to this regulation may appear price inelastic, but this may not reflect their true preferences if they could have voluntarily decided whether to purchase flood insurance. At least one study found that residents were more price sensitive if they were unlikely to have a mortgage (and thus subject to this requirement), although the elasticity was small (Dixon et al., Citation2006). In addition, NFIP premiums can be highly correlated with flood risk—or homeowners’ perception of risk—making it difficult to tease out the effect of price from the effect of risk without an exogenous change in price, which are not incorporated in these studies. Finally, premiums are observed only for policies actually bought, and so researchers cannot examine the behavior of those who choose not to insure.
Even without robust price elasticities, the cost of coverage is a critical policy topic. Since 2014, the NFIP has been phasing out some historic premium discounts for older structures. These price increases have called attention to the affordability of flood insurance. A recent report from FEMA (Citation2018) that matched NFIP data with U.S. Census data revealed that just over a quarter of NFIP policyholders in SFHAs have low incomes and just over half of non-policyholders are lower income. The report also found that the ratio of mortgage payments, property taxes, and insurance premiums (not including flood), exceeded 40% (a threshold for unaffordable housing costs) for 12% of homeowners in the SFHA with flood insurance. The report finds that the income of policyholders was higher than non-policyholders, suggesting affordability is a concern among those not currently insured, as well (FEMA, Citation2018). Several reports and papers have proposed and examined possible federal policy solutions, all centered around some form of means-tested assistance for insurance and hazard mitigation investments (see, for example, Kousky & Kunreuther, Citation2014; NRC, Citation2015, Citation2016; Dixon et al., Citation2017).
Beyond Single Peril Flood Insurance
In the United States, flood is explicitly excluded from a standard homeowners insurance policy required by most financial institutions as a condition for a mortgage. While a few private insurers now offer the option to add flood coverage to a standard homeowners insurance policy for those residing in low risk areas, homeowners policies that include protection against flood-related damage have remained elusive, despite some apparent benefits. An “all-hazards” homeowners policy would offer households peace of mind, knowing that they are covered against the damage incurred from any natural disaster. It would also avoid consumer confusion as to what perils are covered and simplify insurance purchases by reducing search and transaction costs since only one policy would be needed. Further, following a disaster, policyholders would only have to make a single claim, thus reducing arguments and post-hurricane litigation as to whether the resulting damage was caused by wind or water (Kunreuther, Citation2018b). An all-hazards insurance policy could benefit lenders by offering more protection to their loans.
Despite these benefits, all-hazards insurance policies are not offered in the United States for a number of reasons. Flood is a catastrophic peril, which can be expensive and insurance companies are concerned about rate adequacy from state insurance commissioners if it were included in a standard homeowners policy. Offering flood could also concentrate risk for insurers and would be correlated with wind exposure in hurricane-prone areas; this raises concern about insolvency risk. To make all-hazard insurance available and affordable may thus require a well-designed public private partnership. These concerns have been addressed in countries that have all-peril policies, such as France and Spain.
Flood Risk Perceptions
As discussed above, take-up rates for flood insurance tend to be low. There are a number of explanations for this, including affordability of coverage, lack of understanding of insurance, misperceptions of federal aid, and the absence of accurate information on the relevant risks facing homeowners. In addition, and which we discuss here, misperceptions of risk and other biases may help explain the low take-up of flood insurance.
A large body of cognitive psychology and behavioral economics over the past 30 years has revealed that individuals often make decisions concerning risk and uncertainty using rules of thumb and that individuals can be subject to systematic biases (e.g., Kahneman et al., Citation1982). Nobel Laureate Daniel Kahneman has characterized the differences between two modes of thinking to explain the observed behavior (Kahneman, Citation2011). Intuitive thinking (System 1) operates automatically and quickly with little or no effort and no voluntary control. This approach is often guided by emotional reactions and simple rules that have been acquired by personal experience. Deliberative thinking (System 2) allocates attention to effortful and intentional mental activities where individuals undertake trade-offs and undertake deeper analyses. Choices are normally made by combining these two modes of thinking and generally result in good decisions when individuals have considerable past experience as a basis for their actions. However, with respect to extreme events such as floods, individuals may rely too heavily on System 1 thinking, leading them astray.
Many of the errors that individuals exhibit in deciding whether to protect themselves against future losses from natural disasters by purchasing insurance and investing in cost-effective mitigation measures can be traced to the effects of six biases listed in (for more detail, see: Meyer & Kunreuther, Citation2017).
Myopia
One of our greatest weaknesses as decision-makers is that our planning horizons are typically shorter than those that are needed to see the long-run value of protective investments. For example, people routinely engage in hyperbolic discounting, where they demand far more compensation for short-term delays of gratification than could be explained by the opportunity cost of money that is defined by interest rates (Laibson, Citation1997). For hazards, even if investments in risk reduction lowers annual insurance premiums and would pay back over many years, this longterm benefit may be overshadowed by upfront costs. Had individuals considered the expected discounted benefits of the measure over a longer horizon based on the opportunity cost of money, the investment may have been viewed as financially attractive (Kunreuther et al., Citation2013).
Amnesia
Emotions, such as worry or anxiety, are often stimulated by experiencing a disaster and may lead to investment in protective measures during the immediate post-event period (e.g., Baron et al., Citation2000); however, those feelings tend to fade quickly over time. Individuals often purchase insurance only after experiencing a disaster and then cancel their policy several years later if they haven’t made a claim. It is hard to convince individuals that the best return on insurance is no return at all. An analysis of the NFIP policies-in-force revealed that the median tenure of flood insurance was between two and four years while the average length of time in a residence was seven years (Michel-Kerjan et al., Citation2012). A similar pattern has also been found in housing where after a flood, home prices may decline, but then rebound in just a few years. Political scientists have found voters to have a form of amnesia by supporting disaster relief but not disaster mitigation funding (Healy & Malhotra, Citation2009).
Optimism
People tend to believe that they are more immune than others from low probability events, such as floods; they thus perceive that the disaster will not happen to me. A principal reason for their optimism is that they have not previously experienced a flood. Estimating the likelihood of a specific event based on personal experience, termed the availability bias, has been observed and tested in a large number of controlled experiments and field studies (e.g., Tversky & Kahneman, Citation1973; Slovic, Citation2000). Another reason for the optimism bias is a tendency to construct scenarios that we hope will happen. Rather than imagining our living room being under water, we prefer to think about the scenario of not experiencing damage from a flood or hurricane, that psychologists term motivated reasoning (Kunda, Citation1990).
Inertia
A principal reason why we do not undertake protective measures to reduce future losses is that we often prefer to stay with the status quo (Samuelson & Zeckhauser, Citation1988). This saves us time and energy by not having to collect information on the costs and benefits of new alternatives. Sticking with the current state of affairs is often related to loss aversion (Kahneman & Tversky, Citation1979) in situations of uncertainty and is defended in proverbs and aphorisms such as “better the devil you know than the devil you don't,” and “when in doubt, do nothing.”
Simplification
With respect to extreme events, individuals have a tendency to consider only the likelihood of a disaster when determining whether to purchase insurance. If the perceived probability of a flood or hurricane is very small, a person is likely to treat it as below their threshold level of concern and not focus on potential losses. In a controlled experiment on insurance decision-making with money at stake, McClelland et al. (Citation1993) found that more than 25% of the subjects bid zero dollars when asked the maximum they were willing to pay for insurance protection against a specific loss, suggesting they were making their decision without reflecting on the financial consequences.
Herding
Individuals’ choices are often influenced by other people’s behavior. If a large number of one’s friends and neighbors have decided not to purchase insurance, then one is likely to follow suit (Banergee, Citation1992). A 2013 study of the factors that caused residents of Queensland, Australia to buy flood insurance found that ownership was unrelated to perceptions of the probability of floods, but highly correlated with whether residents believed there was a social norm for the insurance (Lo, Citation2013).
One way to address these biases is to conduct a behavioral risk audit (Meyer & Kunreuther, Citation2017). The behavioral risk audit starts by characterizing how individuals are likely to perceive risks and why they might not focus on the likelihood and consequences of the risk. Strategies are then proposed that work with rather than against people’s natural decision biases by drawing on the principles of choice architecture, which indicate that people’s decisions often depend in part on how different options are framed and presented (Thaler & Sunstein, Citation2008). A behavioral risk audit can assist in designing a strategy using concepts from choice architecture coupled with economic incentives to encourage property owners in flood-prone areas to purchase insurance and invest in cost-effective mitigation adaptation measures to protect themselves against future disaster losses. (Kunreuther, Citation2018a).
Floods and the U.S. Mortgage and Housing Markets
Floods and Mortgages
The mandatory purchase requirement (MPR) for flood insurance, mentioned above, is enforced when a homeowner establishes a new loan or refinances an existing loan.2 When a loan is underwritten, lenders require a FEMA-issued Standard Flood Hazard Determination Form (SFHDF) showing whether the property is in the SFHA.3 The determination is made by reviewing the latest FEMA maps. If any part of a structure designated as collateral for the loan is inside the SFHA, the borrower must purchase flood insurance. Specifically, according to the 1973 law, applicable property owners must purchase flood insurance in the amount that is “the lesser of the following:
the maximum amount of NFIP coverage available for the particular property type, or
the outstanding principal balance of the loan, or
the insurable value of the structure.”4
Since proof of insurance is a condition of loan closing, MPR enforcement is initially automatic. Lenders must also ensure that borrowers maintain flood insurance for the life of the loan. If this coverage lapses, the lender will notify the borrower of non-compliance. After a 45-day notice period, if still uninsured, the lender may force place flood insurance backdated to cover the period of non-compliance. While banks with more than $1 billion in assets must escrow flood insurance premiums, non-banks now account for almost half of all mortgage servicing (FDIC, Citation2019).
In addition, lenders must review their loan portfolios against FEMA map updates to ensure that properties newly incorporated into high-risk zones purchase flood insurance. Home equity loans in SFHAs are also subject to the MPR. The low estimated take-up rates of flood insurance in SFHAs and occasional enforcement actions against lenders suggest there is some degree of non-compliance. But 37% of homes nationwide are owned outright and many loans, such as from private sources or unregulated lenders, are not subject to MPR (Bhutta & Dettling, Citation2018; Urban Institute, Citation2020).5
After the origination of a mortgage, lenders may retain the loan in their portfolio or sell or securitize it in the secondary market. For government-insured or guaranteed loans (principally, FHA-insured or VA-guaranteed loans), eligible lenders may directly issue Government National Mortgage Association (Ginnie Mae) mortgage-backed securities (MBS) affixing the GNMA- guarantee of payment of interest and principal. For conforming conventional loans,6 eligible lenders may sell loans to the Federal National Mortgage Association (Fannie Mae) or the Federal Home Loan Mortgage Corporation (Freddie Mac), which then issues mortgage-backed securities (MBS) with their guarantee of timely payment of principal and interest. Non-conforming loans may also be sold or securitized in the secondary market; however, they do not benefit from any governmental agency guaranty of timely payments. The majority of residential mortgage loans are securitized through Ginnie Mae, Fannie Mae, or Freddie Mac (collectively, “the agencies”).
After securitization, the agencies are highly dependent on the companies that service the loans and maintain direct contact with the borrower.7 These firms are known as servicers. The agencies benefit from servicers’ contractual obligations that include monitoring ongoing compliance with hazard insurance requirements.8 In the event of a major natural disaster causing borrower hardship, the agencies typically request servicers to accommodate affected homeowners through forbearance programs. Delinquency rates on mortgage loans in flood-affected areas typically increase sharply following an event but decline during the recovery period as insurance payouts are made and other disaster relief is obtained. Servicers are generally obligated to temporarily advance loan payments to secondary market investors even when borrowers are not making payments. In the event of default and foreclosure, the agencies purchase the loan out of the securitization trust, repay servicers, and liquidate the property temporarily held on their books as real estate owned (REO). The sale of REO generally produces losses as the property cannot be sold for an amount sufficient to cover the outstanding loan balance and foreclosure expenses.
Both primary and secondary market participants undertake a range of activities to mitigate the risk of loss. Initially, they apply underwriting criteria such as minimum credit scores and maximum debt-to-income ratios and require credit enhancement for loans with high loan-to-value ratios (LTV). But mortgage insurance, the most common way of providing credit enhancement, does not generally cover losses resulting from damage to the property, such as from a flood. In addition, Fannie Mae and Freddie Mac have programs to transfer some portion of their credit risk to investors or to obtain reinsurance for credit losses above threshold levels (Gete et al., Citation2020).
Flood insurance coverage may improve post-flood loan performance. Absent a disaster, when the economy is strong and property values are increasing, there is little mortgage default risk whether or not the homeowner has coverage. A borrower unable to pay his or her mortgage can simply sell the property and pay off the loan. When property damage occurs, however, the property value will decrease, driving up the LTV, thereby increasing the default risk, in which case the lender could initiate foreclosure action. Regardless of the state of the market, homeowners with flood insurance generally are able to recover losses through claims, thereby reducing default risk. Borrowers may also use insurance claims to pay off their loan balance, as occurred in New Orleans post-Katrina (Gallagher & Hartley, Citation2017). Determining the effect of property damage from a natural disaster on foreclosure rates and credit losses is difficult at the secondary market level and there is almost no empirical research. A forthcoming paper finds a spike in mortgage delinquencies among Fannie Mae’s loan portfolio in the Hurricane Harvey impacted region of Texas; negative loan outcomes increase with property damage and decrease with flood insurance (Kousky et al., Citation2020).
While disaster-related damages may have an immediate impact on the LTV ratio, the extent of that shock is uncertain, particularly because the property’s market value includes both the value of the land and the damaged house. In addition, there may be negative externalities that affect property values if a large number of homes in the same neighborhood are damaged and other residents do not repair or rebuild, making it difficult for borrowers to sell their property. Moreover, properties that are damaged and then repaired, either from insurance proceeds, federal relief programs, or from the borrower’s own resources, are not reported to the agencies.9 Finally, the level at which negative equity resulting from a shock to the LTV ratio is sufficient to trigger borrower default—and ultimately foreclosure—is unknown and may depend on the extent of the borrower’s other assets, their attachment to the property and neighborhood, the nature of any forbearance relief offered, and their neighbors’ corresponding decisions.
Housing Price Impacts
Previous studies have found that housing markets do, to some extent, capitalize flood risk information. In some markets, homes in the SFHA sell for less than those outside the floodplain after controlling for property characteristics (MacDonald et al., Citation1990; Harrison et al., Citation2001; Bin et al., Citation2008; Daniel et al., Citation2009; Bernstein et al., Citation2018).10 It can be difficult to identify the impact of the flood risk on housing prices in coastal areas, however, given the high amenity value which is correlated with flood risk (Bin & Kruse, Citation2006; Bin et al., Citation2008). Two recent studies have shown a decline in price appreciation for coastal properties more prone to flooding (Tibbetts & Mooney, Citation2018; Kusisto, Citation2018). The timing of information on the nature of the flood risk is crucial. One study found that home buyers are not made aware that a home is in a floodplain until closing or after a purchase offer has been accepted (Chivers & Flores, Citation2002). Another study found that disclosure laws, which require information earlier in the home search process, reduce housing values in flood-prone areas (Pope, Citation2008).
Studies have found that apart from the SFHA designation, actual flood events also reduce prices (Bin & Polasky, Citation2004; Carbone et al., Citation2006). The drop is often transitory, however, with prices rebounding within a decade, sometimes sooner (Atreya et al., Citation2013; Bin & Landry, Citation2013). A recent study, however, finds a permanent decline of as much as 8% in areas affected by Super Storm Sandy (Ortega & Taṣpınar, Citation2018). Declines in property values have also been found outside the SFHA when floods produced broader economic damage, even if specific homes were not themselves damaged (Kousky, Citation2010). Near misses can also lower property values (Hallstrom & Smith, Citation2005).
Neighborhood Impacts
Floods can have community-wide impacts beyond the damage to individual structures. All households will be affected to some degree by infrastructure damage, business interruption, foreclosed and blighted housing, and disruption in city services, even if their own homes remain unscathed. Local governments may also suffer losses in property tax revenue due to damaged structures as well as business interruptions reducing sales tax revenue.
The availability of financial assistance may also affect loan performance, with potential negative feedback effects on property values if foreclosures are widespread. For example, the number of blighted properties in New Orleans rose from 26,000 before Hurricane Katrina, to over 43,000 after the storm (Kotkin, Citation2014). Beyond property damage, displaced households will inevitably incur additional costs including temporary living expenses, as NFIP does not cover these. Particularly in neighborhoods in decline before the event, homeowners may choose to walk away if the cost of repairing structures exceeds the value of the property and use any disaster assistance received simply to relocate.
An increase in vacancy rates, neighborhood blight, and lack of amenities is likely to exacerbate declines in property values. Under these circumstances, given housing dislocation and possible job loss, affected mortgage borrowers may be unable to make mortgage payments and generate sufficient funds when selling their house to cover the unpaid mortgage balance. Research has found that the variation in recovery from property damage is not just based on the magnitude of the losses but also on the social vulnerability of the community (e.g., Finch et al., Citation2010).
Beyond individual events, long term trends such as sea level rise may have negative impacts on neighborhoods in coastal communities. Investors are increasingly aware of the issue. For example, a 2017 Moody’s Investors Service report (Moody’s Investors Service, Citation2017) discusses the potential economic impact of sea level rise as a factor relevant in municipal bond ratings. Focusing on housing, Zillow estimates the impact of 6 feet of sea level rise (an estimate for 2100) on the U.S. housing market and finds that 2% of homes nationwide—worth about $1 trillion—would be at risk of inundation (Rao, Citation2017; Bretz, Citation2017). Recent research using data from New Zealand, however, finds that future risks of sea level rise are not currently capitalized into housing prices (Filippova et al., Citation2020) consistent with the myopia phenomenon previous described.
Conclusion
Flooding is the most frequent and costliest natural disaster in the United States. Scientists predict more serious flood losses in the future, due to coastal real estate development, changing storm and precipitation patterns, and sea level rise. This will affect housing and mortgage markets. Today some financial protection is provided by flood insurance, predominantly through the National Flood Insurance Program (NFIP), with a small private, residential flood insurance market emerging. For property in Special Flood Hazard Areas (SFHAs), flood insurance is required as a condition for a federally backed mortgage. However, the average take-up rates for flood insurance among all those at risk remains low.
The large number of uninsured property in flood-prone areas could create negative externalities including the costs to taxpayers of federal disaster relief and possible declines in local tax revenue adversely affecting municipal finances. When homeowners miss payments on their mortgage, loan modifications, or, in the extreme, default on mortgage debt, it can impose costs on banks and secondary market institutions.
There are multiple reasons for the flood insurance gap, some of which is driven by cognitive biases that affect risk-related decisions. Lack of information about property-specific risk also may also impair decision making by households. Price is also a key determinant of coverage as those most in need of flood coverage are often those least able to afford it.
Policy Options
A number of policy reforms could help protect the housing and mortgage markets in the face of increasing flood risk. Here we briefly identify a few. First, measures to encourage the development of all-hazards insurance policies as a standard offering would provide broader financial protection to households. Second, extending the mandatory purchase requirement to a broader area, such as the 500-year floodplain, would reduce the flood insurance gap and possibly help spur development of the private insurance market, together with appropriate indicators and pricing of risk. Third, more information and more effective communication earlier in the home search process could help residents make informed decisions about where to locate, what cost-effective risk reduction investments to make, and whether to purchase insurance. This could be coupled with carefully framed messages to address behavioral biases using data on the risks to property in flood and hurricane-prone areas now being developed by both non-profits and private firms. Fourth, public private partnerships could be explored as ways to close the flood insurance gap. Finally, greater community level investments in flood protection through both green and gray infrastructure could reduce flood damages and increase the resilience of the community.
Future Research
Despite the increasing risk facing the U.S. housing market, there are multiple gaps in our understanding. Here we identify a few promising areas for future research.
First, there is a need to understand the impact that sea level rise and repeated flooding is likely to have on coastal and inland communities in the coming years and steps that can be taken now to reduce the resulting flood related damage and the risks faced by financial institutions. While many studies highlight the growing coastal flood risk from the combined forces of changing storm patterns and sea level rise, there are still many unanswered questions about how the housing market will respond and the appropriate policy responses to this threat in the near- and medium-term. What steps might lenders and secondary mortgage market institutions take now to minimize negative economic impacts? How can retreat from areas of repetitive flooding be undertaken smoothly to minimize disruption and economic costs?
Second, determinants of community resiliency could be better understood. Studies reveal that some flood ravaged neighborhoods rebuild, helping explain why economic activity often increases in the aftermath of disasters (Dacy & Kunreuther, Citation1968). The long term economic value of neighborhoods is determined by location and access to jobs and amenities, and this may remain unchanged after a natural disaster (Cavallo et al., Citation2013; Zandi et al., Citation2006). Chronic innundation, however, may lead to more permanent shifts, impacting economic activitiy and the viability of communities. What policies can improve longterm recovery? What is the cost-benefit calculation for investments in flood risk mitigation? How can local governments be encouraged to more effeciently and equitably regulate development in flood-prone areas?
Finally, as there have not yet been widespread mortgage defaults post-flood, what risk mitigation methods might be adopted now to better prepare borrowers, lenders, and the GSEs for a future of increasing flood risk? At what point will chronic inundation be severe enough to cause tipping points in the economy and more widespread neighborhood effects? What can be done to mitigate those costs? What role can lenders and secondary market institutions play in sending risk-based financial signals to housing markets to help smooth the transition?
Acknowledgments
We thank Jeffrey Czajkowski, Katherine Greig, Brett Lingle, and Andrew Renninger for their research assistance. Additional thanks to Michael Berman for comments on earlier drafts. We also thank Fannie Mae for financial support and two anonymous journal referees. An earlier version of this paper was presented at the American Real Estate Society’s annual meeting. Authors names are listed alphabetically.
Notes
1 Broader coverage could include higher limits, temporary living expenses, and replacement cost coverage, for example.
5 As of 2019, 13.7 trillion of the total 16 trillion mortgage outstanding in U.S. dollars (86%) are federally regulated, with 5.7 trillion in the private depository institutions and 8 trillion by the GSE, or agency- and GSE-backed mortgage pools. The remaining 2.3 trillion mortgages (14%) are not held by banks or federal agencies. Source: Federal Reserve Board Financial Account, Z1 Table (L.217).
6 Conventional conforming loans are loans that meet eligibility standards of the two major government-sponsored enterprises, Fannie Mae and Freddie Mac, developed in consultation with their regulator and conservator, the Federal Housing Finance Agency (FHFA). Generally, such loans must be smaller than the conforming loan limit as set annually by FHFA and carry credit enhancement if the LTV exceeds 80%.
7 Loan servicing consists of collecting payments from borrowers, including flood insurance premiums where applicable, reporting, and managing payoffs, default and foreclosure activities, and forbearance and loan modifications. Servicers receive a fee for these activities as do the agencies for their credit guarantees.
8 While remedies for breaches of contractual obligations may vary, requiring the servicer or originator to repurchase the loan (or loans) at issue is a common resolution. For example, if a servicer should have maintained flood insurance on the collateral property securing the loan and failed to do so, a repurchase demand would typically be issued.
9 GNMA securities are slightly different inasmuch as HUD rules require that the property be repaired prior to its conveyance in the event of default and foreclosure, an obligation that falls on GNMA servicers whether the property is insured or not.
10 For example, some of the areas studied include: Homewood, Alabama; Alachua County, Florida; Lee County, Florida; Monroe, Louisiana; Carteret County, North Carolina; Pitt County, North Carolina; Fargo, North Dakota; Moorhead, Minnesota; Lacrosse, Wisconsin; Milwaukee, Wisconsin; and Wauwatosa, Wisconsin.
References
- Atreya, A., Ferreira, S., & Kriesel, W. (2013). Forgetting the flood? An analysis of the flood risk discount over time. Land Economics, 89(4), 577–596.
- Atreya, A., Ferreira, S., & Michel-Kerjan, E. (2015). What drives households to buy flood insurance? New evidence from Georgia. Ecological Economics, 117, 153–161.
- Baron, J., Hershey, J. C., & Kunreuther, H. (2000). Determinants of priority for risk reduction: the role of worry. Risk Analysis, 20(4), 413–428.
- Bernstein, A., Gustafson, M., & Lewis, R. (2018). Disaster on the horizon: The price effect of sea level rise. SSRN. https://papers.ssrn.com/sol3/papers.cfm?abstract_id=3073842
- Bhutta, N., & Dettling, L. J. (2018). Assessing families' liquid savings using the survey of consumer finances (No. 2018-11-19). Board of Governors of the Federal Reserve System (US).
- Bin, O., & Kruse, J. B. (2006). Real estate market response to coastal flood hazards. Natural Hazards Review, 7(4), 137–144.
- Bin, O., Crawford, T. W., Kruse, J. B., & Landry, C. E. (2008). Viewscapes and flood hazard: Coastal housing market response to amenities and risk. Land Economics, 84(3), 434–448.
- Bin, O., Kruse, J. B., & Landry, C. E. (2008). Flood hazards, insurance rates, and amenities: Evidence from the coastal housing market. Journal of Risk and Insurance, 75(1), 63–82.
- Bin, O., & Landry, C. E. (2013). Changes in implicit flood risk premiums: Empirical evidence from the housing market. Journal of Environmental Economics and Management, 65(3), 361–376. HYPERLINK “https://protect-us.mimecast.com/s/SL58C5ylW5F05NOpXUzgQhi?domain=doi.org” https://doi.org/10.1016/j.jeem.2012.12.002.
- Bin, O., & Polasky, S. (2004). Effects of flood hazards on property values: Evidence before and after Hurricane Floyd. Land Economics, 80(4), 490–500.
- Bleakley, H., & Lin, J. (2012). Portage and path dependence. The Quarterly Journal of Economics, 127(2), 587–644.
- Bretz, L. (2017, October 18). Climate change and homes: Who would lose the most to a rising tide? Zillow Research. https://www.zillow.com/research/climate-change-underwater-homes-2-16928/
- Brody, S. D., Highfield, W. E., Wilson, M., Lindell, M. K., & Blessing, R. (2017). Understanding the motivations of coastal residents to voluntarily purchase federal flood insurance. Journal of Risk Research, 20(6), 760–775.
- Browne, M. J., & Hoyt, R. E. (2000). The demand for flood insurance: Empirical evidence. Journal of Risk and Uncertainty, 20(3), 291–306.
- Carbone, J. C., Hallstrom, D. G., & Smith, V. K. (2006). Can natural experiments measure behavioral responses to environmental risks? Environmental and Resource Economics, 33(3), 273–297.
- Cavallo, E., Galiani, S., Noy, I., & Pantano, J. (2013). Catastrophic natural disasters and economic growth. Review of Economics and Statistics, 95(5), 1549–1561.
- Chivers, J., & Flores, N. E. (2002). Market failure in information: The National Flood Insurance Program. Land Economics, 78(4), 515–521.
- Cronon, W. (2009). Nature's metropolis: Chicago and the Great West. W.W. Norton & Company.
- Dacy, D. & H. Kunreuther (1968). The economics of natural disasters. Free Press.
- Daniel, V. E., Florax, R. J., & Rietveld, P. (2009). Flooding risk and housing values: An economic assessment of environmental hazard. Ecological Economics, 69(2), 355–365.
- Dixon, L., Clancy, N., Bender, B., Kofner, A., Manheim, D., & Zakaras, L. (2013). Flood insurance in New York City following Hurricane Sandy. Rand Corporation.
- Dixon, L., Clancy, N., Miller, B. M., Hoegberg, S., Lewis, M. M., Bender, B., … & Choquette, S. R. (2017). The cost and affordability of flood insurance in New York City. RAND Corporation.
- Dixon, L., Clancy, N., Seabury, S.A. and Overton, A. (2006). The National Flood Insurance Program’s market penetration rate: estimates and policy implications. RAND Corporation.
- Federal Deposit Insurance Corporation (FDIC). (2019). Trends in mortgage origination and servicing: Nonbanks in the post-crisis period. Federal Deposit Insurance Corporation. https://www.fdic.gov/bank/analytical/quarterly/2019-vol13-4/fdic-v13n4-3q2019-article3.pdf
- Federal Emergency Management Agency (FEMA). (2013). The national flood hazard layer: Products and services using FEMA’s flood hazard data. Federal Emergency Management Agency.
- Federal Emergency Management Agency (FEMA). (2015a). Designing for flood levels above the BFE after Hurricane Sandy (Hurricane Sandy Recovery Advisory, RA52013). Federal Emergency Management Agency.
- Federal Emergency Management Agency (FEMA). (2018). An affordability framework for the National Flood Insurance Program. Department of Homeland Security, Federal Emergency Management Agency.
- Filippova, O., Nguyen, C., Noy, I., & Rehm, M. (2020). Who cares? Future sea level rise and house prices. Land Economics, 96(2), 207–224.
- Finch, C., Emrich, C. T., & Cutter, S. L. (2010). Disaster disparities and differential recovery in New Orleans. Population and Environment, 31(4), 179–202.
- Gallagher, J. (2014). Learning about an infrequent event: Evidence from flood insurance take-up in the United States. American Economic Journal: Applied Economics, 206–233.
- Gallagher, J., & Hartley, D. (2017). Household finance after a natural disaster: The case of Hurricane Katrina. American Economic Journal: Economic Policy, 9(3), 199–228.
- Garner, A. J., Mann, M. E., Emanuel, K. A., Kopp, R. E., Lin, N., Alley, R. B., … & Pollard, D. (2017). Impact of climate change on New York City’s coastal flood hazard: Increasing flood heights from the preindustrial to 2300 CE. Proceedings of the National Academy of Sciences, 114(45), 11861–11866.
- Gete, P., Tsouderou, A., & Wachter, S. (2020). Mortgage stress without GSEs. Lessons from hurricanes and the credit risk transfers. SSRN. https://ssrn.com/abstract=3613211
- Grossi, P., & Kunreuther, H. (2005). Catastrophe modeling: A new approach to managing risk (Vol. 25). Huebner International Series on Risk, Insurance and Economic Security, Springer Science & Business Media.
- Hallstrom, D. G., & Smith, V. K. (2005). Market responses to hurricanes. Journal of Environmental Economics and Management, 50(3), 541–561.
- Harrison, D., T. Smersh, G., & Schwartz, A. (2001). Environmental determinants of housing prices: The impact of flood zone status. Journal of Real Estate Research, 21(1-2), 3–20.
- Healy, A., & Malhotra, N. (2009). Myopic voters and natural disaster policy. American Political Science Review, 387–406.
- Kahneman, D. (2011). Thinking, fast and slow. Farrar, Straus and Giroux.
- Kahneman, D., Slovic, P. & Tversky, A. (Eds.) (1982). Judgment under uncertainty: Heuristics and biases. Cambridge University Press.
- Kahneman, D. & Tversky, A. (1979). Prospect theory: An Analysis of decision under risk. Econometrica, 47(4), 263–291.
- Kotkin, J. (2014). Sustaining prosperity: A long term vision for the New Orleans region. Greater New Orleans, Inc.
- Kousky, C. (2010). Learning from extreme events: Risk perceptions after the flood. Land Economics, 86(3), 395–422.
- Kousky, C. (2011). Understanding the demand for flood insurance. Natural Hazards Review, 12(2), 96–110.
- Kousky, C. (2014). Informing climate adaptation: A review of the economic costs of natural disasters. Energy Economics, 46, 576–592.
- Kousky, C. (2017). Disasters as learning experiences or disasters as policy opportunities? Examining flood insurance purchases after hurricanes. Risk Analysis, 37(3), 517–530.
- Kousky, C. (2018). Financing flood losses: A discussion of the National Flood Insurance Program. Risk Management and Insurance Review, 21(1), 11–32.
- Kousky, C., & Kuneuther, H. (2014). Addressing affordability in the National Flood Insurance Program. Journal of Extreme Events, 1(1), 1–28.
- Kousky, C., Lingle, B., & Shabman, L. (2017). The pricing of flood insurance. Journal of Extreme Events 4(1):17500014.
- Kousky, C., & Michel‐Kerjan, E. (2017). Examining flood insurance claims in the United States: Six key findings. Journal of Risk and Insurance, 84(3), 819–850.
- Kousky, C., Kunreuther, H., Lingle, B., & Shabman, L. (2018) The emerging private residential flood insurance market in the United States. Wharton Risk Management and Decision Processes Center. https://riskcenter.wharton.upenn.edu/wp-content/uploads/2018/07/The-Emerging-Flood-Insurance-Market-Report.pdf
- Kousky, C., Palim, M., & Pan, Y. (2020). Flood risk and mortgage credit risk: A case study of Hurricane Harvey. The Journal of Housing Research, 29(S1).
- Kunda, Z. (1990). The case for motivated reasoning. Psychological Bulletin, 108(3), 480.
- Kunreuther, H. (2018a). Improving the National Flood Insurance Program. Behavioural Public Policy, 1–15.
- Kunreuther, H. (2018b). All‐hazards homeowners insurance: Challenges and opportunities. Risk Management and Insurance Review, 21(1), 141–155.
- Kunreuther, H., Dorman, J., Edelman, S., Jones, C., Montgomery, M., & Sperger, J. (2017). Structure specific flood risk based insurance. Journal of Extreme Events, 4(3), 1750011.
- Kunreuther, H., Meyer, R., & Michel-Kerjan, E. (2013). Overcoming decision biases to reduce losses from natural catastrophes. In E. Shafir (Ed.), Behavioral Foundations of Policy. Princeton: Princeton University Press.
- Kusisto, L. (2018, August 25). Flooding risk knocks $7 billion off home values, study finds. The Wall Street Journal.
- Laibson, David. (1997). Golden eggs and hyperbolic discounting. Quarterly Journal of Economics, 112, 443–477
- Landry, C. E., & Jahan‐Parvar, M. R. (2011). Flood insurance coverage in the coastal zone. Journal of Risk and Insurance, 78(2), 361–388.
- Lo, A. Y. (2013). The role of social norms in climate adaptation: Mediating risk perception and flood insurance purchase. Global Environmental Change, 23(5), 1249–1257.
- MacDonald, D. N., White, H. L., Taube, P. M., & Huth, W. L. (1990). Flood hazard pricing and insurance premium differentials: Evidence from the housing market. Journal of Risk and Insurance, 654–663.
- Mallakpour, I., & Villarini, G. (2015). The changing nature of flooding across the central United States. Nature Climate Change, 5(3), 250–254.
- McClelland, G. H., Schulze, W. D., & Coursey, D. L. (1993). Insurance for low-probability hazards: A bimodal response to unlikely events. Journal of Risk and Uncertainty, 7, 95–116.
- Meyer, R., & Kunreuther, H. (2017). The ostrich paradox: Why we underprepare for disasters. Wharton School Press.
- Michel-Kerjan, E., Lemoyne de Forges, S., & Kunreuther, H. (2012). Policy tenure under the US national flood insurance program (NFIP). Risk Analysis: An International Journal, 32(4), 644–658.
- Moody’s Investors Service. (2017, November 28). Moody’s: Climate change is forecast to heighten US exposure to economic loss placing short- and long-term credit pressure on US states and local governments [Research announcement]. https://www.moodys.com/research/Moodys-Climate-change-is-forecast-to-heighten-US-exposure-to–PR_376056
- National Research Council. (2015). Tying flood insurance to flood risk for low-lying structures in the floodplain. Washington, DC: National Academies Press.
- National Research Council. (2016). Affordability of national flood insurance premiums: Report 2. Washington, DC: National Academies Press.
- Office of Inspector General. (2017). FEMA needs to improve management of its flood mapping programs. U.S. Department of Homeland Security.
- Ortega, F., & Taṣpınar, S. (2018). Rising sea levels and sinking property values: Hurricane Sandy and New York’s housing market. Journal of Urban Economics, 106, 81–100.
- Petrolia, D. R., Landry, C. E., & Coble, K. H. (2013). Risk preferences, risk perceptions, and flood insurance. Land Economics, 89(2), 227–245.
- Pope, J. C. (2008). Do seller disclosures affect property values? Buyer information and the hedonic model. Land Economics, 84(4), 551–572.
- Prein, A. F., Rasmussen, R. M., Ikeda, K., Liu, C., Clark, M. P., & Holland, G. J. (2017). The future intensification of hourly precipitation extremes. Nature Climate Change, 7(1), 48–52.
- Rao, K. (2017). Climate change and housing: Will a rising tide sink all homes? Zillow Research. https://www.zillow.com/research/climate-change-underwater-homes-12890.
- Samuelson, W., & Zeckhauser, R. (1988). Status quo bias in decision making. Journal of Risk and Uncertainty, 1(1), 7–59.
- Slovic, P. (2000). The perception of risk. Earthscan.
- Spanger-Siegfried, E., Dahl, K., Caldas, A., Udvardy, S., Cleetus, R., Worth, P., & Hernandez Hammer, N. (2017). When rising seas hit home: Hard choices ahead for hundreds of U.S. Coastal Communities. Union of Concerned Scientists.
- Sweet, W. V., & Park, J. (2014). From the extreme to the mean: Acceleration and tipping points of coastal inundation from sea level rise. Earth's Future, 2(12), 579–600.
- Technical Mapping Advisory Council. (2015). 2015 Annual report summary. Technical Mapping Advisory Council.
- Thaler, R. H. & Sunstein, C. R. (2008). Nudge: Improving decisions about health, wealth, and happiness. Yale University Press.
- Tibbetts, J. & Mooney, C. (2018, August 20). Sea level rise is eroding home value, and owners might not even know it. The Washington Post.
- Tversky, A., & Kahneman, D. (1973). Availability: A heuristic for judging frequency and probability. Cognitive Psychology, 5(2), 207–232.
- Urban Institute. (2020, March 26). Housing finance at a glance: A monthly chartbook, March 2020. https://www.urban.org/research/publication/housing-finance-glance-monthly-chartbook-march-2020/view/full_report
- Wing, O. E., Bates, P. D., Smith, A. M., Sampson, C. C., Johnson, K. A., Fargione, J., & Morefield, P. (2018). Estimates of present and future flood risk in the conterminous United States. Environmental Research Letters, 13(3), 034023.
- Wobus, C., Lawson, M., Jones, R., Smith, J., & Martinich, J. (2014). Estimating monetary damages from flooding in the United States under a changing climate. Journal of Flood Risk Management, 7(3), 217–229.
- Zandi, M., Cochrane, S., Ksiazkiewicz, F., & Sweet, R. (2006). Restarting the economy. In E. L. Birch & S. M. Wachter (Eds.). Rebuilding urban places after disaster: Lessons from Hurricane Katrina (pp. 103–116). University of Pennsylvania Press.