
Abstract
Many families live on the financial edge, but a natural disaster can throw even better-situated families into financial turmoil. Comparing the financial outcomes of residents in areas hit by natural disasters with otherwise similar people in unaffected communities, this study finds that natural disasters lead to declines in credit scores and mortgage performance, increases in debt in collection, and impacts on credit card access and debt—effects that persist or even worsen over time. We also find that people who are more likely to be struggling financially before disasters strike are often the hardest hit by the disaster. Specifically, for people with low pre-disaster credit scores, as well as those who live in a community of color, the estimated declines in credit scores are particularly substantial. We find a similar pattern for mortgage delinquency and foreclosure. This pattern of results suggests that disasters may be not only harmful for affected residents on average, but may also have the effect of widening already existing inequalities. Our results also suggest that medium-sized disasters, which are less likely to receive long-term public recovery funding, lead to larger negative declines on credit scores than large disasters.
Images of climate-change driven destruction—coastal communities swept away by storm surges and hurricane-force winds, whole neighborhoods erased by wildfires and tornadoes, populations displaced overnight—fill newspapers and TV screens. In fact, in the three years from 2017 to 2019, there were 44 “billion-dollar disasters,” with a total cost of over $460 billion (National Oceanic and Atmospheric Administration [NOAA], Citation2020). These events run the gamut from wildfires in California, drought in the Southwest, tornadoes in the South, to hurricanes and winter storms in the East. Beyond these large, widely publicized events are dozens of smaller disasters that disrupt communities and their residents (U.S. Global Change Research Program, 2018).
At the same time, many families live on the financial edge and lack the means to absorb even small financial setbacks. More than 30% of U.S. families spend more than 30% of their incomes on housing (Joint Center for Housing Studies of Harvard University, Citation2019). Nearly 40% of Americans report that they cannot cover a $400 unplanned expense without borrowing or selling something (Board of Governors of the Federal Reserve System, Citation2020). Low-income, middle-income, and even some high-income families struggle to meet their basic expenses after an unexpected shock (McKernan et al., Citation2016).
The combination of devastating natural disasters with financially fragile families can be a recipe for short-term hardship, long-term declines in financial health, and increases in housing instability. These negative effects may be particularly pronounced after smaller scale disasters, which are vastly more frequent but do not receive a massive infusion of federal assistance dollars or temporary relief from lenders, financial institutions, and other service providers typical of the most severe events.
Using data on multiple natural disasters across the United States, this paper provides empirical evidence on the impact of natural disasters on residents’ credit health and ability to meet financial obligations. We find that natural disasters lead to declines in credit scores and mortgage performance, and that the effects persist or even worsen over time. Beyond credit score and mortgage performance, we find evidence that natural disasters lead to increases in debt in collection and affect both credit card access and debt, although these results are more pronounced in medium-sized disasters. Our results also suggest that medium-sized disasters, which are less likely to receive long-term public recovery funding, lead to larger negative declines in credit scores than large disasters. Additionally, we find that people who are more likely to be struggling financially before disasters strike are often the hardest hit by the disaster. This pattern of results suggests that disasters may be not only harmful for affected residents on average, but may also have the effect of widening already existing inequalities.
Background: Natural Disasters and Financial and Housing Instability
Natural disasters can harm people’s finances through various channels. Personal property, such as the belongings inside a home and/or an automobile, can be damaged or destroyed. A flooded home can leave a homeowner with both a mortgage and a rent payment until the home is habitable. A damaged car can leave the owner with a loan to pay, but no way to get to work. These losses can also leave people struggling to pay deductibles for insurance claims, assuming the all-too-rare condition that a household has the appropriate hazard policy coverage for its property and possessions (Kousky & Cooke, Citation2012) and that the coverage applies in that instance. Bodily injury and mental trauma can lead to additional health care costs not necessarily covered by individual health insurance (Rudowitz et al., Citation2006). At the same time, businesses may be shuttered for days, if not weeks, leaving employees without paychecks.
The consequence of multiple and simultaneous financial setbacks can leave residents struggling to meet their financial obligations in the short term (e.g., rent/mortgage, utility bills, auto loans) and jeopardize their longer-term financial security. After Hurricanes Harvey and Irma, an analysis of checking account data suggests a decline in income, as checking account inflows fell by over 20% (Farrell & Greig, Citation2018). Additionally, 12 weeks after these disasters, spending on home expenses had risen by 9% in Miami and by 33% in Houston, while spending on debt payments and health care had dropped in both locations (Farrell & Greig, Citation2018).
Earnings fall immediately after disasters but tend to rebound over time (Guimaraes et al., Citation1993). Using tax return data to estimate the effects of Hurricane Katrina, Deryugina et al. (Citation2018) find evidence of reduced earnings. However, these reductions fade after two years, and by year three, average earnings increase. Using administrative wage records, Groen et al. (Citation2017) similarly find that negative initial impacts of Hurricanes Katrina and Rita on earnings and employment not only fade, but reverse over time, with affected individuals eventually earning more than unaffected individuals.
The federal government, in coordination with state and local governments, provides various disaster recovery and relief policies and programs designed to reduce the effects of natural disasters on households’ property damages and overall financial well-being. The Federal Emergency Management Association’s (FEMA) Individual Assistance (IA) program funds direct disaster assistance to individuals through the Individuals and Households Program (IHP), and the Small Business Administration (SBA) provides loans for homeowners to repair or rebuild. Congress may appropriate funds for the Community Development Block Grant Disaster Recovery (CDBG-DR) program and tends to do so after larger disasters (Martín et al., Citationforthcoming). CDBG-DR is administered by HUD to grant state and local governments additional funds to fulfill unmet housing needs in disaster-affected areas (U.S. Department of Housing and Urban Development [HUD], Citation2016). Other smaller assistance programs are also generally available; for example, the Low-Income Home Energy Assistance Program (LIHEAP) allows states to use funds to aid in disaster relief and recovery for households’ utility bills.
Concurrently, federal, quasi-governmental, and private lenders have provisions that adapt to the needs of households affected by disasters through financial relief. For example, the Federal Housing Administration (FHA), Fannie Mae, and Freddie Mac all have policies in place to relieve short-term burdens on mortgage holders. In the 2017 hurricane season, this included forbearance programs, restructuring, and moratoria on credit reporting, foreclosure, and eviction (Kaul & Goodman, Citation2017). Private banks, lenders, and other financial institutions also may create special relief programs. Recent examples include moratoria on credit score reporting, forbearance, or direct financial counseling and fraud alerts. However, there are no consistent triggers or eligibility criteria.
Finally, local charitable resources are deployed to help victims of natural disasters meet their immediate and evolving needs. For example, after major disasters, the Red Cross provides small grants to families to help with relocation and immediate basic needs.
Yet, however helpful to those suffering the effects of natural disasters, assistance and relief from these sources are unable to fully protect affected residents from financial hardship. Many eligible applicants do not pursue assistance or relief, and significant shares of applications for disaster-related assistance are turned down. In 2017, FEMA rejected two-thirds of IA applications in the aftermath of Hurricanes Harvey, Irma, and Maria, and the California wildfires (Martín, Citation2019). Not every form of assistance is available after every disaster. For example, the Disaster Housing Assistance Program, in the form of rental assistance, has been made available only sporadically. Many federal programs are targeted at specific subpopulations. This is the case for SBA loans, which can only be used to repair owner-occupied homes and replace damaged personal property. Finally, despite the importance of the nonprofit sector in the response to natural disasters, local organizations and their staff are many times themselves affected by the disaster and may lack the experience and capacity to meet residents’ and community needs.
Given these gaps, there is growing evidence that natural disasters exacerbate existing inequalities. After Hurricane Andrew, homes in low-income and minority neighborhoods and rental properties recovered more slowly (Zhang et al., Citation2009). Fussell and Harris (Citation2014) show that the odds of staying in the same home after Hurricane Katrina increased with homeownership and was lower for renters in subsidized housing than renters without subsidies. Howell and Elliot (Citation2018), using the Panel Study of Income Dynamics, find that wealth inequality rises as local hazard damages increase, especially along lines of race, education, and homeownership. Moreover, given a level of local damage, increased aid from FEMA is associated with greater increases in inequality. Gallagher and Hartley (Citation2017) find that financially vulnerable consumers are less able to access credit in the year following the hurricane.
Recent papers by Gallagher and Hartley (Citation2017), Edmiston (Citation2017), and Roth Tran and Sheldon (Citation2017) use the Federal Reserve Bank of New York’s Consumer Credit Panel to consider impacts of disasters on financial health. Gallagher and Hartley (Citation2017) study the effects after Hurricane Katrina, finding small reductions in credit scores, increases in credit card debt and delinquencies, and evidence that financially vulnerable consumers are less able to access credit in the year following the hurricane. These effects are generally modest in size. For example, Katrina is estimated to have lowered credit scores by 4.3 points in the fourth quarter following the storm, on average. They also find that the negative effects fade and even reverse by the third year following the storm, estimating, for example, that Katrina led to reductions in total debt among those in the most flooded regions of New Orleans, driven by individuals’ use of insurance payments to pay down mortgages.
Edmiston (Citation2017) considers the impacts of a larger set of disasters—major hurricanes, tornados, and floods in the southeastern United States between 2000 and 2014—using the same source of credit bureau data. The results also link hurricanes to reductions in credit scores, particularly among people who were more financially vulnerable before the storm (measured by unpaid bills and high bank card utilization rates). Interestingly, in looking at effects across a range of disaster sizes, Edmiston (Citation2017) shows some evidence that negative effects of natural disasters on financial health may be smallest for the least and most severe events—a finding the author attributes potentially to variations in the levels of public aid and private relief across disasters.
Roth Tran and Sheldon (Citation2017), in contrast, find few statistically significant impacts of disasters on credit outcomes. There is evidence that individuals in areas that are affected by disasters but do not quality for FEMA IHP are more reliant on credit cards. And, individuals with subprime credit or in low-income areas that did not quality for IHP are more likely to declare bankruptcy.
Our study builds on this research in several ways. We synthesize the strengths of the existing literature and focus more specifically on credit scores and mortgage delinquency and foreclosure. We follow Edmiston (Citation2017) and Roth Tran and Sheldon (Citation2017) by looking across a wide range of disasters. A difference with Roth Tran and Sheldon (Citation2017) is that we examine disparities between areas that are majority white and communities of color. Our matching technique also provides a different point of comparison than those used in the existing literature. Edmiston (Citation2017) compares people affected by disasters to unaffected individuals in the same state. Gallagher and Hartley (Citation2017) draw inference by comparing outcomes between more and less affected areas. Roth Tran and Sheldon (Citation2017) make two comparisons: between affected counties and their neighbors, and between affected areas that did and did not receive FEMA IHP aid. In each case, the authors assume that unaffected or less-affected individuals living in nearby locations provide a suitable control group. In contrast, we follow the approach of Deryugina et al. (Citation2018) and Groen et al. (Citation2017), removing the geographic constraint and using a data-driven matching process to select a control group of ZIP codes. We also differ from the existing literature in our method for estimating treatment effect. Gallagher and Hartley (Citation2017), Edmiston (Citation2017) and Roth Tran and Sheldon (Citation2017) use regression to control for differences between treated and untreated locations. In contrast, we use a matching estimator that compares people in affected ZIP codes to similar people in similar places. The matching estimator requires fewer assumptions about functional form (e.g., are effects additive or proportional), is easy to interpret, and provides a point of comparison to the prior literature.
Data
Data for our empirical analyses come from three major sources: FEMA, a major credit bureau, and the Census Bureau’s American Community Survey (ACS). Specifically, FEMA data identify which communities have been hit by a natural disaster, credit bureau data are used to measure people’s financial health, and ACS data provide contextual information about communities included in our analysis. Together, these data allow us to locate ZIP codes affected by natural disasters and observe the financial health of people living in these affected ZIP codes. Below we describe the three data sources in turn.
Federal Emergency Management Agency Data
To identify places affected by natural disasters, we draw on FEMA’s Housing Assistance Data. FEMA creates these data as a part of administering IHP and makes them available to the public at the ZIP code level.1 These data provide information on the number of applications for and the number of recipients of IHP assistance for both homeowners and renters affected by natural disasters, including FEMA’s damage assessments.
We focus on disasters that occurred from 2011 through the summer of 2014. Given the availability of credit bureau data (2010–17), this allows us to observe people’s financial health the year before the disaster hit and at least four years afterwards. We identify a ZIP code as being impacted by a natural disaster if at least one household in the ZIP code applied for IHP assistance.2 However, our analysis is restricted to ZIP codes where at least 20% of households in the ZIP code were assessed as having damage under the IHP program; this focuses the analysis on places where a meaningful share of residents was impacted by the natural disaster.3
To explore differences in results by disaster size we look at the effects of disasters separately for three groups of disasters. The first group includes only Hurricane Sandy. Because this disaster is by far the largest in the study period, as measured by total assessed damage, we consider it separately. The next group, which we label “large” disasters, includes those disasters for which FEMA assessed $200 million or more in damage under the IHP. The final group, labeled “medium-sized” disasters, includes disasters with less than $200 million in assessed damage under IHP that were nevertheless large enough to trigger FEMA IHP assistance.
shows the disasters included in each group. These disasters occurred in regions across the United States, including the Southeast, Midwest, West, and Gulf Coast. Hurricanes, tropical storms, and severe storms are the most common types of disasters included, but tornadoes and flood events are also represented. also displays which disasters received CDBG-DR funding. Each large disaster spurred a federal appropriation that included CDBG-DR. Only three of the nine regions affected by medium-sized disasters received CDBG-DR funding for recovery.4
Table 1. Characteristics of disasters included in our analysis sample.
expands on to show total assessed damage to owner-occupied housing for each disaster, the number of affected ZIP codes we observe in our sample, and the total individuals we observe in affected ZIP codes. Our figures for total assessed damage to owner-occupied housing are drawn from FEMA assessments under the IHP program. Our sample includes disasters with damage to owner-occupied housing that ranged from around $3.3 million (West Virginia Severe Storms, Flooding, Mudslides, and Landslides) to $2.2 billion (Hurricane Sandy). Most people in our sample for medium-sized disasters were affected by the severe storms and flooding in Michigan in 2014. Our analysis of medium-sized disasters is therefore weighted heavily by the experiences of people in the affected ZIP codes in the Detroit metropolitan area. Like the majority of the areas affected by medium-sized disasters, Michigan did not receive special congressional appropriations for additional recovery funds.
Table 2. Size and scope of disasters included in our analysis.
Table 3. Definitions of financial health outcomes.
Note, finally, that there are some additional differences across these groups on observed aspects of disasters other than their overall magnitude. Hurricanes, which are summer and fall events, are confined to the large disaster group, while the medium group includes a range of spring and summer storm and flood events. Medium-sized disasters in our set also are observed across a wider range of years and somewhat more dispersed geographies.
Credit Bureau Data
The credit bureau data are from a nationally representative longitudinal sample of anonymized data on more than 5 million U.S. consumers obtained from one of the three major credit bureaus.5 These data are available at annual intervals (August of each year) from 2010 through 2017. Geographic information on the ZIP code people live in, combined with FEMA data on ZIP codes impacted by natural disasters, allow us to identify people living in an area hit by a natural disaster. A caveat is that because we only observe people in August of each year, we must make an assumption about where people are living when a disaster occurs, for those disasters that do not occur in August (which are most disasters). We identify people’s location based on where they lived in the August before the disaster. For example, if a hurricane struck 50 ZIP codes in October 2012, we assume that the people living in those ZIP codes in October 2012 are the same people who were living there in August 2012.
With data on the same people over time, we observe people’s pre- and post-disaster financial health, even if they move out of the disaster impacted area. The credit bureau data have an array of information on consumers’ credit profiles, including the type and amount of debt as well as debt that is delinquent. They also show people’s credit scores, which are essentially a composite indicator of overall credit health and are a key factor in determining consumers’ access to and price of credit. Beyond credit-related measures, the data include age, but no other demographic characteristics are available.
We focus on four sets of outcomes: (a) credit score; (b) housing-related strain (mortgage delinquency, foreclosure); (c) financial distress as measured by debt in collections (total and utility); and (d) credit card access and debt (see ). Overall, we hypothesize that natural disasters lead to declines in residents’ financial health. Specifically, we hypothesize that natural disasters reduce credit scores, increase debt levels, and increase rates of delinquency and foreclosure.
shows summary statistics for our credit bureau variables, by disaster group, prior or to the disaster. Across disasters, these indicate an overall sample of affected individuals among whom financial vulnerability is common. The share of people with debt in collections, for example, ranges upward from 30% over these groups. More severe levels of financial distress remain relatively uncommon, however, with 1 to 2% of people recording a foreclosure in the prior two years.
Table 4. Characteristics of people living in areas hit by a natural disaster, by disaster size.
There are also apparent differences across disaster groups, with those affected by medium-sized disasters exhibiting somewhat worse credit characteristics, including lower credit scores and a greater incidence of delinquency. These differences reflect, in large part, the particular economic circumstances of people living in neighborhoods in and around Detroit, Michigan in 2014, who, as noted above, compose the preponderance of all people affected by medium-sized disasters in our data.
A similar issue is reflected in the differences in our sample sizes across groups, shown in the bottom row of . Hurricane Sandy, which affected New York City and surrounding regions, affected more people in our sample than either large or medium-sized disasters, collectively. We also observe more people affected by medium-sized disasters than large disasters. This also appears to be because the Michigan storms in 2014 affected urban areas in and around Detroit.
American Community Survey
We supplement the credit bureau and FEMA data with ZIP code-level demographic and economic characteristics from the ACS. shows mean values (across individuals in the respective disaster group samples) of selected neighborhood characteristics. Consistent with the tabulations of credit bureau data, we see that people in our sample hit by medium-sized disasters live in more disadvantaged areas.
We use ACS ZIP code-level five-year estimates to identify low-income communities (ZIP codes where more than half of all households have incomes less than twice the federal poverty level) and communities of color (ZIP codes where at least half of residents are people of color). We use these indicators to estimate the effects of natural disasters on financial outcomes separately for people living in these communities, in order to investigate whether those effects play out differently across communities with different economic and demographic characteristics.
Methods
We estimate the effects of natural disasters on financial health by comparing financial outcomes of residents in affected areas to financial outcomes of otherwise similar individuals in comparison communities that were not affected by natural disasters.
To do this, we first identify, for each disaster, a set of comparison communities following an approach similar to Groen et al. (Citation2017). We identify comparison communities using propensity score matching to identify the five nearest neighboring ZIP codes for each ZIP code affected by a disaster (where affected ZIP codes are identified, as above, as those where 20% or more of residents applied for FEMA Individual Assistance following the disaster). The comparison set of ZIP codes is drawn from the universe of ZIP codes in our data that were not affected by a natural disaster in any year in our data (2010 to 2017).
We predict propensity scores based on a set of ZIP code-level credit and demographic characteristics. ZIP code-level credit characteristics used in our propensity score calculations include mean credit card debt, mean credit score, and the shares of residents with subprime credit scores (300–600), with a delinquent mortgage, with auto debt, with utility debt in collections, and with a tax lien on their public records. Demographic characteristics include population, and shares of residents that are nonwhite and residents that are low-income (families with income below 200% of the federal poverty level).
To estimate the effects of natural disasters on the financial health of individuals, we then compare financial outcomes, such as credit scores, of individuals residing in affected areas in the year of the disaster with those of otherwise similar individuals in comparison areas. For estimates of the effects of single disasters, such as Hurricane Sandy, the pool of comparison individuals is everyone in the comparison set of ZIP codes for Hurricane Sandy, identified as described above. For estimates of effects pooled across multiple disasters (our set of other large and medium-sized disasters), the pool of comparison individuals is everyone in the pooled set of comparison ZIP codes.
We estimate an average treatment effect on the treated using a propensity score matching model using nearest-neighbor matching. We predict propensity scores using an individual’s age, age squared, and the pre-disaster values of the credit bureau outcome for which we are estimating treatment effects (e.g., when estimating the effects of disasters on credit scores we match on individual credit scores in the year before the disaster). Standard errors account for the fact that propensity scores are estimated (Abadie & Imbens, Citation2016). As noted above, we employ propensity score matching at the individual level in order to compare individuals living in affected areas with similar individuals in unaffected areas as our preferred specification. As a point of comparison and sensitivity check, we can estimate treatment effects using a fixed effects regression model, which generate qualitatively similar results.
Because we cannot identify which residents in affected areas suffered direct financial (or other) losses due to the disaster, this analysis compares all individuals in affected areas to individuals in unaffected areas. As a result, these estimates show the effects of living in affected areas, averaged over directly affected people and other people. This likely leads our estimates to understate the effects of a disaster on those directly affected. On the other hand, natural disasters are intrinsically spatial events in ways that are likely to generate substantial spillovers; even people not suffering property damage, personal injury, or other direct effects might still suffer financially if their communities and local economies are negatively affected by the disaster.
We examine effects separately by disaster group for four years following the disaster and for a set of subgroups defined by individual-level and community-level characteristics:
Disaster Magnitude
We look at the effects of disasters separately for three groups of disasters: (a) Hurricane Sandy, by far the largest disaster in our analysis; (b) other disasters causing over $200 million in damage (large disasters); and (c) disasters with less than $200 million in damage but large enough to trigger FEMA individual assistance (medium-sized disasters). Because public attention and relief tend to flow to the largest disasters, we expect these negative effects to be more pronounced for people in areas affected by medium-sized versus very large disasters. Individuals and communities affected by medium-sized disasters are also, in our data, more financially vulnerable before those disasters, which may magnify the negative effects of disasters on credit outcomes.
Effects Over Time
Our analyses focus on disasters that occurred from 2011 through the summer of 2014, allowing us to observe people’s financial health the year before the disaster hit and for four years afterward (up to 2017). Average treatment effects on the treated are estimated separately for each year post treatment. On the one hand, time may allow people to repair and recover their financial lives. On the other hand, as post-disaster relief tends to be time-limited and because damage to financial health may spiral downward, people affected by a natural disaster may face greater challenges as time passes.
Subgroups
We estimate treatment effects on the treated separately by age and pre-disaster financial health (as captured by people’s credit scores in the year before the disaster). We also estimate effects separately by whether people live in communities of color. We expect those people and communities that face greater pre-disaster economic disadvantage—communities of color, and individuals who are older (elderly) and who have lower levels of pre-disaster financial health—to experience greater negative effects.
Results
Credit Scores
Credit scores are both a composite indicator of residents’ overall financial health and determine access to credit and the price of credit (e.g., the ability to obtain a mortgage or other credit, such as credit cards or an auto loan, and on what terms). Having good credit reduces the cost of borrowing and can save residents hundreds or even thousands of dollars (Elliott & Lowitz, Citation2018). If natural disasters reduce credit scores, a reduction in the score is not only a general indicator of reduced financial health, but it can also be a central mechanism by which natural disasters lead to other harmful financial outcomes.
We find that living in an area affected by a natural disaster leads to significant and persistent reductions in credit scores, on average, compared with otherwise similar people living in unaffected areas. show that the negative effects of disasters are evident in the first year after disasters strike, persist for all four years after the disasters, and tend to grow over time (also see ).
Figure 1. Change by disaster group and year(s) after disaster: Natural disasters lead to declines in credit scores, and these declines increase over time. Notes. Values represent estimates of average differences in credit scores between individuals affected by the indicated disaster (or set of disasters) and matched individuals from unaffected areas. Effects are estimated separately for each disaster for each of the four years following the disaster.
*p < 0.1, **p < 0.05, ***p < 0.01. Source: Authors’ calculations based on credit bureau, FEMA, and ACS data.
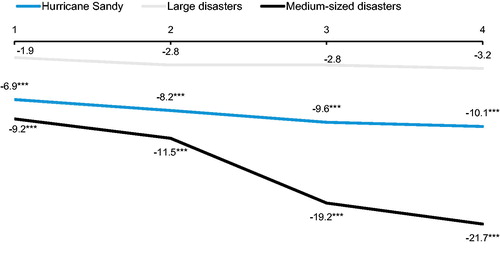
Table 5. Effect of natural disasters on credit score.
We find the largest credit score declines among residents hit by medium-sized disasters (up to 22 points by the fourth year following the disaster), followed by those hit by Hurricane Sandy (10 points in year four). Most individuals affected by the medium-sized disasters were affected by a storm that struck urban areas in and around Detroit. For other large disasters, we see credit score declines that are not as large and are not statistically significant. For this and credit score subgroup analyses, we find effects of large disasters that are generally consistent with but attenuated relative to Hurricane Sandy, but by and large are not statistically significant. Our sample of people affected by large disasters is smaller than Sandy or medium-sized disasters, making our estimates for this group less precise. For this reason, we do not discuss credit score subgroup results for the “large disasters” group.
This pattern of results, showing greater effects of medium-sized disasters than for larger disasters, is consistent with our expectation that residents hit by medium-sized disasters may experience greater financial struggles because these disasters do not receive the influx of federal support that large disasters receive. However, as noted above, people hit by medium-sized disasters in our data differ from those affected by large disasters; in particular, those affected by medium-sized disasters tend to have worse credit outcomes and be from more disadvantaged areas. In subgroup analyses below, we show that the differences in the effects of disasters of different magnitudes persist even when we condition on some of these characteristics.
For both Hurricane Sandy and medium-sized disasters we also see that the negative effects on credit score grow larger over time: the initial effect of Hurricane Sandy is a 7-point decline in scores, but this rises to about 10 points by year three (where it remains in year four). This trend is even more pronounced for medium-sized disasters, where an initial decline of 9 points more than doubles by the third year following the disaster (19 points), and reaches 22 points after four years. In fact, the difference between these two disaster groups only emerges over time. The initial impacts on credit scores are similar, but by the fourth year after the disaster the effects are much larger—more than twice as large—for medium-sized disasters than for Sandy. The resources that flowed into Sandy-affected areas may have helped mitigate the declines. The growth in the magnitude of the effects over the four years after Sandy and the medium-sized disasters is consistent with credit scores exhibiting a degree of path dependency; that is, once individuals’ credit begins to deteriorate due to a disaster, that initial decline leads to further deterioration as they lose access to or face higher costs for traditional credit.
The 22-point decline for residents affected by medium-sized disasters is substantial and could impact people’s ability to access well-priced credit. Credit scores range from 300 to 850, with scores below 650 considered “poor” (includes very poor), scores between 650 and 699 considered “fair,” and scores of 700 and above considered “good” (includes excellent).6 In our data, the average credit score in year four is 647—near the borderline of what is considered fair and poor—for people in our comparison group for medium-sized disasters (). Declines of 22 points for people in this range could make them solidly poor credit risks, which severely constricts their access to traditional credit, can limit their ability to recover from natural disasters, and translates into higher costs if they seek credit from alternative sources.
We also look at declines in credit scores by individual characteristics (pre-disaster credit scores and age) and community characteristics (communities of color).
People with poor credit (credit score below 650) before a disaster occurs experience a substantial decline in credit scores after a disaster, which can have broad impacts for these residents’ financial stability. Four years after being impacted by a medium-sized disaster, we find that that the average credit score fell by 29 points for those with initially poor credit, 17 points for those with fair credit, and 8 points for those with good credit (). In our data, the average credit score in year four is 585 for people in our comparison group for medium-sized disasters with scores below 650 before the disaster (not shown); an effect of 29 points pushes these individuals toward the very poor range of credit scores. For people with fair or good credit before the disaster, the decline is not as sharp.
Table 6. Effect of natural disasters on credit score by pre-disaster credit score groups.
People with poor credit affected by Hurricane Sandy did not experience the same sharp decline in credit score. Four years after Sandy, the average credit score fell by 8 points for those with initially poor credit and by 7 points for those who initially had good or fair credit. Note that this pattern of results, showing larger credit-score declines for medium-sized disasters, even for similar populations (e.g., those with poor credit), is an additional piece of evidence consistent with differences in effects by disaster magnitude being due, at least in part, to differences in policy responses.
Looking at differences in the effects of disasters across age groups (ages 24–34, 35–49, 50–64, and 65 and older), for medium-sized disasters we see negative effects that grow in magnitude over time, with one exception: for those 65 and older, after an initial decline in credit scores of around 9 points, the estimated effects in years two through four are negligible. For medium-sized disasters, we find the largest declines among young adults ages 24–35—a 34-point credit score decline in year four (). By way of contrast, for Hurricane Sandy, we see negative effects on credit scores in each year and for each age group. In fact, we see slightly larger credit score declines after four years for those 65 and older (12 points) than for the other age groups (7 to 10 points). Elderly individuals, who may have fixed or no income, could find it particularly challenging to recover financially from the shock of a natural disaster. Additionally, as qualitative interviews with service providers underscored, the elderly may also be especially susceptible to scams and fraud in the wake of a disaster.
Table 7. Effect of natural disasters on credit score by age groups.
For people affected by medium-sized disasters, we see effects that are larger, and emerge earlier, for people in communities of color than for people in predominantly white communities. The pattern of effects in communities of color is similar to the overall results for medium-sized disasters, but the magnitudes are larger, rising from a 10-point decline in scores in year one to a 31-point decline in year four (). In our data, the average credit score in year four is 646 for people in our comparison group for medium-sized disasters in communities of color; as for the overall estimates, an effect of 31 points in this range could make affected residents solidly poor credit risks. Our estimates for the effects in predominantly white communities are much smaller and are not statistically significant, which is due in part to a relatively small sample size. Specifically, the large majority (roughly 85%) of people affected by medium-sized disasters in our sample live in communities of color, with only 15% living in predominantly white communities. Although we find differences between low- and higher-income communities, the gap is narrower. Four years after a medium-sized disaster, the average credit score fell by 22 points in low-income communities and 9 points in higher-income communities (not shown).
Table 8. Effect of natural disasters on credit score by ZIP code racial and ethnic composition.
For Hurricane Sandy, we also look at effects separately for individuals in communities of color compared with individuals in predominantly white communities, where we find effects that are qualitatively similar between the two groups by year four: The decline in credit scores for individuals in predominantly white communities was 11 points in year four, while for individuals in communities of color the decline was 10 points. Looking at low- and higher-income communities, we find that the average credit score declined by 11 points in year four in higher-income communities, but find no statistically significant decline in low-income communities (not shown).
Mortgage Delinquency and Foreclosures
Homeowners can suffer particular financial impacts following natural disasters, including managing mortgage payments along with necessary repairs and—when their residence is rendered uninhabitable by the disaster—any costs associated with temporary housing. Falling behind on mortgage payments, as indicated by mortgage delinquency, can be an early marker of financial distress for mortgage holders. Experiencing a foreclosure, which typically results from an accumulation of difficulties in staying current, can be an indication of deeper financial distress. Negative effects on these outcomes not only reflect but can amplify the consequences of natural disasters for financial health. People with credit files reflecting delinquent mortgage payments or foreclosures will find other sources of credit to be more expensive or difficult to obtain.
We find increases in mortgage delinquency and foreclosure in the years after a natural disaster that are stronger and more persistent for those affected by Hurricane Sandy than for those affected by medium-sized disasters, as shown in .
Table 9. Effect of natural disasters on mortgage delinquencies (60 days past due) and foreclosures.
For people affected by Sandy, we see sustained increases in both mortgage delinquency (60 days past due) and foreclosures. These effects are relatively large: In years two through four the mortgage delinquency rates are higher by roughly one percentage point, over a comparison group mean that is in the range of 2 to 3% over that same period. The foreclosure rates for people affected by Sandy emerge with a slight lag, becoming positive and significant in year two; this is both consistent with the negative financial effects of the disaster taking time to lead people into foreclosure, in general, and with the relatively long foreclosure timelines observed in New York and New Jersey, in particular. These effects are also large: In years two through four the rate of foreclosure for people affected by Hurricane Sandy is in the range of 0.3 to 0.5 percentage points higher than for comparison people, for whom the mean rate ranges from about 0.3 to 0.6%.
For people affected by large disasters, we see increases in mortgage delinquency in years three and four, but no statistically significant increases in foreclosures. Again, the increases in mortgage delinquency are relatively large: In years three and four the mortgage delinquency rates are higher by roughly 0.8 to 1 percentage point, over a comparison group mean of about 2.5% over that same period.
For medium-sized disasters, we see increases in delinquency in years one and two of about half a percentage point, which fade by year three. We do not see effects on foreclosure rates for this group. Note, here, that because foreclosure processes are determined by state policy and can differ substantially across states, for this set of outcomes in particular the difference in effects between Sandy and the medium-sized disasters may be due to differences in the geography of where these disasters occurred rather than differences having to do with their magnitude. Additionally, the range of disaster-related loss mitigation options for government insured or guaranteed loans may not be available after a midsized disaster.
Our subgroup analyses focus on Hurricane Sandy, as we see less consistent and robust subgroup findings in our analyses of large- and medium-sized disasters.
Looking at effects of Hurricane Sandy by credit score groups, we see foreclosure and delinquency effects that are stronger and more consistently negative for people with poor credit pre-Sandy, but not isolated there. Four years after Hurricane Sandy, we find that that the mortgage delinquency rates are higher by 1.92 percentage points for those with initially poor credit, 0.87 percentage points (although the coefficient is not statistically significant) for those with fair credit, and 0.27 percentage points for those with good credit (). Looking at foreclosures in year four shows foreclosure rates that are higher by 0.78 percentage points for those with initially poor credit and 0.45 percentage points for those with fair credit. The estimated effect is small (0.10) and statistically insignificant from those with good credit.
Table 10. Effect of Hurricane Sandy on mortgage delinquencies and foreclosures by pre-disaster credit score groups.
By age, the effects are strongest for those ages 35 to 49 and 50 to 64 when the hurricane occurred, which is consistent with the age ranges for which we expect people to hold larger amounts of mortgage debt (). Four years after Hurricane Sandy, for example, we find that the mortgage delinquency rates are higher by 1.93 percentage points for those ages 35-49, 0.97 percentage points for those ages 50-64, and 0.87 percentage points for 65 and older. Looking at foreclosures in year four shows foreclosure rates that are more similar across the three age groups—from 0.60 percentage points for those ages 35-49 to 0.46 percentage points for 65 and older.
Table 11. Effect of Hurricane Sandy on mortgage delinquencies and foreclosures by age groups.
Table 12. Effect of natural disasters on mortgage delinquencies and foreclosures by ZIP code racial and ethnic composition.
The effect of Hurricane Sandy on mortgage delinquencies is substantially higher for people living in communities of color compared to majority-white communities (see ). For people in communities of color, mortgage delinquencies rose by 0.88 percentage points in year one to 2.41 percentage points in year four. In majority-white communities, the increases were between 0.77 and 0.52 percentage points in years two through four (there is no statistically significant increase in year one). The effects on foreclosures are more similar for people affected by Sandy in majority-white communities and communities of color. For example, four years after Hurricane Sandy, foreclosure rates are higher by 0.49 percentage points for those in communities of color and 0.36 percentage points for those in majority-white communities.
Debt in Collections
The financial activities and measures recorded by credit agencies provide a nuanced picture of how people are affected by and respond to natural disasters. To examine the extent to which natural disasters lead people to experience financial distress, we examine two measures of debt in collections—an indicator of having the debt and the dollar amount—for both all debt collections and utility debt in collections. Having debt in collections is suggestive of people suffering from cash flow challenges that lead them to fall behind on their obligations. Accruing debt in collections can, in turn, lead to further financial challenges.
We find evidence that living in an area affected by a natural disaster leads to increases in debt in collections in the years following a disaster, although this effect is most pronounced for those affected by medium-sized disasters.
Focusing first on total debt in collections, our results do not indicate increases in total debt in collections for people affected by Hurricane Sandy and large hurricanes. For medium-sized disasters, however, we see strong and persistent negative effects. Focusing on medium-sized disasters, the share of people with any debt in collections is 5 percentage points higher in the first year after the disaster, and the effect rises to 10 percentage points by year four (). These effects are substantial; the share with debt in collections is nearly 25% higher by year four than for comparable people not hit by a disaster. The average amount of debt in collections is $1,420 higher in year one, and this rises to $2,014 in year four. This is also a correspondingly large effect; the comparison group mean amount of debt in collections in year four is about $2,700.
Table 13. Effect of natural disasters on debt in collections.
We also look at the effects of disasters on utility debt in collections. Again, we find the largest effects for people affected by medium-sized disasters. For example, the fraction of people with any utility debt in collections is 2 percentage points higher in the first year after the (medium-sized) disaster and the effect rises to 10 percentage points by year four (). Because the measure is narrower, the amounts represented are correspondingly smaller: The average amount of utility debt in collections is $32 higher in year one and the difference rises to $158 in year four. The average amount of utility debt in collections increased after Hurricane Sandy, but to a lesser extent; it was $15 higher in year one with the difference rising to $27 in year four.
When we look at effects for debt in collections by credit score group, we see differences across the groups (). While there is a significant rise in the likelihood of having debt in collections in each of the three credit score groups (poor, fair, and good), the increases are larger for those in the poor credit score group. Also, while we find evidence that the amounts of debt in collection rises for people with a poor or fair credit score before the disaster, we do not find this to be the case for those with good credit before the disaster.
Table 14. Effect of natural disasters on debt in collections by pre-disaster credit score groups.
Credit Card Access and Debt
Credit cards can serve as an important source of liquidity for people during and after a natural disaster, though accumulating credit card debt can reflect financial challenges. We look at the effect of disasters both on whether people have a credit card, which we interpret as indicative of access to credit, and credit card balance, which we interpret to reflect a gap between cash resources and needs.7 Note that rising levels of credit card debt can also lead to other financial challenges, both directly, as people need to stay current on at least minimum payments and interest charges that accumulate, as well as indirectly, as rising balances can cause credit scores to decline if people utilize more than 30% of their available credit (Elliott & Lowitz, Citation2018).
The results suggest that natural disasters affect credit card access and debt for people affected by medium-sized disasters, but we find little to no evidence of an effect for Hurricane Sandy and other large disasters (). For those impacted by medium-sized disasters, the likelihood of having a credit card falls steadily over time—from 3.9 percentage points in the year following the disaster to 6.5 percentage points in year four. The average amount of credit card debt, on the other hand, increases in the three years following the disaster (by between $206 and $263).
Table 15. Effect of natural disasters on having a credit card and credit card balance.
The picture differs depending on people’s pre-disaster credit score. Focusing on medium-sized disasters, the likelihood of having a credit card falls by 4.5 to 8.6 percentage points for those with poor credit before the disaster, and the average amount of credit card debt trickles downward over time (). By the fourth year after the disaster, this poor credit group has less credit card debt on average than comparable people not affected by a disaster. In contrast, for those with good credit before the disaster, the likelihood of having a credit card rises, by 2.4 to 3.9 percentage points in years two through four. The amount of credit card debt they carry is higher by approximately $900 in the first two years following the disaster and higher by about $700 in years three and four. These smaller and only marginally significant effects in years three and four are consistent with some degree of recovery for this group.
Table 16. Effect of natural disasters on having a credit card and credit card balance by pre-disaster credit score groups.
For the middle group—those with fair credit before the disaster—we see an intermediate pattern. There is a positive but insignificant effect on the likelihood of having a credit card in the years following a disaster, as well as positive effects on the level of credit card debt, that are large and statistically significant in the second and third years after the disaster.
We interpret this pattern of results as consistent with more at-risk borrowers losing access to credit cards following disasters (possibly due to other disaster-induced deteriorations in their capacity to borrow, consistent with, for example, the reductions we see in credit scores for this group), while higher credit-score borrowers use credit cards as a source of liquidity following disasters.
Robustness Checks
While the two-stage matching procedure discussed above is our preferred specification for estimating and presenting the effects of natural disasters on credit and debt outcomes, we can also examine these effects under alternative model specifications. In particular, to check the sensitivity of our results to the method of estimation, we can also estimate the effects of natural disasters using a panel regression framework for estimating treatment effects in the second stage, following more closely the empirical methods employed in Deryugina et al. (Citation2018), for example. This estimation framework exploits the longitudinal nature of our data and allows for the introduction of individual-level fixed effects, but imposes more structure on the data in estimating treatment effects. In general, we find results using this method that are qualitatively similar to results presented above.
reports the results of a set of panel regressions estimating the year-by-year treatment effects associated with living in areas affected by Hurricane Sandy, for a subset of the credit and debt outcomes reported above, allowing for direct comparisons with our matching estimates. The coefficients on the interaction terms for the first four post-Sandy years (‘Sandy, t + 1’ through ‘Sandy, t + 4’) correspond to the “years after disaster” (one through four) above. Comparing the coefficients for credit score in with the results reported for Sandy above in shows results that are qualitatively similar though quantitatively somewhat weaker. Using the panel regression, we see estimated effects that are null in the first year following the disaster grow to a significant decline of about 2.5 points by the fourth year after the disaster; the corresponding estimates using propensity score matching showed a decline of about 7 points in year one growing to a decline of about 10 points in year four. Thus, while the magnitudes of the estimated effects are somewhat smaller, they still show both statistically significant negative effects of the disaster on credit scores and the same worsening trend over this period of years following the hurricane. Note that in the panel regression model reported below, we also use the full complement of years of data available in examining the single disaster (which in the case of Sandy provides one additional post-disaster year of data), and the estimated effect in year five is larger still, providing additional, consistent evidence of this pattern over time.
Table 17. Effect of Hurricane Sandy on selected credit and debt outcomes, regression model.
Another feature of the panel estimation is that it allows for the introduction of year-treatment indicators for the pre-disaster years, which provides an empirical indication of differences in the areas affected by Hurricane Sandy and the matched comparison areas; if the match were perfect, these coefficients should be precisely estimated null values. The small, positive, significant values shown here both indicate some degree of imperfection in the first-stage match, and the sign shows that individuals in areas affected by Sandy were in fact doing slightly better on this measure prior to the storm. This would tend to contribute to the somewhat smaller point estimates for the effects shown here compared with the matching estimates; it also suggests the potential for gains in precision from the second stage match.
The other coefficients in the credit score regression in are also consistent with the matching results in . The upward trend in the comparison group means noted in is picked up in the regression by the year indicators, which show an upward trend over this period. The coefficient on the constant in this regression can be interpreted as the comparison group mean in the excluded year (2012), which helps to anchor the levels.
The other columns in can be interpreted similarly. They correspond to the matching estimates reported for those outcomes for Hurricane Sandy in analogous ways, and report generally consistent findings. The mortgage delinquency and foreclosure estimates correspond to the results reported in . Note that the point estimates of the effects of Sandy on both the share of people with delinquent mortgages as well as the share with foreclosures are somewhat larger in absolute magnitude in the panel regression. The debt in collections columns in correspond to the results reported above in . While little effects emerge on the propensity to have debt in collections in either model, the effects on the amount of debt in collections are larger and statistically significant in the regression framework, rising to about $500 in year four, while they are not statistically significant in the matching model. The point estimates for utility debt are quite similar across the models. Finally, for credit card debt, the results reported in broadly mirror those reported in , with both approaches showing some modest increases emerging in year four. Overall, the consistency in the pattern of results between the matching estimates and the panel regression estimates suggests our findings are not highly sensitive to model specification.
Conclusion
These results provide evidence that natural disasters lead to declines in credit scores and mortgage performance, and that the effects persist or even worsen over time. Additionally, for people who are more economically vulnerable before disasters occur (with lower credit scores, or live in a community of color), the estimated declines in credit score are particularly substantial. We also find evidence of higher rates of mortgage delinquency and foreclosure for people with poor credit (versus good credit) and those who live in communities of color (versus majority-white communities). Beyond credit score and mortgage performance, we find evidence that natural disasters lead to increases in debt in collection and affect both credit access and debt, although these results are more pronounced in medium-sized disasters. Again, we find worse outcomes for people with lower credit scores before the disaster occurred. Given the role that credit scores play in access to credit and the price of credit (including mortgages), and the role of successful homeownership in building family wealth, this pattern of results suggests that disasters may be not only harmful for affected residents on average, but may also have the effect of widening already existing inequalities.
Our findings provide insight into strategies to promote resilience and recovery for multiple actors.8 Three of these strategies link to our overarching findings (i.e., persistent negative effects and subpopulations most impacted), with the other two more directly targeted at our credit score and mortgage performance findings.
Post-disaster programs and resources should consider households’ long-term financial recovery, in addition to more immediate relief and repairs. We find that the negative effects of disasters persist, and even grow, over time. This suggests that residents in these communities need ongoing, longer-term assistance. At the federal level, one option is to extend the period of temporary assistance (e.g., more frequent and streamlined approvals for requests to extend temporary shelter assistance beyond the current 18 months). All federally-supported supplemental relief and recovery programs, such as disaster-related utility assistance, could also be more targeted and extended. Additionally, federal agencies could consider relaxing or extending application deadlines (e.g., allowing people more than the current 30 days to apply for disaster unemployment assistance) to accommodate the needs of households that have just experienced the trauma of a disaster and are confused by their assistance and rebuilding options.
More consistent financial services that comprehensively address households’ conditions and options should be offered after all disasters. Financial stability should also be in the foreground of disaster management reform. Current aid focuses almost exclusively on property repair and rebuilding, and not on the underlying financial damage to consumers. Further, there is typically a patchwork of unaligned supports after disasters, particularly after events that do not reach the level of public attention and governmental funding, but are just as impactful for the affected households. Given the complexity of the paperwork and filing for assistance, federal and state governments should redefine and clarify the scales of long-term aid beyond current short-term aid caps. They could also prioritize information channels and accessible application processes for people in economically vulnerable communities to apply and qualify for assistance. Simultaneously, local nonprofits, financial institutions, and mortgage holders (e.g., Fannie Mae) could align counseling, debt services, and other supports with newly transparent and pre-defined public aid. Private institutions, which are also a source of households’ financial information, could also be enlisted as helpful navigators.
A larger share of recovery resources should be aimed at communities struggling before the disaster occurs. Physical property mitigation, hazard property insurance and health insurance, and other preventive measures are proven strategies for reducing costs to all parties after a disaster (Multihazard Mitigation Council, Citation2018). Financial “mitigation” activities should be encouraged and supported, starting with a reconsideration of activities that are currently eligible for public hazard mitigation resources. Traditional private and civil sector financial planning resources could also be harnessed for disaster preparation. Counseling that integrates property and rental insurance guidance, or seeded “rainy day” savings programs for lower-income households, are examples of supports that could be channeled for the ever-present risk of disasters.
Consideration should be given to rules and guidance around how natural disasters and subsequent delinquencies are identified on consumers’ credit reports and incorporated into credit scores. A Consumer Financial Protection Bureau (CFPB) report (Banko-Ferran & Ricks, Citation2018) shows that a natural disaster flag stays on a consumer’s credit report for an average of only two months—yet our findings suggest that the effects of natural disasters last years. The CFPB report also finds that many disaster-affected consumers never receive a natural disaster flag, and if they do, it is often only associated with some elements of the credit report (e.g., mortgage, but not credit cards).9 This natural disaster flag signifies that late payments are not reflective of the consumer’s true credit risk (i.e., that non-payment is due to extenuating circumstances). Our credit score findings, which provide evidence of steady credit score declines over time, are consistent with path dependency in credit scores (i.e., initial declines in credit scores lead to further deterioration). If early recognition of such extenuating circumstances as natural disasters can help consumers in the long run, then a careful review of the use and non-use of the natural disaster flag is warranted. Further, regulatory efforts should build in research on how credit scoring companies, creditors, and others are using the disaster code in their modeling and decision-making.
Mortgage lenders and government-sponsored enterprises should update existing mortgage delinquency and foreclosure policies to account for long-term financial burdens following disasters, and apply them in a consistent and transparent manner. Current policies provide short-term foreclosure moratoria, forbearance plans, and loan modifications following disasters. After Hurricane Sandy, mortgage delinquency and foreclosures increased significantly in the second, third, and fourth years following a disaster, suggesting that homeowners affected by disasters need assistance for many years. Homeowners may not risk mortgage delinquency until they have already drawn down existing savings. One option is to extend existing moratoria and forbearance periods, as well the availability of disaster-related loss loan modifications (accompanied by oversight to ensure compliance with governing rules). Another option is better assistance navigating the disaster aid application process. In 2018, Fannie Mae began offering disaster case management to help affected homeowners with Fannie Mae-owned mortgages navigate the process of applying for assistance. Some state and local governments have hosted post-disaster info fairs to connect consumers to relevant mortgage company representatives in order to provide information on the process for receiving relief (which varies by owner of the debt), but these programs tend to be short-lived.
Ultimately, there are a number of strategies that hold promise for increasing resilience and improving residents’ financial health following a natural disaster. These strategies range from expanding disaster preparedness and financial planning before disaster strikes, to improvements in targeted assistance for households’ financial rebuilding, to the coordination of services between public, private, and civil providers. Together, they highlight the importance of involvement of many actors: individuals and families; state and local governments; community organizations; national nonprofits and philanthropic entities; private sector organizations; and federal policies and agencies. Alignment across these actors would strengthen recovery and resilience efforts, and thereby help to lessen the negative effects of natural disasters on residents’ financial health.
Disclaimer
This article is the result of independent research on which Caroline Ratcliffe, Senior Economist at the Consumer Financial Protection Bureau, collaborated at the Urban Institute. It does not necessarily represent the views of the Consumer Financial Protection Bureau or the United States. William J. Congdon is a Principal Research Associate at the Urban Institute. Alexandra Stanczyk is a Researcher at Mathematica. Daniel Teles is a Research Associate at the Urban Institute. Carlos MartÃ-n is a Senior Fellow at the Urban Institute. This research was funded by a grant from JPMorgan Chase to the Urban Institute. Funders do not determine research findings or the insights and recommendations of Urban Institute research. Further information on the Urban Institutes funding principles is available at www.urban.org/support. The views expressed are those of only the authors.
Acknowledgments
We are grateful to participants at the Association for Public Policy Analysis and Management Fall 2019 Research Conference and Urban Institute seminar participants for helpful comments. We also thank Courtney Jones and Signe-Mary McKernan for helpful suggestions and Bapuchandra Kotapati for excellent research assistance.
Notes
Additional information
Funding
Notes
1 Data are available for download here: https://www.fema.gov/media-library/assets/documents/34758.
2 The sample of disasters thus invariably includes those for which FEMA’s IA programs were triggered and offered.
3 Estimates of the number of households in each ZIP code come from the American Community Survey.
4 No wildfires or disasters in West Coast states met the study inclusion criteria—primarily because the largest fires have occurred more recently, so we are not yet able to estimate effects over the four-year follow-up period.
5 This represents a 2% random probability sample from the credit bureau.
6 See Experian. (n.d.). What is a good credit score? Experian. Retrieved February 7, 2019. https://www.experian.com/blogs/ask-experian/credit-education/score-basics/what-is-a-good-credit-score/.
7 Our data capture credit card balances at a point in time, some of which will be paid off when people’s payments are due. We nonetheless refer to this as credit card debt because it is the value of the amount outstanding at a point in time.
8 These strategies are informed by a set of interviews we conducted with experts in the field in January and February 2019. These interviews gathered perspectives from national organizations with expertise in regulations or working with local governments; organizations involved in planning and executing community-level responses to natural disasters; and local organizations in areas recently affected by natural disasters with experience collecting and harnessing local-level data to assist in recovery.
9 For more detail, see National Consumer Law Center. (n.d.). Letter urging credit bureaus to provide credit reporting relief to consumers affected by natural disasters. National Consumer Law Center. Retrieved February 12, 2019. https://www.nclc.org/images/pdf/credit_reports/ltr-credit-reporting-natural-disaster.pdf.
References
- Abadie, A., & Imbens, G. W. (2016). Matching on the estimated propensity score. Econometrica 84(2), 781–807.
- Banko-Ferran, D., & Ricks, J. (2018). Quarterly consumer credit trends: Natural disasters and credit reporting. Bureau of Consumer Financial Protection.
- Board of Governors of the Federal Reserve System. (2020). Report on the economic well-being of U.S. households in 2019, featuring supplemental data from April 2020. Federal Reserve Board.
- Deryugina, T., Kawano, L., & Levitt, S. (2018). The economic impact of Hurricane Katrina on its victims: Evidence from individual tax returns. American Economic Journal: Applied Economics, 10(2), 202–33.
- Edmiston, K. D. (2017). Financial vulnerability and personal finance outcomes of natural disasters (Research Working Paper RWP 17-9). Federal Reserve Bank of Kansas City.
- Elliott, D., & Lowitz, R. G. (2018). What Is the cost of poor credit? Washington, DC: Urban Institute. https://www.urban.org/sites/default/files/publication/99021/what_is_the_cost_of_poor_credit_1.pdf.
- Farrell, D., & Greig, F. (2018). Weathering the storm: The financial impacts of Hurricanes Harvey and Irma on one million households. JPMorgan Chase Institute.
- Fussell, E., & Harris, E. (2014). Homeownership and housing displacement after Hurricane Katrina among low‐income African‐American mothers in New Orleans. Social Science Quarterly, 95(4), 1086–1100.
- Gallagher, J., & Hartley, D. (2017). Household finance after a natural disaster: The case of Hurricane Katrina. American Economic Journal: Economic Policy, 9(3), 199–228
- Groen, J., Kutzbach, M., & Polivka, A. (2017). Storms and jobs: The effect of hurricanes on individuals’ employment and earnings over the long term. U.S. Department of Labor, Bureau of Labor Statistics.
- Guimaraes, P., Hefner, F. L., & Woodward, D. P. (1993). Wealth and income effects of natural disasters: An econometric analysis of Hurricane Hugo. The Review of Regional Studies, 23(2), 97.
- Howell, J., & Elliott, J. R. (2018). As disaster costs rise, so does inequality. Socius, 4,
- Joint Center for Housing Studies of Harvard University. (2019). The state of the nation’s housing. Harvard University.
- Kaul, K., & Goodman, L. (2017, September 22). The mortgage industry needs a modernized disaster recovery toolkit (Urban wire: Housing and housing finance [Blog]). Urban Institute. https://www.urban.org/urban-wire/mortgage-industry-needs-modernized-disaster-recovery-toolkit.
- Kousky, C., & Cooke, R. (2012). Explaining the failure to insure catastrophic risks. The Geneva Papers on Risk and Insurance-Issues and Practice, 37(2), 206–27.
- Martín, C. (2019). Understanding housing data from the 2017 disaster season. Natural Hazards Review, 20(3).(ASCE)NH.1527-6996.0000331
- Martín, C., Gilbert, B., Theodos, B., & Teles, D. (Forthcoming). Housing recovery and CDBG-DR: A review of the timing and factors associated with housing activities in HUD’s Community Development Block Grant for Disaster Recovery Program. Urban Institute.
- McKernan, S.-M., Ratcliffe, C., Braga, B., & Kalish, E. (2016). Thriving residents, thriving cities. Urban Institute.
- Multihazard Mitigation Council. (2018). Natural hazard mitigation saves: 2018 interim report. National Institute of Building Sciences.
- National Oceanic and Atmospheric Administration (NOAA). (2020). U.S. billion-dollar weather and climate disasters. National Centers for Environmental Information, U.S. Department of Commerce.
- Roth Tran, B., & Sheldon, T. L. (2017). Same storm, different disasters: Consumer credit access, income inequality, and natural disaster recovery. SSRN. https://ssrn.com/abstract=3380649 or http://dx.doi.org/10.2139/ssrn.3380649
- Rudowitz, R., Rowland, D., & Shartzer, A. (2006). Health care in New Orleans before and after Hurricane Katrina. Health Affairs, 25(5), 393–406.
- U.S. Department of Housing and Urban Development (HUD). (2016). 2016 CDBG-DR webinar series training materials. U.S. Department of Housing and Urban Development. https://www.hudexchange.info/news/2016-cdbg-dr-webinar-series/
- Zhang, Y., & Peacock, W. G. (2009). Planning for housing recovery? Lessons learned from Hurricane Andrew. Journal of the American Planning Association, 76, 5–24.