
 ?Mathematical formulae have been encoded as MathML and are displayed in this HTML version using MathJax in order to improve their display. Uncheck the box to turn MathJax off. This feature requires Javascript. Click on a formula to zoom.
ABSTRACT
This work considers Phase I cancer dual-agent dose-escalation clinical trials in which one of the compounds is an immunotherapy. The distinguishing feature of trials considered is that the dose of one agent, referred to as a standard of care, is fixed and another agent is dose-escalated. Conventionally, the goal of a Phase I trial is to find the maximum tolerated combination (MTC). However, in trials involving an immunotherapy, it is also essential to test whether a difference in toxicities associated with the MTC and the standard of care alone is present. This information can give useful insights about the interaction of the compounds and can provide a quantification of the additional toxicity burden and therapeutic index. We show that both, testing for difference between toxicity risks and selecting MTC can be achieved using a Bayesian model-based dose-escalation design with two modifications. Firstly, the standard of care administrated alone is included in the trial as a control arm and each patient is randomized between the control arm and one of the combinations selected by a model-based design. Secondly, a flexible model is used to allow for toxicities at the MTC and the control arm to be modeled directly. We compare the performance of two-parameter and four-parameter logistic models with and without randomization to a current standard of such trials: a one-parameter model. It is found that at the cost of a small reduction in the proportion of correct selections in some scenarios, randomization provides a significant improvement in the ability to test for a difference in the toxicity risks. It also allows a better fitting of the combination-toxicity curve that leads to more reliable recommendations of the combination(s) to be studied in subsequent phases.
1. Introduction
1.1. Background
Immunotherapies have been shown to have strong antitumor activity and better safety profile than cytotoxic cancer therapies (Disis, Citation2010; Kyi and Postow, Citation2014). It was also found that a therapeutic effect of immunotherapy can be noticeably improved by combining it with a backbone chemotherapy or other targeted agents (Sharma and Allison, Citation2015). Therefore, there are many Phase I combination trials investigating either (i) the added value of an immune checkpoint blocker to a backbone therapy or (ii) the added value of a new agent to an immune checkpoint blocker (Pardoll, Citation2012). In both cases, one agent, called a standard of care (SoC), is administered at a fixed dose and another agent is dose escalated. Such setting allows reducing the combination context to the context of a single agent trial. However, the application of well-established single agent designs can hide potential difficulties and might fail to address the needs specific to the combination trial.
For decades, the main paradigm of cancer dose-escalation trials was “the more the better” – an agent has greater activity but greater toxicity as dose increases. Relying on this assumption of monotonically increasing toxicities, the identification of the maximum tolerated dose (MTD), the key objective of a single agent Phase I trial, can be efficiently achieved without characterizing the true dose-toxicity relationship (O’Quigley and Shen, Citation1996). While the monotonicity assumption holds for cytotoxic agents (e.g. chemotherapy and radiotherapy), it can be violated for molecularly targeted agents (MTA), for example, an immunotherapy. Specifically, the majority of Phase I trials of immune-checkpoint protein blockers, such as anti-programmed-death-receptor-1 (PD1), have never actually reached the MTD (see, e.g. Patnaik et al., Citation2015; Robert et al., Citation2014; Yamamoto et al., Citation2017). Consequently, when considering combination trials involving an immunotherapy, the information beyond the conventional (and only) objective of Phase I studies, to find the maximum tolerated combination (MTC), can be also crucial for a more accurate choice of the combination(s) to be studied in subsequent phases.
In this communication, we focus on the setting that covers two important types of clinical trials with the following scientific questions added to the MTC selection:
The SoC, a cytotoxic agent, is given at the full single agent dose and an immune-checkpoint blocker is dose escalated.
A clinician would tolerate only a slight increase in toxicity,
, over the toxicity of the SoC (Paller et al., Citation2014). Then, the question “is the increase in toxicity acceptable?” should be tested.
The SoC is MTA and is given at the full single agent dose and another agent (either a cytotoxic agent or an MTA) is dose escalated.
A clinician would like to test whether there is a plateau region (defined by not exceeding the difference in associated toxicities by more than
A clinician has an expectation of additional toxicity,
The primary objective of these trials is to find the MTC. The secondary objectives are to quantify the expected difference between single and combination treatments and to determine the shape of the combination-toxicity relationship. We show that standard single agent dose-escalation methods currently used for such trials may fail to address the secondary questions of interest.
To achieve all objectives, we propose two modifications that are commonly used outside of oncology dose-escalation trials to a Bayesian model-based design. We propose to include the SoC given alone as a control arm in Phase I clinical trial and, to randomize each patient to the control arm or to one of the combinations selected by a Bayesian model-based design. We demonstrate that such randomization procedure allows for a reliable statistical evaluation of additional toxicity (added over the SoC) and of general interaction effects between compounds (Hellmann et al., Citation2017). We also show that the Emax model provides a well-established tool to detect and to evaluate different patterns in a dose-toxicity relation and its parameters match directly the information needed to address all stated objectives.
It is important to mention that the majority of recently proposed dual agent combination dose-escalation designs allow both agents to be dose-escalated (see, e.g. Ivanova and Wang, Citation2004; Lin and Yin, Citation2017; Wages et al., Citation2011; Yin and Yuan, Citation2009) However, in the considered types of trials, one can benefit from the fact that the dose of one agent is fixed and it is, in fact, a unidimensional MTC search. Therefore, the proposals of this work are built upon the single-agent model-based approaches.
The remainder of the manuscript proceeds as follows. In Section 1.2, we present two motivating examples. In Section 2, the Bayesian model-based approach and the Emax model are described together with the proposed randomization scheme. In Section 3, operating characteristics of the proposed design are compared to currently used dose-escalation designs in various scenarios. In Section 4, the problem of fitting the four-parameter model and the impact of the randomization ratio are investigated. The paper concludes with a discussion in Section 5.
1.2. Motivating trials
This work is motivated by two recent combination trials that could potentially benefit from the implementation of the proposed design.
1.2.1. Backbone chemotherapy and increasing doses of immunotherapy
Gemcitabine is the standard chemotherapy for advanced pancreatic cancer (Aglietta et al., Citation2014) which has a narrow therapeutic index (Crane et al., Citation2002). Tremelimumab is a fully humanized monoclonal antibody that may allow and potentiate effective immune responses against tumor cells. In several clinical studies, anti-CTLA4 agents have been shown to induce durable tumor responses through modulation of the immune system in patients with metastatic melanoma. The hypothesis was that the combination of the two agents “might provide synergistic antitumor activity without increasing toxicity” (Aglietta et al., Citation2014). Gemcitabine 1000 mg/m2 was administered in all patients while escalating doses of tremelimumab (6, 10, or 15 mg/kg) were sequentially tested to identify the MTC. This trial was conducted using the 3 + 3 design, leading to a high risk of erroneous conclusions (Reiner et al., Citation1999) due to the assumption of increasing dose-toxicity relationship. Furthermore, as the expected risk of the dose-limiting toxicity with Gemcitabine is more than 20%, any (if the dose-response curve is flat) or no combination (if the dose-response curve is steep) can be the MTC. Finally, the highest combination was recommended for further investigations, but the question whether the toxicity of the MTC is actually increased compared to Gemcitabine given at 1000 mg/m2 was never formally tested.
1.2.2. Fixed immunotherapy and increasing doses of standard treatment
Sorafenib is a standard treatment for advanced cellular cell carcinoma. However, its efficacy remains limited as the time to progression is around six months. Despite this agent being prescribed at the MTD, its therapeutic index makes it possible to reduce the dose in case of adverse reactions (Wilhelm et al., Citation2006). SPLASH is a dose-escalation study of the safety of Avelumab in combination with sorafenib in patients with advanced cellular cell carcinoma that is about to be initiated at Gustave Roussy. While Avelumab will be given at a fixed dose, Sorafenib will be escalated from 200 mg/kg up to 800 mg/kg that is the MTD when administered as a single agent. Dose escalation will be driven by safety using the Bayesian Continual Reassessment Method (O’Quigley et al., Citation1990, CRM). The MTC is defined as the highest tested combination associated closest to 25% probability of causing a dose-limiting toxicity during cycle 1. The expected rate of toxicity with Avelumab alone is 8%.
2. Methods
2.1. Setting
Consider a clinical trial in which combinations of agents and
are studied. The drug
is a standard of care (SoC) given at a fixed dose,
, and
is dose escalated. We specify increasing doses of
:
. Then,
are
combinations available in the trial, where
corresponds to the agent
given as a single agent and is subsequently referred to as the control arm and the combinations
are referred to as the investigational arm. An investigator observes binary outcomes of a random variable
,
if no toxicity is observed and
, otherwise. Let
be the probability for a patient to experience a toxicity given the combination
. It is assumed that toxicity is a nondecreasing function of combination,
and a reliable prior information for the toxicity probability of the control arm,
, is available.
Let be the maximum acceptable toxicity probability. The primary goal of the dose-escalation clinical trial is to find the MTC
such that
using estimated toxicity probabilities . The secondary goal, specific to the combination trials, is to test if the difference of toxicity probabilities associated with the estimated MTC and the SoC is as expected. To unify notation, we study the extra toxicity (ET) defined in terms of the expected difference in toxicity,
, between the MTC and the SoC. One would conclude the ET when the probability that the difference in the two toxicity risks exceeds
is larger than some level
given observed data. Formally, if
where
is the vector of outcomes observed in a trial and the probability is found with respect to the posterior probability distribution, then the ET is concluded. However, the observed outcomes of the trial are random, and one would like to be sure that this difference can be found regardless these outcomes. Therefore, if the ET is present one would like the probability
to be equal to 1. In contrast, if there is no ET, the probability (1) is desired to be equal to 0.
2.2. Bayesian model-based design
In the considered type of trials, one compound is escalated while another one is kept fixed. Therefore, the underlying combinations can be considered as doses in a single agent trial and corresponding dose-escalation designs can be adapted. Particularly, we use the Bayesian continual reassessment method (O’Quigley et al., Citation1990, CRM) in this work.
Assume that the toxicity probability has the functional form
where is a
-dimensional vector of parameters,
is a real coordinate h-dimensional space and
is a scalar unit-less combination level (also referred to as a standardized level) corresponding to the same toxicity probability as combination
. The latter adjustment is needed to adapt the two-dimensional combination to the single-agent context.
Denote prior distributions of by
. Assume that
patients have been already assigned to doses
and binary responses
were observed, respectively. The CRM updates the posterior distribution of
using Bayes’s Theorem
where
Then, the posterior mean of the toxicity probability for combination after
patients is equal to
The combination that minimizes
among all is recommended for the next group of patients. The procedure is repeated until the maximum number of patients,
, has been treated. While it was shown that the CRM is able to select the MTC with a high probability, it is not designed to account for the specific of the combination trial. Therefore, we propose the following modifications.
2.3. Randomization between control and investigational arms
Patients in dose-escalation trials are assigned cohort-by-cohort, where a cohort is a small group of typically 1–4 patients. By minimizing the criterion (4), the CRM design tends to assign the majority of patients in the neighborhood of the MTC. This leads to a sparse allocation of patients on other combinations and on the control arm. This will make it difficult to test for the difference in toxicity risks associated with the estimated MTC and the control arm. Following applications outside of oncology, we introduce the following randomization procedure between the investigational (combinations) and control (SoC) arms.
Denote the cohort size by and let
be the number of patients in cohort assigned to the estimated MTC (according to criterion (4) by the CRM) and
be the number of patients in cohort assigned to the control arm,
. This results in at least
patients on the control arm and at most
on the investigational arm by the end of the trial. For instance, taking
and
(denoted by 3:1), one will end up with at least
of the total sample size being assigned to the control. Note that the model-based design is allowed to select the control arm as the estimated MTC if the associated toxicity is the closest to the target
. This avoids exposing patients to highly toxic combinations if the first combination has a toxicity probability beyond
. Therefore, the total number of patients on the control arm can be more than
.
The modified allocation rule (the randomization of patients between control and investigational arms) raises an important question of the suitable choice of the parametric model which is discussed below.
3. 2.4 4-parameter Emax model
In the context of the single agent trial, the one-parameter power model
is argued to be an appropriate choice for the working dose-toxicity model (O’Quigley et al., Citation1990; O’Quigley and Shen, Citation1996; Iasonos et al., Citation2016), where is a scalar parameter. There are, however, at least two reasons why such (and similar one-parameter models) are not suitable for the considered type trials.
Firstly, the parametric form (5) implies the “strict” monotonicity assumption – the toxicity increases with the dose. It does not allow modeling the plateau in the combination-toxicity relations that is relevant for trials with immunotherapies. Moreover, one can expect that such a model would almost always conclude the ET regardless the scenario which is undesirable in the considered combination trials.
Secondly, the main argument behind using the one-parameter model (and, consequently, the main critique of using many parameter models) is that the CRM design tends to collect observations in the neighborhood of the MTC only (Iasonos et al., Citation2016). This means that the approximation of the dose-toxicity relation in the neighborhood of one point only is of interest and the one-parameter model is rich enough to achieve it. Given the modified allocation rule above, the majority of patients are now assigned in the neighborhood of two points: the control arm and the estimated MTC. Therefore, more flexible models are essential to consider.
Finally, in the considered types of trials a clinician is interested in one more question beyond the MTC and ET identification. Particularly, one would like to estimate the combination-toxicity relationship to allow for a more reliable recommendation for the Phase II clinical trial.
These specifics of the trials with immunotherapy translate in the following conditions on the combination-toxicity relationship:
A model should allow for the toxicity risk at the SoC to be modeled independently – the toxicity of the SoC does not depend on the interaction between compounds.
A model should allow for modeling a plateau at a particular level – a plateau is a plausible shape given dose finding studies of immunotherapies.
A model should allow for modeling a steep increase in toxicity risk in several combinations – the interaction effect of the backbone therapy can appear for a particular dosing of a complementary agent.
There is a number of the dose-response functions that are conventionally considered in dose finding studies in various disease areas and satisfy some of the properties above. For example, a two-parameter logistic model, which is used in oncology dose-escalation trials (Neuenschwander et al., Citation2008; Whitehead and Williamson, Citation1998), allows for the toxicity risk at the SoC to be modeled independently hence satisfies property (1). A three-parameter Emax model commonly used in dose-ranging studies (see, e.g. Bornkamp, Citation2017, for review of various dose-response shapes) allows for a plateau and modeling toxicity at SoC independently and hence satisfies properties (1) and (2). It can, however, model the steep increase in toxicities (property (3)) only at the beginning of the combination-toxicity relationship, but not for moderate combinations.
A potential candidate model satisfying all three properties that we propose to use is the 4-parameter Emax model
where is the toxicity probability on the standard treatment,
is the maximum toxicity probability attributable to the combination,
is the combination which produces
toxicity and
is the slope factor. Following the assumption of the nondecreasing toxicity probability, we specify
. The model is already adjusted to accommodate dose combinations as it uses the unit-less variable
. To construct the standardized levels,
, one needs to represent them in terms of prior estimates of toxicity probabilities
associated with combinations
where ,
,
, and
are prior point estimates of the model parameters. The prior point estimate of the toxicity probability on the control arm is
. Therefore, by definition,
that leads to
. Modeling
directly guarantees that the sequential update of other parameters does not contribute to the toxicity probability estimation on the control arm. In this case, the model takes the trivial form
Intuitively, it reflects that the toxicity probability of the standard therapy does not depend on the mechanism of its interaction with compound , yet all data are used for the estimation of
.
The parameters of the Emax model allows to model the toxicity on the control arm and the plateau and have a clear clinical interpretation. Importantly, Emax model is widely employed in dose-finding studies outside of oncology and being extensively studied in a medical context (Bornkamp, Citation2017). We compare its performance to other widely employed in dose-finding studies one-parameter and two-parameter models in Section 3.
4. Numerical results
4.1. Simulation setting
We explore the performance of the Bayesian model-based dose-escalation method incorporating randomization to the control arm into the Emax model by simulations in many different scenarios. As before, we consider a trial studying combinations of two agents with the dose for the standard therapy being fixed. Motivated by recent combination trial reviews (see, e.g. Dahlberg et al., Citation2014; Riviere et al., Citation2015) we consider a setting with patients and
combinations. Following the motivating trials, we set the target toxicity probability
, the expected difference
and the confidence level
.
Three main characteristics, (i) the proportion of correct selections (PCS), (ii) the proportion of times ET is found and (iii) a goodness-of-fit measure, are considered. A goodness-of-fit measure is used to capture the overall shape of the dose-toxicity relationship which is of interest in the considered type of trials. We use the scenario-normalized mean squared error defined as
where is the number of replications,
is a toxicity probability estimate corresponding to combination
obtained by the design in the
simulation and
is a toxicity probability estimate for combination
obtained by the non-parametric optimal benchmark approach (O’Quigley et al., Citation2002) in the
simulation. The estimates
are computed employing the complete information profiles as introduced by O’Quigley et al. (Citation2002) and using the same sequences of the patients toxicity profiles as for the design under evaluation. The normalization allows a comparison across different scenarios as the nonparametric optimal estimate allows for the incorporation of the each scenario specificities. One would like the NMSE to be equal to 1 as it corresponds to the curve estimated as good as by the optimal benchmark.
4.1.1. Prior specification
The standardized levels, , are constructed using the skeleton
.
The first value, 0.08, corresponds to mean prior toxicity probability for the standard therapy following the motivating trial of Sorafenib. The prior MTC is the first combination ensures the start of the trial at the lowest combination. Other values are obtained by taking the adequate spacing between prior values as the CRM design has been shown to be robust and efficient in this case (O’Quigley and Zohar, Citation2010).
In contrast to the skeleton that is the same whatever model is used for the combination-toxicity relationship, the prior distributions of the model parameters are calibrated so that each design carries the same amount of information. To ensure that the proposed approach and competitive designs are evaluated under comparable set-ups, the credible intervals for the prior toxicity probabilities associated with the control arm and the prior MTC are used. Taking into account that one usually has some reliable information about the SoC, but a limited information about combinations, we specify prior distribution to satisfy the following assumptions:
Control arm
Prior MTC
Following these conditions the prior distributions of the Emax model were specified as
where denotes the Beta distribution with parameters
and
denotes a Gamma distribution with mean
and the variance
. As prior distribution may have quite an impact on the parameter estimates, we first rely on the elicitation given in (7) but also investigate the robustness to the priors in Section 4.1. Since an investigator usually has a reliable prior for
and the detection of a plateau should be determined by data alone (hence an uninformative prior on
is imposed), we fix the prior distributions of
and
and consider less informative prior distributions of
and more informative one for
and more informative prior for and less informative for
We would refer to the design using the Emax model with randomization to the control arm as “EmaxR.”
4.1.2. Cohort size for the control arm and combination skipping
The cohort size is fixed to be for the investigational arm and
for the control arm. Therefore, at least 12 patients (
) will be assigned to the standard therapy and at most 36 patients are assigned to the investigational arm. Other randomization ratios,
and
, are studied in Section 4.2. We allow combinations to be skipped and evaluate the impact of this constraint in Section 4.2.
4.1.3. Scenarios
Nine qualitatively different scenarios, depicted in , are used to study the performance of the novel approach. Scenarios 1–5 are consistent with the prior information of the control arm toxicity probability. Scenario 1 corresponds to the commonly used logistic dose-toxicity shape while scenario 2 considers a flat dose-toxicity curve with the MTC being and no additional toxicity beyond
. In scenario 2, the model monotonicity assumption implies that the toxicity probability on the control has the largest difference with combination
and the model is expected to have a tendency to claim the ET. Scenario 2 is used to test if the randomization to the control group and the Emax model can prevent false conclusions regarding the ET. Scenarios 3–4 have a steep dose-toxicity relationship that plateaus around the target toxicity risk and outside the maximum acceptable toxicity probability, respectively. These scenarios are used to investigate under what conditions it is easier for the design to find the ET. Scenario 5 also corresponds to a sharp increase in the toxicity probability, but for medium combinations which have unacceptable high toxicity such that there is no ET between the MTC and the control arm.
Figure 1. Considered combination-toxicity shapes. The MTC is marked by a triangle.
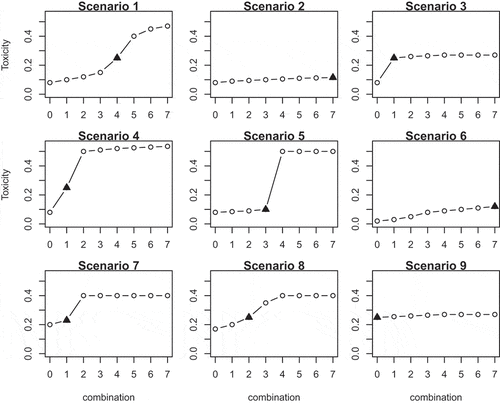
Scenarios 6–9 reflect the case of a misspecified prior toxicity probability for the control arm. In scenario 6, the true toxicity probability for is below the prior value. While the prior information dictates that there is no ET between the MTC and the control (
), although in reality, it is present. In scenarios 7–9, the toxicity probability for the control is underestimated by the prior information and the control arm has a toxicity probability close to the maximum acceptable toxicity. Both cases in which the ET is present (scenario 8) and is absent (scenarios 7 and 9) are considered.
4.1.4. Competing models
The performance of the proposed approach is compared to the design which is currently used in the considering type of Phase I clinical trial – the CRM using the 1-parameter power model (O’Quigley and Shen, Citation1996, P1)
without randomization, where is an unknown scalar parameter. We also consider the two-parameter logistic model (Whitehead and Williamson, Citation1998)
without randomization (L2) and with randomization (L2R), where and
are unknown scalar parameters. As there are at most 36 patients on the investigational arm in the randomized setting against 48 in the nonrandomized one, we would also consider the two-parameter logistic model without randomization and
. This would allow to spot the influence of the randomization on the operating characteristics. The following prior distributions for the parameters of P1, L2, L2R models
and
are chosen to satisfy two conditions on and
formulated above.
The characteristics of all the models compared are evaluated in R (R Core Team, Citation2015) using the bcrm-package by Sweeting et al. (Citation2013). To accommodate the randomization to the control group and the Emax model corresponding modifications to the package were made. The code is available online at https://github.com/dose-finding/Randomised-bcrm.
4.2. Operating characteristics
4.2.1. Proportion of correct selections
The results of the comparison are summarized in (scenarios 1–5) and (scenarios 6–9), with each figure representing the proportion of each combination selections. The last columns represents the proportion of toxic responses.
Table 1. Operating characteristics of the EmaxR, L2R, L2, and P1 models in scenarios 1–5. The figures correspond to the proportion of each combination selections. The MTC selection is in boldface. ‘TR’ corresponds to the average proportion of toxic responses. Results are based on simulations.
Table 2. Operating characteristics of the EmaxR, L2R, L2, and P1 models in scenarios 6–9. The figures correspond to the proportion of each combination selections. The MTC selection is in boldface. ‘TR’ corresponds to the average proportion of toxic responses. Results are based on simulations.
Overall, both randomized models, EmaxR and L2R, result in the same PCS with the difference no more than 4% across all scenarios. The models that do not use randomization have a comparable performance in scenarios 1, 2, 4, 6. In the rest of scenarios, P1 is less conservative and selects toxic combinations more often than L2. The nonrandomized designs select the MTC more often if the MTC is located in the middle of the curve – scenarios 1, 5, 8. Comparing L2R and L2 () in these scenarios, L2 outperforms its randomized version by 6–10%. The decrease in the PCS is mainly explained by the reduced number of patients on the investigational arm: the differences between L2R and L2
vary in the range 1–3%. While randomization entails a minor drop in these scenarios, it might also result in a notable increase in the PCS if the MTC located at the beginning of the curve, close to the control (scenarios 3, 4, and 7). Considering L2R and L2, the randomization leads to more accurate MTC selection by 17%, 11%, and 5%, respectively. These difference increase to 19%, 14%, and 15% compared to the L2
with the same number of patients on the investigational arm. Moreover, the inclusion of the randomization allows decreasing the proportion of toxic responses by up to 6% in scenario 1 that results in nearly two fewer patients with toxic outcomes. Note that misspecified prior distribution for the control (scenarios 6–9) does not affect the MTC selection significantly
In scenarios 2 and 6, the MTC is the highest combination and all models select the MTC in more than 90% of replications with L2R having the least PCS: 91.2% in scenario 2 and 96.1% in scenario 6. In the case when the control treatment is already associated with a maximum acceptable toxicity (scenario 9), the randomized designs selects the control by nearly 10% more often than L2. Generally, the randomized designs are more conservative and select combinations in the beginning of the curve more often with nearly 70% of selection against 45% for L2 and 22% for P1.
4.2.2. Probability to find the ET
While both four- and two-parameters models with randomization were shown to have comparable performance in terms of the PCS, the major differences can be found in . The upper line represents the proportion of times the ET is found () while the lower line shows the NMSE.
Table 3. Operating characteristics of EmaxR, L2R, L2, and P1 models. The upper line: the proportion of times the ET is found. The lower line: NMSE. Scenarios with no ET are underlined. Results are based on simulations.
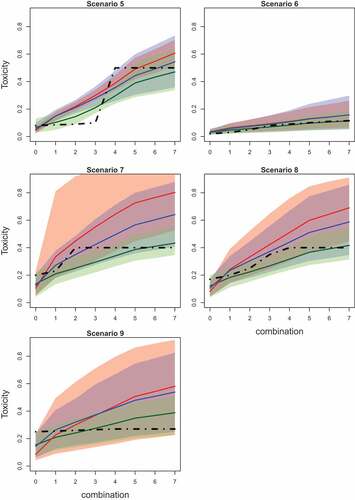
Comparing randomized designs, EmaxR results in the greater proportion of correctly identified ET in scenarios 1, 3, 4, 6, and 8 by 2–7%. In scenarios with no ET (2, 5, 7, and 9), EmaxR declares the ET less often than L2R by 2–9%. Note, however, that both approaches wrongly declare the ET in the majority of trials in scenario 5. Both models struggle to captured the sharp jump in the toxicity curve and overestimate the toxicity probability for the MTC (see also and for the illustration of fitted curves). It is also challenging for both approaches to determine the ET in scenarios 6 and 8 when the prior for the control is misspecified. EmaxR correctly identifies the ET in 24% and 30% of all trials. At the same time, the prior misspecification is not being an issue in scenarios 7 and 9 with no ET as the EmaxR finds additional toxicity in only 12% and 6% of trials, respectively.
Figure 2. Mean values (solid lines) and 90% credible intervals (shadowed area) of the toxicity probabilities for each combination obtained by fitted Emax (green), L2R (blue), and L2 (red) models in scenarios 1–4. The true toxicity curve is marked by the dashed-dotted line. Results are based on 104 replications.
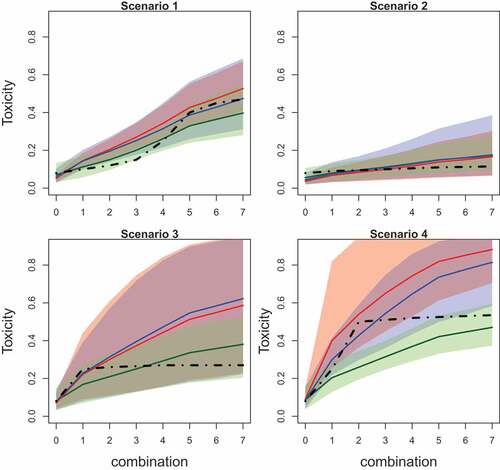
Figure 3. Mean values (solid lines) and 90% credible intervals (shadowed area) of the toxicity probabilities for each combination obtained by fitted Emax (green), L2R (blue), and L2 (red) models in scenarios 5–9. The true toxicity curve is marked by the dashed-dotted line. Results are based on 104 replications.
Regarding the design with no randomization, P1 almost always declares ET regardless the underlying scenario. As expected the strong assumption of monotonicity imposed by the power model results in this (often) incorrect conclusion. L2 does not share the same pattern and it is able to declare the ET with low probability if it is not present (e.g. scenario 2). At the same time, the inclusion of the randomization in L2 leads to large increase in the proportion of correctly identified ET by 10–14% in scenarios 1, 3, and 4. Again, comparing approaches with the same number of patients on the investigational arm these proportions differ by 25–30%. In the rest of scenarios with the ET (scenarios 6 and 8), L2 and L2R have the same characteristics with L2R outperforming the L2 () by 5–10%. In the majority of scenarios with no ET, using L2R instead of L2 leads to a decrease in the proportion of incorrect conclusions of the ET, for example, by 16% and 32% in scenarios 7 and 9, respectively. There is only one example when randomization increases the probability to find the ET while it is not there – scenario 5.
4.2.3. Goodness-of-fit
Comparing the ability of models to fit the toxicity curves, being the most flexible model EmaxR results in the smallest values of NMSE in all scenarios with the largest difference in scenario 3 2.2 and 7.8 (for P1), and the smallest difference in scenario 6
1.4 and 1.5 (for L2R). Similarly, P1, the least flexible alternative, results in the greatest values of the NMSE in all scenarios. L2 shows a better fit than P1, but it can be further improved by the randomization. Low values of NMSE for L2 with the reduced number of patients can be explained by the decreased accuracy of the nonparametric optimal benchmark.
Further differences in the ability of the models to detect a dose effect are given in and presenting the mean values of toxicity probabilities and corresponding 90% credible interval. The mean values for estimated probabilities are given by solid lines while the credible interval is given by shadow areas of the corresponding color. The true toxicity probabilities are given by dashed-dotted lines.
EmaxR corresponds to the best fit of the toxicity curve and to the narrowest credible interval among all alternatives in all scenarios. The fitted curves of L2R and L2 are similar for the first combinations, but the probability values obtained by L2R are more accurate due to the shift toward the true toxicity probability for further combinations.
Overall, it is found that EmaxR is able to give a more accurate answer to secondary questions of the Phase I trial about the ET and a possible dose effect. The cost of this answer is a minor drop in the PCS in scenarios with the MTC being in the middle of the combination-toxicity curve. Comparing the same parametric models, it was shown that the randomization is generally allowed to increase the proportion of correctly determining if the ET is present and also improves the fit of the curve. At the same time, the 1-parameter power model does not meet the requirement to answer secondary goals of the study as it almost always declares the ET.
5. Sensitivity analysis
5.1. Prior distributions
In this section the influence of different sets of prior distributions is studied. We compare the previously used prior distributions given in (7) with (8) denoted by EmaxR () and the set given in (9) and denoted by EmaxR (
). The summary of the simulation results are given in .
Table 4. Operating characteristics of EmaxR using different sets of prior distributions. Scenarios with no ET are underlined. and the most noticeable differences across scenarios are in bold. Results are based on simulations.
In the majority of the scenarios, the choice of prior did not influence the PCS by more than 4% with scenarios 1, 3, and 8 being exceptions. In cases where the MTC lay in the middle of the curve (scenarios 1 and 8), the informative prior for resulted in nearly 10% loss in the PCS. This set of prior distributions also results in slightly lower PCS in scenario 5 with the MTC being the in the middle as well. Conversely, in scenario 3 where the MTC is located at the beginning of the curve, the PCS was greater. At the same time, the proportion of toxicity responses are not influenced by the prior choice in all scenarios.
The proportion of times ET is found is again not affected by the choice of prior in scenarios 1–4, 6–7, and 9 with the difference between competing models below 10%. The major difference in can be found in scenario 5 in which the informative prior for
leads to 20% more false conclusions than the informative prior for
. At the same time, it is generally harder for the EmaxR (
) to detect the ET with the largest difference of 10% in scenario 8. Also, while NMSE is not largely affected by the choice of the prior, EmaxR (
) results in slightly greater values in scenarios 1, 2, 4, 6–8 with the largest difference of 1 in scenario 4.
Overall, the choice of prior does not seem to have a noticeable effect in the majority of the cases, but EmaxR () is more robust and results in a more accurate toxicity curve fitting. Therefore, an informative prior for
and an uninformative prior for
appear to be the preferable choice.
6. Randomization ratio
The randomization was shown to be the key factor in the dose-toxicity curve fit improving and in establishing the ET. We now consider the impact of different randomization ratios on the performance of the design. The prior given in (7) is used and the summary of the results is given in .
Table 5. Operating characteristics of EmaxR using different randomization ratios and no-skipping combination constraint. Scenarios with no ET are underlined and the most noticeable differences across scenarios are in bold. Results are based on simulations.
Comparing models with the same randomization ratio, the no skipping constraint has a minor influence on all characteristics of EmaxR (2:1), EmaxR (3:1), and EmaxR (4:1) in all scenarios. In the majority of cases, the difference does not exceed 4%. The only exception in terms of the PCS is EmaxR (4:1) in scenario 2 with the MTC being the last combination. Given a large cohort size (), the total sample size
is not always enough to test all combination and reach the MTC, which results in less accurate MTC selections by 6%. For EmaxR (4:1) no skipping constraint also increases
by 5% in scenario 3 with the MTC being at the beginning of the curve and decreases it by 6% in scenario 5 with the MTC being the medium combination.
Considering different randomization ratios with combinations skipping, all approaches result in comparable PCS in all scenarios with EmaxR(2:1) in scenario 9 being the exception. The increased number of patients on the control arm (16 patients) gives a higher PCS in this scenario when the MTC is the SoC itself. At the same time, a smaller number of patients on the investigational arm might result in a substantial loss in the ability to detect the ET, for example, in scenario 8, decreased by 10% compared to EmaxR (3:1). Note that EmaxR(4:1) also results in a less accurate ET detection in this case as there are fewer patients on the control. Moreover, ratio 4:1 results in more toxic responses as more patients are assigned to the control. There is no noticeable difference in the NMSE across difference ratios.
Overall, while the operating characteristics remain unchanged by the randomization ratio in the majority of scenarios, a ratio of 3:1 seems to be a reasonable trade-off between the MTC selection and a plateau detection.
6. Discussion
The Bayesian model-based dose-escalation methods incorporating randomization to the control arm into the Emax model were studied and compared with widely used model-based alternatives with and without the control group. It was found that the inclusion of the randomization to the control group and the Emax model allow for the identification of the ET between the toxicity risk at the optimal dose combination and the single agent more frequently than alternative approaches. The cost of randomization to the control arm is presented by a small reduction in the proportion of correct selections in scenarios with the MTC being in the middle of a combination-toxicity curve. The sensitivity analysis suggests that the design is robust to the prior for reasonable choices and to the allocation ratio between investigation and control arms.
It is important to mention that the question of using the control group in Phase I trials is widely debated in the literature (e.g. Saad et al., Citation2017). The main argument against is the monotonicity assumption that makes comparing toxicity levels unnecessary and results in considering the control group as a “waste of resources” (not contributing to the MTC selection). However, this assumption has been found to be inappropriate for many immunotherapies. Moreover, it is found that the randomization between MTC and the control allows establishing that an effect observed for a combination is associated with the interaction of treatments and not only due to one of the therapies in the combination. Another advantage of the inclusion of the control is that it allows assessment for preliminary signs of activity which will help to make decisions about taking a treatment forward to the next phase of the development. Therefore, we argue that the control arm should be included in drug-combination trials. Importantly, the control group (patients allocated to the control arm) receives the SoC which makes the randomization an ethically viable option.
The proposed design uses a fixed randomization ratio during the trial which is specified prior to the trial. However, one can also consider adaptive randomization schemes which would change the randomization ratio based on the values of estimated while the trial progress. For example, if
is large, then one has a high confidence that the ET is present. In the setting when a clinician does not tolerate an increase in toxicity risk by more than
, this might be a sign to change the randomization ratio and make it more balanced randomization for overdose control. Similarly, if
is small, more patients can be randomized to the MTC.
Evidently, the proposed method has the same limitations as the classical Bayesian CRM design. Among others, a large variance of a number of patients on the MTC as indicated by Oron and Hoff (Citation2013). Therefore, it is hard to guarantee the specific level of power in the frequentist hypothesis that could also be of interest in the considered framework. Consequently, the design that could maximize the power of such test might be also of a great interest. Moreover, further investigation is needed to explore the conditions when randomization is able to overcome the fitting problem of the four-parameter model with a small number of patients which might be a major issue of the proposed approach. Finally, while Phase I clinical trials are considered in this paper only, a proper comparison of the optimal combination and control effectivenesses in Phase II trials is also essential (Sharma and Allison, Citation2015). In this case, a proper way to conduct this comparison should be investigated.
Acknowledgments
The authors acknowledge the insightful and constructive comments made by two reviewers. This project has received funding from the European Union‘s Horizon 2020 research and innovation program under the Marie Sklodowska-Curie grant agreement No 633567. Xavier Paoletti is partially funded by the Institut National du Cancer (French NCI) grant SHS-2015 Optidose immuno project. This report is independent research arising in part from Prof Jaki’s Senior Research Fellowship (NIHR-SRF-2015-08-001) supported by the National Institute for Health Research. The views expressed in this publication are those of the authors and not necessarily those of the NHS, the National Institute for Health Research or the Department of Health.
Additional information
Funding
References
- Aglietta, M., C.Barone, M., Sawyer, M., Moore, W., Miller, J., Bagalà, F., Colombi, C., Cagnazzo, Gioeni, L., Wang, E., et al. (2014). A phase i dose escalation trial of tremelimumab (cp-675,206) in combination with gemcitabine in chemotherapy-naive patients with metastatic pancreatic cancer. Annals of Oncology 25(9): 1750–1755. doi:10.1093/annonc/mdu203.
- Bornkamp, B. (2017). Dose-finding studies in Phase II: Introduction and overview. In J. O’Quigley, A. Iasonos, B. Bornkamp (Eds.), Handbook of Methods for Designing, Monitoring, and Analyzing Dose-Finding Trials, Vol. Chapter 11. 189–204. 6000 Broken Sound Parkway NW, Suite 300, CRC Press, Taylor and Francis Group.
- Crane, C. H., Abbruzzese, J. L., Evans, D. B., Wolff, R. A., Ballo, M. T., Delclos, M., Milas, L., Mason, K., Charnsangavej, C., Pisters, P., et al. (2002). Is the therapeutic index better with gemcitabine-based chemoradiation than with 5-fluorouracil-based chemoradiation in locally advanced pancreatic cancer? International Journal of Radiation Oncology Biology Physics 52(5): 1293–1302. doi:10.1016/S0360-3016(01)02740-7.
- Dahlberg, S. E., Shapiro, G. I., Clark, J. W., Johnson, B. E. (2014). Evaluation of statistical designs in phase i expansion cohorts: The dana-farber/harvard cancer center experience. JNCI: Journal of the National Cancer Institute 106(7):dju163. doi:10.1093/jnci/dju163.
- Disis, M. L. (2010). Immune regulation of cancer. Journal of Clinical Oncology 28(29):4531–4538. doi:10.1200/JCO.2009.27.2146.
- Hellmann, M. D., Rizvi, N. A., Goldman, J. W., Gettinger, S. N., Borghaei, H., Brahmer, J. R., Ready, N. E., Gerber, D. E., Chow, L. Q., Juergens, R. A., et al. (2017). Nivolumab plus ipilimumab as first-line treatment for advanced non-small-cell lung cancer (checkmate 012): Results of an open-label, phase 1, multicohort study. The Lancet Oncology 18(1): 31–41. doi:10.1016/S1470-2045(17)30072-4.
- Iasonos, A., Wages, N. A., Conaway, M. R., Cheung, K., Yuan, Y., O’Quigley, J. (2016). Dimension of model parameter space and operating characteristics in adaptive dose-finding studies. Statistics in Medicine 35(21):3760–3775. doi:10.1002/sim.6966.
- Ivanova, A., Wang, K. (2004). A non-parametric approach to the design and analysis of two-dimensional dose-finding trials. Statistics in Medicine 23(12):1861–1870. doi:10.1002/(ISSN)1097-0258.
- Kyi, C., Postow, M. A. (2014). Checkpoint blocking antibodies in cancer immunotherapy. FEBS letters 588(2):368–376. doi:10.1016/j.febslet.2013.10.015.
- Lin, R., Yin, G. (2017). Bayesian optimal interval design for dose finding in drug-combination trials. Statistical Methods in Medical Research 26(5):2155–2167. doi:10.1177/0962280215598665.
- Neuenschwander, B., Branson, M., Gsponer, T. (2008). Critical aspects of the Bayesian approach to phase i cancer trials. Statistics in Medicine 27(13):2420–2439. doi:10.1002/sim.3348.
- O’Quigley, J., Paoletti, X., Maccario, J. (2002). Non-parametric optimal design in dose finding studies. Biostatistics 3(1):51–56. doi:10.1093/biostatistics/3.1.51.
- O’Quigley, J., Pepe, M., Fisher, L. (1990). Continual reassessment method: A practical design for phase 1 clinical trials in cancer. Biometrics 33–48. doi:10.2307/2531628.
- O’Quigley, J., Shen, L. Z. (1996). Continual reassessment method: A likelihood approach. Biometrics 673–684. doi:10.2307/2532905.
- O’Quigley, J., Zohar, S. (2010). Retrospective robustness of the continual reassessment method. Journal of Biopharmaceutical Statistics 20(5):1013–1025. doi:10.1080/10543400903315732.
- Oron, A. P., Hoff, P. D. (2013). Small-sample behavior of novel phase i cancer trial designs. Clinical Trials 10(1):63–80. doi:10.1177/1740774512469311.
- Paller, C. J., Bradbury, P. A., Ivy, S. P., Seymour, L., LoRusso, P. M., Baker, L., Rubinstein, L., Huang, E., Collyar, D., Groshen, S., et al. (2014). Design of phase i combination trials: Recommendations of the clinical trial design task force of the nci investigational drug steering committee. Clinical Cancer Research 20(16): 4210–4217. doi:10.1158/1078-0432.CCR-13-3045.
- Pardoll, D. M. (2012). The blockade of immune checkpoints in cancer immunotherapy. Nature Reviews. Cancer 12(4):252. doi:10.1038/nrc3239.
- Patnaik, A., Kang, S. P., Rasco, D., Papadopoulos, K. P., Elassaiss-Schaap, J., Beeram, M., Drengler, R., Chen, C., Smith, L. S., Espino, G., et al. (2015). Phase I Study of Pembrolizumab (Mk-3475; Anti-Pd-1 Monoclonal Antibody) in Patients with Advanced Solid Tumors. Clinical Cancer Research, clincanres–2607.
- R Core Team. (2015). R: A Language and Environment for Statistical Computing. Vienna, Austria:R Foundation for Statistical Computing.
- Reiner, E., Paoletti, X., O’Quigley, J. (1999). Operating characteristics of the standard phase i clinical trial design. Computational Statistics & Data Analysis 30(3):303–315. doi:10.1016/S0167-9473(98)00095-4.
- Riviere, M.-K., Dubois, F., Zohar, S. (2015). Competing designs for drug combination in phase i dose-finding clinical trials. Statistics in Medicine 34(1):1–12. doi:10.1002/sim.v34.1.
- Robert, C., Ribas, A., Wolchok, J. D., Hodi, F. S., Hamid, O., Kefford, R., Weber, J. S., Joshua, A. M., Hwu, W.-J., Gangadhar, T. C., et al. (2014). Anti-programmed-death-receptor-1 treatment with pembrolizumab in ipilimumab-refractory advanced melanoma: A randomised dose-comparison cohort of a phase 1 trial. The Lancet 384(9948): 1109–1117. doi:10.1016/S0140-6736(14)60958-2.
- Saad, E. D., Paoletti, X., Burzykowski, T., Buyse, M. (2017). Precision medicine needs randomized clinical trials. Nature Reviews Clinical Oncology 14(5):317–323. doi:10.1038/nrclinonc.2017.8.
- Sharma, P., Allison, J. P. (2015). The future of immune checkpoint therapy. Science 348(6230):56–61. doi:10.1126/science.aaa5139.
- Sweeting, M., Mander, A., Sabin, T., et al. (2013). Bcrm: Bayesian continual reassessment method designs for phase i dose-finding trials. Journal of Statistical Software 54(1): 1–26. doi:10.18637/jss.v054.i13.
- Wages, N. A., Conaway, M. R., O’Quigley, J. (2011). Continual reassessment method for partial ordering. Biometrics 67(4):1555–1563. doi:10.1111/j.1541-0420.2011.01560.x.
- Whitehead, J., Williamson, D. (1998). Bayesian decision procedures based on logistic regression models for dose-finding studies. Journal of Biopharmaceutical Statistics 8(3):445–467. doi:10.1080/10543409808835252.
- Wilhelm, S., Carter, C., Lynch, M., Lowinger, T., Dumas, J., Smith, R. A., Schwartz, B., Simantov, R., Kelley, S. (2006). Discovery and development of sorafenib: A multikinase inhibitor for treating cancer. Nature Reviews. Drug Discovery 5(10):835. doi:10.1038/nrd2130.
- Yamamoto, N., Nokihara, H., Yamada, Y., Shibata, T., Tamura, Y., Seki, Y., Honda, K., Tanabe, Y., Wakui, H., Tamura, T. (2017). Phase i study of nivolumab, an anti-pd-1 antibody, in patients with malignant solid tumors. Investigational New Drugs 35(2):207–216. doi:10.1007/s10637-016-0411-2.
- Yin, G., Yuan, Y. (2009). Bayesian dose finding in oncology for drug combinations by copula regression. Journal of the Royal Statistical Society: Series C (Applied Statistics) 58(2):211–224. doi:10.1111/rssc.2009.58.issue-2.