
ABSTRACT
Objectives
The FDA recommends the use of anchor-based methods and empirical cumulative distribution function (eCDF) curves to establish a meaningful within-patient change (MWPC) for a clinical outcome assessment (COA). In practice, the estimates obtained from model-based methods and eCDF curves may not closely align, although an anchor is used with both. To help interpret their results, we investigated and compared these approaches.
Methods
Both repeated measures model (RMM) and eCDF approaches were used to estimate an MWPC on a target COA. We used both real-life (ClinicalTrials.gov: NCT02697773) and simulated data sets that included 688 patients with up to six visits per patient, target COA (range 0 to 10), and an anchor measure on patient global assessment of osteoarthritis from 1 (very good) to 5 (very poor). Ninety-five percent confidence intervals for the MWPC were calculated by the bootstrap method.
Results
The distribution of the COA score changes affected the degree of concordance between RMM and eCDF estimates. The COA score changes from simulated normally distributed data led to greater concordance between the two approaches than did COA score changes from the actual clinical data. The confidence intervals of MWPC estimate based on eCDF methods were much wider than that by RMM methods, and the point estimate of eCDF methods varied noticeably across visits.
Conclusions
Our data explored the differences of model-based methods over eCDF approaches, finding that the former integrates more information across a diverse range of COA and anchor scores and provides more precise estimates for the MWPC.
1. Introduction
Unlike well-established clinical measurements (e.g. overall survival, objective response), the scores produced by clinical outcome assessments (COAs) can be challenging to interpret from a clinical perspective. For example, what level of improvement on a 0- to 100-point scale of quality of life represents a meaningful change for an individual patient? To begin to address this issue, in 1989, the term “minimal clinical important difference (MCID)” was first defined by Jaeschke et al. as “the smallest difference in score in the domain of interest which patients perceive as beneficial and which would mandate, in the absence of troublesome side effects and excessive cost, a change in the patient’s management” (Coon and Cappelleri Citation2016; Jaeschke et al. Citation1989). However, MCID does not necessarily reflect meaningful within-patient change (MWPC) if the estimates are derived from between-group data (Dworkin et al. Citation2009). From a regulatory standpoint, the U.S. Food & Drug Administration (FDA) has stated that for the interpretation of the meaningfulness of COAs, it is more interested in what constitutes an MWPC in scores from the patient perspective rather than at the group level (FDA Citation2018). The concept of MWPC (i.e. improvement and deterioration from the patients’ perspective) has been updated in the recent draft guidance in 2018–2019 (FDA Citation2018, Citation2019).
The methods for interpreting change in scores on COAs have evolved over time and include both anchor-based and distribution-based analyses (Coon and Cook Citation2018; Crosby et al. Citation2003, Citation2004; McLeod et al. Citation2011; Rai et al. Citation2015; Revicki et al. Citation2008). The distribution-based methods (e.g. standard deviation, effect size) use what is known about the precision of the actual scores to interpret changes in those scores, which are intended primarily to ensure that the MWPC is greater than the detectable difference accounting for measurement error in the measure, and not required to be associated with an already established meaningful change. FDA recommends the use of anchor-based methods and both empirical cumulative distribution function (eCDF) curves and probability density function (ePDF) curves to establish a threshold, or range of thresholds, that would constitute an MWPC for a target COA for the intended population (FDA Citation2018).
The anchor measures are used as external criteria to define patients who have or have not experienced a meaningful change in their condition, with the change in COA score evaluated in these sets of patients. The selected anchors should be: 1) plainly understood in context, 2) easier to interpret than the COA itself, 3) sufficiently associated with the target endpoint, and 4) assessed at comparable time points. Ideally, an anchor-based analysis should use multiple anchors. Although anchors differ from situation to situation, a common generic anchor that is used because of its simplicity and ease of interpretation is a “global impression of severity scale”, such as patient global impression of severity or PGIS. When anchor-based methods are applied, in addition to the model-based approach (e.g., estimate an MWPC by using a repeated measure model with a predictor of explanatory anchoring measure), the eCDF curves can be used to display a continuous view of the change in COA score from baseline to the proposed time point on the horizontal axis, with the vertical axis representing the cumulative proportion of patients experiencing up to that level of score change (e.g. 30%, 50%, or 70%) (FDA Citation2018).
Also, the ePDF curves are useful in aiding in the interpretation of eCDF curves because ePDF and eCDF curves are just transforms of one another. The results based upon both the model-based approach and the eCDF/ePDF curves are expected to support each other to establish a threshold, or range of thresholds of within-patient change on COA scores, that would be clinically meaningful to the target population.
In practice, however, the estimates obtained from model-based methods and eCDF/ePDF curves may not closely align even though an anchor is used with both. This difference has been observed in our real-life data with repeated COAs (ClinicalTrials.gov Citation2021; Schnitzer et al. Citation2019). For example, this issue was found in a recent article in which MWPC thresholds were identified for domains of migraine-specific COA instruments to assess the functional impact of migraine in patients with episodic or chronic migraine (Speck et al. Citation2021). For a 1-point improvement on the anchor of Patient Global Impression of Severity, the median (equivalent to 50% eCDF) and mean (equivalent to model-based estimate) of MWPC on the emotional function domain were considerably different, 13.3 vs 20.4. Such discrepancies have motivated us to investigate whether we should consider the two methods (model-based vs eCDF) equally for establishing an MWPC.
Guidance is needed on how to interpret and calibrate an MWPC when the estimates between model-based and eCDF methods are different. To fill this gap, we aimed to investigate and compare the two approaches in both real-life and simulated data sets in order to determine which of the approaches would be more robust.
2. Materials and methods
2.1. Study design and data source
To align with the FDA COA Guidance (FDA Citation2018), we will only discuss anchor-based approaches in this article. For convenience, the terms of repeated measure model (RMM) and eCDF methods used in this article will stand for the approaches to estimate an MWPC by using a repeated measure model with a predictor of explanatory anchoring measure(s), and using empirical cumulative distribution function curves plotted by each distinct anchor category, respectively.
Both RMM and eCDF methods were applied to a clinical trial data set (ClinicalTrials.gov Identifier: NCT02697773) (ClinicalTrials.gov Citation2021; Schnitzer et al. Citation2019), i.e. a real-life data set, and a simulated data set in order to estimate MWPC on a target COA, Western Ontario and McMaster Universities Osteoarthritis Index (WOMACFootnote1). The clinical trial was a phase 3 randomized, double-blind, placebo-controlled, multicenter study of the analgesic efficacy and safety of a subcutaneous titration dosing regimen in subjects with moderate to severe osteoarthritis of the hip or knee. The treatment groups in the clinical trial were combined because the treatment was not relevant to this methodological study (we assume that the relationship between target COA and anchor would be similar across treatment groups). Although the original study enrolled 698 subjects, 10 subjects were excluded due to no available data for analysis. The real-life data set was used to evaluate whether or not estimates of MWPC between RMM and eCDF methods closely align, whereas the simulated data set was used to investigate if this issue would still exist given normally distributed COAs. In both data sets, a bootstrapping technique was applied to estimate the sampling distribution.
Given that this research is strictly methodological, for purely illustrative purposes, only de-identified data separately from the real-life data set were used in the analyses. The data included 688 patients who had moderate to severe osteoarthritis (OA) and were not receiving benefit from existing standard of care analgesics. Each patient had up to six follow-up visits after the baseline, and were to complete the target COA (WOMAC) and an anchor question (patient global assessment of OA [PGA-OA]) at baseline and all the follow-up visits. WOMAC Index Version 3.1 numeric rating scale (NRS) is an OA-specific measure of pain, function, and stiffness, consisting of 24 items assessed using a 0–10 NRS, with a recall period of the last 48 hours. For this analysis, we evaluated only the WOMAC pain subscale, consisting of five items, averaged to create a score from 0 (no pain) to 10 (extreme pain), with higher scores indicating worse pain (Bushmakin and Cappelleri Citation2022; Schnitzer et al. Citation2019; Speck et al. Citation2021). The PGA-OA anchor question asks patients, “Considering all the ways your osteoarthritis in your hip/knee affects you, how are you doing today?” measured on a 5-point Likert scale from 1 = “very good” (asymptomatic and no limitation of normal activities) to 5 = “very poor” (very severe symptoms that are intolerable and inability to carry out all normal activities).
The simulated data set was generated using the same data structure as the real-life data set (Online Resource S1). All variables and values were exactly the same between clinical trial data and the simulated data sets except for the target COA (WOMAC pain subscale). In the simulated data set, the mean score of the WOMAC pain subscale baseline was set at 7.0, which reflected the mean score at baseline in the real-life data set. In order to mimic the real-life data, the mean scores of the WOMAC pain subscale at follow-up visits were set at 0.5, 2.0, 3.5, 5.0, and 6.5 given an anchor change from baseline at −3, −2, −1, 0, and 1, respectively. A positive change on the score of WOMAC pain subscale and on the PGA-OA indicated worse pain and poorer condition, respectively. It should be noted that the change of COA is not necessarily zero for patients without change in the anchor (Bushmakin and Cappelleri Citation2022; Conaghan et al. Citation2022).
The covariance matrix of repeated COAs given an anchor change of 0 was chosen in the simulation because the matrix was not always available for each level of anchor change in the real-life data set. The measurement error of COAs was considered in the covariance matrix. Then, multivariate normal distributions with the mean COA scores and corresponding covariance matrix as aforementioned were used to generate repeated target COAs at six follow-up visits by each level of anchor change. Eventually, both real-life and simulated data sets had a comparable magnitude of COA change from baseline across each level of anchor change.
2.2. Model-based methods
Since the WOMAC pain subscale scores were measured at multiple time points, RMM was used to estimate an MWPC based on the concept of reasonable correlation between the COA and the explanatory anchor measure (Bushmakin and Cappelleri Citation2022). In the model, all observations were used, and for each time point, the change of COA scores from baseline was treated as the dependent variable (outcome), the change of anchor PGA scores from baseline was set as the predictor variable. Our analysis assumed that the relationship between the change of COA scores and the change of anchor PGA scores from baseline were similar over time. An unstructured covariance matrix was used to cope with the repeated measures. The unstructured covariance assumed that each variance and covariance was unique, and it was chosen because it is generic and makes no assumptions.
When the change in PGA-OA was set as a continuous variable, which imposes a linear relationship between outcome (i.e. change in WOMAC pain subscale) and anchor (change in PGA-OA), the point estimate of MWPC and 95% confidence interval (95%CI) were calculated given any 1-level anchor change. We also set the change in PGA-OA as a categorical variable, in order to estimate an MWPC by each category of anchor change.
The R package ‘nlme’ was employed to fit the RMMs (Pinheiro et al. Citation2021).
2.3. eCDF methods
In the FDA workshop report (FDA Citation2018), a horizontal line is placed at the 50th percentile of the figure in which eCDF is plotted for each category of anchor change. Although not explicitly stated, the FDA workshop report implies that the median of the eCDF could be used to estimate a MWPC. Since this study had longitudinal data with repeated measures, we calculated the eCDF-derived median for each visit and then estimated the median of those values (eCDF_median_visit). The eCDF-derived median for each visit was kept to check if the estimate from baseline to primary time point was sufficient without considering other time points.
Corresponding ePDF curves were also drawn to demonstrate the distribution of COA change. To have a common type of estimate to compare eCDF-based vs modeling-based approaches, we also calculated the mean of eCDF-derived means by each visit (eCDF_mean_visit) as a sensitivity analysis.
2.4. Bootstrapping
Bootstrapping is a technique using random sampling with replacement, which allows estimation of the distribution of many descriptive statistics, using random sampling methods (Efron and Tibshirani Citation1986). In this study, we applied bootstrapping to estimate the mean and 95%CI of MWPC for both model-based and eCDF methods in the real-life and simulated data sets.
The bootstrapping had 1,000 iterations. During each iteration, we randomly sampled 688 patient-level data with replacement. A patient who had multiple visits was selected as a whole unit.
3. Results
3.1. Descriptive statistics in both real-life and simulated data sets
The mean change from baseline in WOMAC pain subscale was from −0.23 to −6.53 in the real-life data set when the category of anchor change was from 1 to −3, respectively, which was similar to that in simulated data set (). Overall, the means approximated to the medians except a little deviation sometimes, such as those for the anchor change of −2 in the real-life data (−4.99 vs −5.40). The distributions of within-patient COA change in both the real-life and simulated data sets are demonstrated in . The Pearson correlation between the target COA change and the anchor change from baseline was 0.61 and 0.64 in the real-life and simulated data sets, respectively.
Figure 1. eCDF/ePDF curves of target COA (WOMAC pain subscale) change from baseline by anchor change.
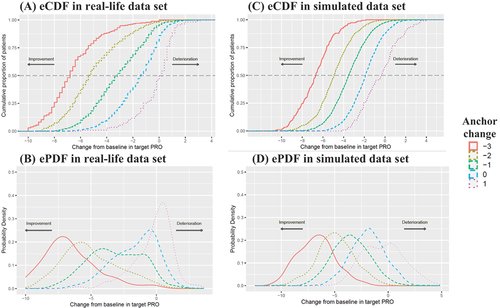
Table 1. Descriptive statistics of the change from baseline in WOMAC pain subscale for each category of the anchor change.
3.2. MWPC in the real-life data set
As depicted in and , the RMM with continuous anchor change, as a primary approach, estimated an MWPC of 1.20 on the WOMAC pain subscale given an increase of 1-level anchor change from baseline. The RMM with categorical anchor change had an estimate of 1.22 given an increase of 1-level anchor change from −2 to −1, which mainly aligned with the estimate by RMM with continuous anchor change. However, the corresponding estimates by eCDF methods (eCDF_median_visit: 2.20; eCDF_mean_visit: 1.77) were larger than the model-based methods.
Figure 2. Estimates of within-patient change in target COA (WOMAC pain subscale) by model-based and eCDF methods.
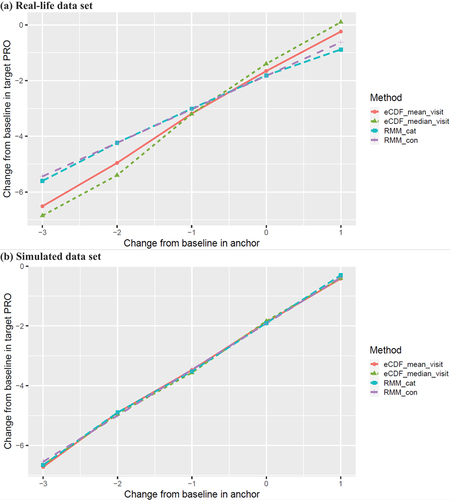
Table 2. Estimates of within-patient change in WOMAC pain subscale by model-based and eCDF methods in the real-life data set.
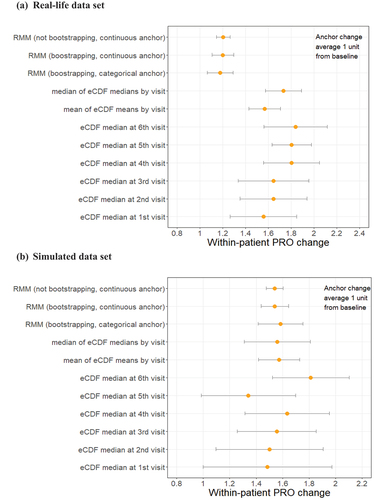
This issue was also observed in the bootstrapping samples when an equal effect was assumed at each visit and thus across visits. Both RMM with continuous anchor change and RMM with categorical anchor change had a similar estimate (1.20 [95%CI: 1.11–1.30] vs 1.18 [95%CI: 1.07–1.29]), but differed considerably from the estimates (a range of point estimate from 1.56 to 1.83) based on eCDF methods no matter whether we used a single visit or all visits (). Furthermore, the CIs of estimates based on eCDF methods were wider than that of model-based methods, and their point estimates varied across visits ( and Online Resource S2).
Figure 3. Within-patient change in target COA (WOMAC pain subscale) given 1-level anchor change (bootstrapping and parametric model results).
3.3. MWPC in the simulated data set
As shown in and , RMM with continuous anchor change, as a primary approach, estimated an MWPC of 1.54 given an increase of 1-level anchor change from baseline. RMM with categorical anchor change had an estimate of 1.76, 1.38, 1.61, and 1.60 given an increase of 1-level anchor change from −3 to 1, respectively, which mainly aligned with the estimate by RMM with continuous anchor change. Also, the corresponding estimates by eCDF methods (eCDF_median_visit: 1.64, 1.52, 1.64, and 1.32; eCDF_mean_visit: 1.82, 1.43, 1.60, and 1.46, respectively) were similar with the model-based methods.
Table 3. Estimates of within-patient change in WOMAC pain subscale by model-based and eCDF methods in the simulated data set.
The findings were confirmed in the bootstrapping samples when an equal effect was assumed at each visit and thus across visits. As shown in , the estimates tended to be concordant between model-based (RMM with continuous anchor change, 1.54 [95%CI: 1.44–1.64]) and eCDF approaches (eCDF_median_visit, 1.56 [95%CI: 1.31–1.81]). But the CIs of estimates based on eCDF methods were still wider than that of model-based methods, and their point estimates varied noticeably across visits ( and Online Resource S3).
In addition, the within-patient COA change in the simulated data set was not perfectly normally distributed by each visit (Online Resource S3), although a multinormal distribution was simulated for the repeated measures. However, it did not have much impact on the overall estimates of MWPC by model-based methods, which had integrated all information of repeated measures at follow-up visits.
3.4. Correlation structure for repeated measures
In the repeated measures models used to analyze the real-life data, an unstructured correlation structure was assumed, and the estimated correlation between visits ranged from 0.43 to 0.88. The correlation structure remained similar in the subset that only included an anchor change of 0 from baseline.
4. Discussion
In this study, we found that the estimates of MWPC for the WOMAC pain subscale in the real-life data set were different between the model-based method and eCDF method, with the latter producing estimates that were almost double in magnitude. The differences in the results of the two approaches make it challenging to establish a threshold, or range of thresholds, that would constitute an MWPC for the WOMAC pain subscale for the moderate to severe OA population. However, the estimates in the simulated data set with normally distributed scores of the WOMAC pain subscale tended to be concordant in four different approaches (RMM with continuous anchor change, RMM with categorical anchor change, eCDF_median_visit, and eCDF_mean_visit). The real-life date and simulated data findings suggest that the estimates of MWPC between model-based and eCDF methods do not necessarily align in practice.
Repeated measures modeling requires a specified working correlation structure in longitudinal data. However, there is not always a simple way to determine a working correlation structure for a given analysis (Jaman et al. Citation2016; Shults et al. Citation2009; Westgate Citation2014). If all repeated measures are independent, the covariances should be close to zero, which is equivalent to a linear regression without repeated measures. In another case, if all the variances are nearly equal, and the covariances are also nearly equal, we may apply a compound symmetry structure that saves a lot of degrees of freedom with little loss of fit. But sometimes there is no reliable pattern, and so repeated measurements may be unequally spaced with variances differing considerably. In these scenarios, unstructured matrices would have a much better fit. The covariance structure in our data seemed to be more unstructured than heterogeneous autoregressive. Furthermore, the time span across visits may be uneven, which does not meet the assumption of autoregressive structure. Thus, we specified an unstructured matrix as the working correlation structure in our modeling in order to make our analyses more generic (Kincaid Citation0000). In addition, the baseline adjustment is not uncommon in the analysis of longitudinal data, but we do not recommend modifying the MWPC of COA according to the baseline values of the COA in part because of regression to the mean (Cappelleri and Cislo Citation2023).
The FDA COA Guidance has provided an example of using eCDF to supplement other anchor-based methods (U.S. Food & Drug Administration Citation2018, Citation2019). Although it is not an example with repeated measures, we may generalize it to longitudinal data. After eCDF curves are created by each visit, we recommend that it might be better to integrate them together (e.g. calculate median of eCDF-derived medians by visit) to supplement other anchor-based methods. Data from a single visit leads to a smaller sample size and a larger variation due to a lack of information from other visits.
As we found in this study, however, the estimates for MWPC between RMM model-based and eCDF methods may not necessarily align in practice even if we use the integrated eCDF data. This has also been observed in our other real-life data sets (Conaghan et al. Citation2022). The difference of estimates for MWPC by the two approaches could be explained by the fact that, unlike the eCDF-derived median, the RMM-derived mean considers all available measurements across time, integrates more information across a diverse range of COA and anchor scores, and provides more precise estimates for the MWPC (Bushmakin and Cappelleri Citation2022; Cappelleri et al. Citation2013; Fairclough Citation2010; Fitzmaurice et al. Citation2011). Furthermore, the model-based methods demonstrated more robust (narrower CIs) compared to the eCDF methods. As such, the model-based methods are expected to more accurately assess the underlying relationship between the target patient-reported outcome (PRO) measure and the anchor measure in arriving at a MWPC estimate. Thus, we recommend that the model-based methods be given preference over the eCDF methods. Our data also strongly support that the calculation of the MWPC from a single clinical trial data set may be subject to bias based on the selection of the population studied and the fact that clinical trial data in pain studies are not usually normally distributed. The disparity of the estimates for MWPC between the model-based and eCDF methods in the real-life data set was larger than that in the simulated data set in this study. Therefore, consideration should be given to the use of harmonized data sets from multiple trials and the use of simulated data procedures in the determination of the MWPC to adequately interrogate and interpret the data. In principle, it is not recommended to apply a MWPC threshold (e.g., for responder analysis) into the same trial that is used to establish the MWPC in practice.
It should be noted that the within-patient change in this study could be either improvement or deterioration, and the findings might be generalizable to data with only improvement or deterioration. In addition, a few additional limitations in this study need to be considered. First, this study did not explore other scenarios, such as small sample sizes, multiple anchors, and varying number of visits, which can be explored in future research. Second, we only generated normally distributed COA scores in the simulated data set. Future studies might investigate other circumstances when the within-patient COA change is not normally distributed (e.g. gamma) and even with heavy tails in the response distributions. Third, we conducted 1,000 iterations in the bootstrapping because we believe the number of iterations is sufficient to help us meet the study objectives. More iterations will certainly help to improve the precision of sampling distribution and narrow the width of the confidence intervals of MWPC estimates. Fourth, we assume that the anchor (and its change) categories are equally important. This assumption is supported in multiple ways by selecting a good anchor where there is substantial correlation and robust linear relationship in the changes scores between the anchor measure and the target COA measure (Griffiths et al. Citation2022) but our findings should be replicated in studies that use different anchors (e.g., transition measure) to confirm the generality of our findings. In addition, our results apply to the WOMAC multi-question primary outcome and also should be confirmed when calculating MWPC for a single question pain scale. Last, the repeated measures modeling was based upon a few assumptions that we were not able to test, such as an unstructured covariance structure of error terms for repeated measures, which is the most general structure, but requires the most parameters for estimation.
5. Conclusion
A difference between model-based and eCDF methods for MWPC estimate has been observed in practice. Our data explored the differences of the model-based anchor methods over the eCDF approach, finding that the former integrates more information across a diverse range of COA and anchor scores and provide more precise estimates for the MWPC. The different level of MWPC from the RMM modeling in the real-life data compared to the simulated data using the RMM provides important information supporting the concept that calculation of MWPC from a single study data set may not provide the best estimate. Future work comparing these methods using a greater range of data sets would be advisable to confirm our findings and more clearly identify how best to define a consistent MWPC.
Author contributions
Study concept and design: JR, AB, PC, JC, RD & JF; Data source: AB, LA & JC; Statistical analysis and simulation: JR AB, PC, & JC; Manuscript draft and review: JR, AB, PC, LA, JC, RD & JF.
Data sharing
Upon request, and subject to review, Pfizer will provide the data that support the findings of this study. Subject to certain criteria, conditions and exceptions, Pfizer may also provide access to the related individual de-identified participant data. See https://www.pfizer.com/science/clinical-trials/trial-data-and-results for more information.
Statement of ethics and consent
The protocol for clinical trial (ClinicalTrials.gov Identifier: NCT02697773) was approved by an institutional review board or independent ethics committee at each participating investigational center. The study was conducted in compliance with the ethical principles of the Declaration of Helsinki and Good Clinical Practice Guidelines. All patients provided written informed consent before entering the study.
Acknowledgements
We would like to thank Sai Karanam from Eliassen Group, LLC for validating the R codes in this study.
Disclosure statement
JR, AB, PC, LA & JC are employees of and shareholders in Pfizer. RD has received in the past 5 years research grants and contracts from the US Food and Drug Administration and the US National Institutes of Health, and compensation for serving on advisory boards or consulting on clinical trial methods from Abide, Acadia, Adynxx, Analgesic Solutions, Aptinyx, Aquinox, Asahi Kasei, Astellas, AstraZeneca, Biogen, Biohaven, Boston Scientific, Braeburn, Cardialen, Celgene, Centrexion, Chromocell, Clexio, Collegium, Concert, Confo, Decibel, Dong-A, Editas, Eli Lilly, Ethismos (equity), Eupraxia, Exicure, Glenmark, Gloriana, Grace, Hope, Immune, Lotus, Mainstay, Merck, Mind Medicine (also equity), Neumentum, Neurana, NeuroBo, Novaremed, Novartis, Olatec, OliPass, Pfizer, Phosphagenics, Quark, Reckitt Benckiser, Regenacy (also equity), Relmada, Sangamo, Sanifit, Scilex, Semnur, SIMR Biotech, Sinfonia, SK Life Sciences, Sollis, SPRIM, Teva, Theranexus, Toray, Trevena, Vertex, Vizuri, and WCG. JF has received in the past over the past 5 years reports grants from NIH-NIDDK – U01 Grant (CoI), grants from NIH-NINDS – U24 Grant (PI), and an FDA-BAA Contract; and compensation for serving on advisory boards or consulting on clinical trial methods from Pfizer, Daiichi Sankyo, Cara Therapeutics (DSMB), Biogen, Opioid Post-Marketing Consortium, NIH-NIA (DSMB), Analgesic Solutions, Novartis, Aptinyx, DepoMed, Jansen, Evadera, Eli Lilly, and Vertex.
Additional information
Funding
Notes
1. ©1996 Nicholas Bellamy. WOMAC® is a registered trademark of Nicholas Bellamy (CDN, EU, USA).
References
- Bushmakin, A. G., J. C. Cappelleri. 2022. A Practical Approach to Quantitative Validation of Patient-Reported Outcomes: A Simulation-based Guide Using SAS. Hoboken, New Jersey: John Wiley & Sons.
- Cappelleri, J. C., and P. R. Cislo. 2023. Special issue PRO-Analysis of clinically meaningful change on patient-reported Outcomes: Renewed insights about covariate adjustment. Journal of Biopharmaceutical Statistics 2023:1–14. doi:10.1080/10543406.2023.2237115.
- Cappelleri, J. C., K. H. Zou, A. G. Bushmakin, J. M. J. Alvir, D. Alemayehu, T. Symonds. 2013. Patient-reported Outcomes: Measurement, implementation and interpretation. Boca Raton, Florida: Chapman & Hall/CRC Press.
- ClinicalTrials.gov. 2021. Efficacy and safety of a subcutaneous tanezumab titration dosing regimen in subjects with moderate to severe osteoarthritis of the hip or knee. Secondary Efficacy and Safety of a Subcutaneous Tanezumab Titration Dosing Regimen in Subjects with Moderate to Severe Osteoarthritis of the Hip or Knee. https://clinicaltrials.gov/ct2/show/NCT02697773.
- Conaghan, P. G., R. H. Dworkin, T. J. Schnitzer, F. Berenbaum, A. G. Bushmakin, J. C. Cappelleri, L. Viktrup, and L. Abraham. 2022. WOMAC meaningful within-patient change: Results from three studies of Tanezumab in patients with moderate-to-severe osteoarthritis of the hip or knee. The Journal of Rheumatology 49 (6):615–621. doi:10.3899/jrheum.210543.
- Coon, C. D., and J. C. Cappelleri. 2016. Interpreting change in scores on patient-reported outcome instruments. Ther Innov Regul Sci 50 (1):22–29. doi:10.1177/2168479015622667.
- Coon, C. D., and K. F. Cook. 2018. Moving from significance to real-world meaning: Methods for interpreting change in clinical outcome assessment scores. Quality of Life Research: An International Journal of Quality of Life Aspects of Treatment, Care and Rehabilitation 27 (1):33–40. doi:10.1007/s11136-017-1616-3.
- Crosby, R. D., R. L. Kolotkin, and G. R. Williams. 2003. Defining clinically meaningful change in health-related quality of life. Journal of Clinical Epidemiology 56 (5):395–407. doi:10.1016/s0895-4356(03)00044-1.
- Crosby, R. D., R. L. Kolotkin, and G. R. Williams. 2004. An integrated method to determine meaningful changes in health-related quality of life. Journal of Clinical Epidemiology 57 (11):1153–1160. doi:10.1016/j.jclinepi.2004.04.004.
- Dworkin, R. H., D. C. Turk, M. P. McDermott, S. Peirce-Sandner, L. B. Burke, P. Cowan, J. T. Farrar, S. Hertz, S. N. Raja, B. A. Rappaport, et al. 2009. Interpreting the clinical importance of group differences in chronic pain clinical trials: IMMPACT recommendations. Pain. 146(3):238–244. doi:10.1016/j.pain.2009.08.019.
- Efron, B., and R. Tibshirani. 1986. Bootstrap methods for standard errors, confidence intervals, and other measures of statistical accuracy. Statist Sci 1 (1):22. doi:10.1214/ss/1177013815.
- Fairclough, D. L. 2010. Design and analysis of Quality of life studies in clinical trials. 2nd ed. Boca Raton, Florida: Chapman & Hall/CRC Press.
- FDA. 2018. Select, Develop or Modify fit-for-Purpose clinical Outcomes assessments. Secondary Select, Develop or Modify Fit-For-Purpose Clinical Outcomes Assessments.
- FDA. 2019. Patient-focused drug development guidance series for enhancing the incorporation of the patient’s voice in medical product development and regulatory decision making. Secondary Patient-Focused Drug Development Guidance Series for Enhancing the Incorporation of the Patient’s Voice in Medical Product Development and Regulatory Decision Making.
- Fitzmaurice, G. M., N. M. Laird, and J. H. Ware. 2011. Applied longitudinal analysis. Hoboken, New Jersey: John Wiley & Sons.
- Griffiths, P., J. Sims, A. Williams, Cella, D., Brohan, E., and K. Cocks. 2022. How strong should my anchor be for estimating group and individual level meaningful change? A simulation study assessing anchor correlation strength and the impact of sample size, distribution of change scores and methodology on establishing a true meaningful change threshold. Quality of Life Research: An International Journal of Quality of Life Aspects of Treatment, Care and Rehabilitation. doi:10.1007/s11136-022-03286-w.
- Jaeschke, R., J. Singer, and G. H. Guyatt. 1989. Measurement of health status. Ascertaining the minimal clinically important difference. Controlled Clinical Trials 10 (4):407–415. doi:10.1016/0197-2456(89)90005-6.
- Jaman, A., M. A. Latif, W. Bari, and A. S. Wahed. 2016. A determinant-based criterion for working correlation structure selection in generalized estimating equations. Statistics in Medicine 35 (11):1819–1833. doi:10.1002/sim.6821.
- Kincaid, C. Guidelines for selecting the covariance structure in mixed model analysis. Secondary Guidelines for Selecting the Covariance Structure in Mixed Model Analysis.
- McLeod, L. D., C. D. Coon, S. A. Martin, S. E. Fehnel, and R. D. Hays. 2011. Interpreting patient-reported outcome results: US FDA guidance and emerging methods. Expert Review of Pharmacoeconomics & Outcomes Research 11 (2):163–169. doi:10.1586/erp.11.12.
- Pinheiro, J., D. Bates, S. DebRoy. 2021. Nlme: Linear and nonlinear mixed effects models. Secondary Nlme: Linear and Nonlinear Mixed Effects Models.
- Rai, S. K., J. Yazdany, P. R. Fortin, and J. A. Avina-Zubieta. 2015. Approaches for estimating minimal clinically important differences in systemic lupus erythematosus. Arthritis Research & Therapy 17 (1):143. doi:10.1186/s13075-015-0658-6.
- Revicki, D., R. D. Hays, D. Cella, and J. Sloan. 2008. Recommended methods for determining responsiveness and minimally important differences for patient-reported outcomes. Journal of Clinical Epidemiology 61 (2):102–109. doi:10.1016/j.jclinepi.2007.03.012.
- Schnitzer, T. J., R. Easton, S. Pang, D. J. Levinson, G. Pixton, L. Viktrup, I. Davignon, M. T. Brown, C. R. West, and K. M. Verburg. 2019. Effect of Tanezumab on joint pain, physical function, and patient global assessment of osteoarthritis among patients with osteoarthritis of the hip or knee: A randomized clinical trial. JAMA 322 (1):37–48. doi:10.1001/jama.2019.8044.
- Shults, J., W. Sun, X. Tu, H. Kim, J. Amsterdam, J. M. Hilbe, and T. Ten-Have. 2009. A comparison of several approaches for choosing between working correlation structures in generalized estimating equation analysis of longitudinal binary data. Statistics in Medicine 28 (18):2338–2355. doi:10.1002/sim.3622.
- Speck, R. M., R. Yu, J. H. Ford, D. W. Ayer, R. Bhandari, and K. W. Wyrwich. 2021. Psychometric validation and meaningful within-patient change of the migraine-specific Quality of life questionnaire version 2.1 electronic patient-reported outcome in patients with episodic and chronic migraine. Headache 61 (3):511–526. doi:10.1111/head.14031.
- U.S. Food & Drug Administration. 2018 Select, develop or modify fit-for-purpose clinical outcomes assessments. Secondary Select, Develop or Modify Fit-For-Purpose Clinical Outcomes Assessments.
- U.S. Food & Drug Administration. 2019. Patient-focused drug development guidance series for enhancing the incorporation of the patient’s voice in medical product development and regulatory decision making. Secondary Patient-Focused Drug Development Guidance Series for Enhancing the Incorporation of the Patient’s Voice in Medical Product Development and Regulatory Decision Making.
- Westgate, P. M. 2014. Criterion for the simultaneous selection of a working correlation structure and either generalized estimating equations or the quadratic inference function approach. Biometrical Journal Biometrische Zeitschrift 56 (3):461–476. doi:10.1002/bimj.201300098.