
 ?Mathematical formulae have been encoded as MathML and are displayed in this HTML version using MathJax in order to improve their display. Uncheck the box to turn MathJax off. This feature requires Javascript. Click on a formula to zoom.
ABSTRACT
The COVID-19 pandemic quickly became a political and health communication crisis whose impact varied by geographic location in the United States. Although local television is known to be an important source of public information, little is known about how it covered the pandemic. We analyze the volume and content of local TV coverage of masks from 758 stations across all 210 U.S. media markets in the first 22 months of the pandemic to assess how often news mentions masks and the extent to which mask wearing is framed as a contentious issue by highlighting controversy and partisan cues. Overall, we find widespread but variable attention to masks throughout the pandemic at levels frequently matching or exceeding the initial coverage of the CDC recommendation to wear face coverings. Controversial coverage of face masks peaks in late summer 2021 at roughly 23%, amid the rise of the new Delta variant, although partisan controversy comprises a relatively small portion of mask-related television news. Case rates, population size and density of the market, and partisanship of the local area are associated with volume and content of mask coverage, but these relationships vary over time. We also find evidence that stations owned by the Sinclair Broadcasting Group air fewer stories about masks and more controversy including partisan conflict in their mask coverage. The results add further support to the notion that the messaging surrounding COVID-19 on television varies in part based on geographic location and corresponding demographics but may also vary based upon ideological commitments of station owners.
Introduction
A wealth of research has documented the challenges of communicating complex information – scientific findings and policy recommendations – to the public (Jamieson et al., Citation2017; Lupia, Citation2015). These challenges are difficult under normal circumstances, let alone when the science is rapidly emerging, which may require adjustments and changes in recommendations to align with the latest evidence, and scores of studies have identified politicization as being particularly problematic for building and maintaining adherence to scientific guidelines and public trust in health experts (Fowler & Gollust, Citation2015; Hart & Nisbet, Citation2012; Lupia, Citation2015; Suhay & Druckman, Citation2015). One might expect – and in fact, some pre-pandemic literature did suggest – that when the consequences of failing to follow scientific guidelines are literally a matter of life or death, that politicization would not manifest. Yet the COVID-19 pandemic quickly became a political and health communication crisis in the U.S. – with elite partisans taking opposing views on the severity of the threat and how to address it (Gadarian et al., Citation2022; Gollust et al., Citation2020; Lilleker et al., Citation2021).
Importantly, the crisis began just as Americans were becoming aware of the threat and before most policy measures (including school and business closures) were implemented to slow the spread in the U.S. (Gollust et al., Citation2020; Rafkin et al., Citation2021). Both the health communication and political communication fields have identified these early periods of issue emergence as being particularly influential, because early coverage establishes media framing that influences opinions and both frames and opinions may be more difficult to change in later phases (Chong & Druckman, Citation2007; Fowler et al., Citation2012). Once politicization emerges, prior work has shown it to be a persistent feature of news coverage (Fowler & Gollust, Citation2015; Fowler et al., Citation2012), which can have consequences for public opinion and decrease uptake of recommended health behaviors. Therefore, it should not be surprising that partisan differences among the American public in attitudes and behaviors in response to the pandemic also emerged early on (Gadarian et al., Citation2021), likely as a consequence of exposure to politicized messaging.
A wide range of scholarship has focused on public opinion surrounding policies and individual mitigation behaviors (e.g., Gadarian et al., Citation2022; Lazer et al., Citation2020) in addition to examining the spread of and perceptions of misinformation surrounding COVID-19 and how to combat it (e.g., Nielsen et al., Citation2020; Nyhan et al., Citation2021; Ognyanova et al., Citation2021). Multiple cross-national studies have confirmed deep polarization in COVID-19 attitudes (Mordecai & Connaughton, Citation2020) and trusted sources of information (Nielsen et al., Citation2020) in the United States that is greater than in most other advanced democracies. Prior work has explicitly analyzed pandemic-era media coverage, with a particular focus on politicization, in national news coverage on television (Hart et al., Citation2020; Muddiman et al., Citation2020) and in regional newspapers (Hart et al., Citation2020). Less is known, however, about how local television news covered the pandemic, which is a notable gap because local TV news remains a prominent and trusted information source for most Americans (Gottfried & Liedke, Citation2020) and about COVID-19 in particular (Hamel et al., Citation2021), and COVID-19 mitigation recommendations varied based on local transmission rates.
Coverage of federal agency recommendations may not have been uniform on local news stations, and since the recommendations were intentionally different depending upon whether transmission in an area was low or high, coverage of mask-wearing guidelines on local news may have been particularly important in whether or not citizens understood the guidelines and changes and how they applied to their situation. The Centers for Disease Control and Prevention (CDC) stated as late as March 2020 that healthy people did not need to wear masks, before reversing course and issuing guidance in early April 2020 to recommend them with a focus on areas most hit. It is possible that such recommendations may have been covered differently in different places. There is evidence that conflicting information in and of itself can present challenges for encouraging health behaviors and attitudes to align with expert recommendations (Nagler et al., Citation2021). Therefore, the fact that mask-wearing became politicized makes it even more important to understand news coverage and variations in news coverage across the country on this important issue. This might shed further light on where and when coverage may be prone to exacerbate difficulties in communicating evidence-based recommendations.
As a first step in understanding volume, content, and variation in local television news coverage of the pandemic, we identify coverage of masks on stations affiliated with the four major networks from February 2020 through November 2021. We quantify the extent to which local coverage of face masks is politicized, measured both as the extent to which such coverage is presented as a controversial topic (Lupia, Citation2015) and the extent to which it contains partisan cues in controversial coverage (Fowler & Gollust, Citation2015). We assess the correspondence that volume and politicization have with COVID-19 case rates over time, as well as the extent to which coverage varies by other factors about the audiences in each media market.
Background & Theoretical Context
Scholarly attention to politicization of health issues has skyrocketed since deep partisan divides became evident in the very early stages of the COVID-19 pandemic. Although politicization itself is often not well-defined in even some of the most prominent studies, prior work (Fowler et al., Citation2022; Saulsberry et al., Citation2019) has identified at least three dimensions of the concept in the wider literature: (1) a focus on controversy and conflict, (2) the inclusion of a partisan dimension to controversy, and (3) the exploitation of the inherent uncertainty of science. As a previous assessment of politicization noted (see Fowler et al., Citation2022), these definitions are typically employed in isolation (if at all), and an emphasis on controversy and conflict surrounding scientific evidence or recommendations is generally considered to be a necessary condition for politicization since work that employs the second two dimensions typically describe them as amplifiers of conflict or controversy. For the purposes of this analysis, we define politicization in news about masking using two of the three dimensions – emphasis on controversial or conflicting contentFootnote1 and the presence of partisan cues in controversy.Footnote2 We measure both types of politicization because prior work has found both to be influential and neither to be more pernicious, although more work on effects is needed (Fowler et al., Citation2022). We discuss these measurement decisions in the methods section.
Concerns over and interest in the politicization of science, however, are not new (Bolsen & Druckman, Citation2015; Gauchat, Citation2015; Hart & Nisbet, Citation2012; Lupia, Citation2014; Motta, Citation2018; Suhay & Druckman, Citation2015). Although some argue that politicization is and has always been infused into the field of public health (Goldberg, Citation2012), empirical work suggests a range of deleterious consequences of politicization including divergent policy action, declining trust in scientists, reduction in funding of the scientific enterprise, and ignoring the advice of specific experts (like scientists or doctors) (Fowler & Gollust, Citation2015; Hart & Nisbet, Citation2012; Lupia, Citation2014; Suhay & Druckman, Citation2015). As such, the presence of politicized controversy over scientific recommendations during the early stages of the pandemic was a cause of great concern.
Research examining regional newspapers and national, nightly network television news during the early stages of the pandemic found highly politicized (measured as prevalence of partisan actors) coverage in newspapers in particular (Hart et al., Citation2020). Other work focusing on TV news (nightly network and cable) during the same period concluded that nationally broadcast news outlets frequently appeared to “put profit and partisanship over public health” (Muddiman et al., Citation2020, p. 1). More specifically, FOX News and MSNBC were more likely to feature partisans than health officials and more likely to mention the opposing partisan perspective; while national network news was more likely than cable news to stoke fear (Muddiman et al., Citation2020). Evidence suggests that sustained explosions of media attention (otherwise known as media storms (Boydstun et al., Citation2014)) affects public attention, and also that Americans notice conflicting information conveyed in media, with nearly 75% of the national population in 2020 reporting having heard disagreement among health experts, politicians, or both regarding COVID-19 information and recommendations (Nagler et al., Citation2020).
Prior news content analyses of multiple issues would suggest that politics and political framing is likely to “stick” once it has been infused into the debate (Fowler & Gollust, Citation2015; Nagler, Fowler & Gollust, Citation2015). Competitive framing – where various actors compete to define the terms and parameters of social issues – evolves over time and is often most consequential during the early stages of new emerging issues when opinions and attitudes are most malleable (Chong & Druckman, Citation2007). News media production processes value conflict and controversy as a way to court audiences (Graber & Dunaway, Citation2017; Patterson, Citation1993). Conflict and competition can increase interest and attention among the public in electoral contexts (Blais, Citation2000; Darr & Dunaway, Citation2018; Flavin & Shufeldt, Citation2015), but from a health and science perspective, journalist preference for controversy can further fuel and amplify conflict even on issues with strong scientific consensus (e.g., Boykoff, Citation2008), raising doubt about the conclusions. In addition, evidence from panel studies suggests that prior exposure to conflicting information can carry over to make individuals less receptive to health guidance on unrelated issues (Nagler et al., Citation2021), which raises the stakes for why exposure to widespread conflicting information about COVID-19 may matter: such exposure could jeopardize other public health efforts and recommendations.
The Case for Examining Local TV Coverage of Masks
Masks are particularly divisive among the public, with partisanship being highly predictive of attitudes on masks (Lang et al., Citation2021; van Kessel & Quinn, Citation2021), as well as mask wearing (Kahane, Citation2021; Milosh et al., Citation2020). Importantly, however, as mentioned previously, partisan conflict on masks was not the only communication challenge. Scientific recommendations on face coverings also changed (sometimes quickly) over the course of the pandemic. Initially, the CDC and the Surgeon General explicitly discouraged the public from buying and wearing masks, calling them ineffective and suggesting they be reserved for health care professionals (Safarpour et al., Citation2022). In early April 2020, however, the CDC made an explicit recommendation that Americans wear cloth or fabric face coverings when they go out in public with a particular emphasis on the areas with a large number of coronavirus cases (although it was also during this announcement that Trump emphasized that mask wearing was voluntary and that he would likely not participate) (Tucker et al., Citation2020). The CDC continued to strengthen and update its mask recommendations throughout the fall of 2020, and even recommended double masking in February 2021 before changing course to say that masks were optional for the vaccinated in mid May 2021. The CDC reversed course once more, amid the rise of the Delta variant (late July), to recommend universal indoor masking again and updated guidelines in fall of 2022 to encourage higher quality, high-filtration masksFootnote3 (the CDC had said early in 2022 that N95s and KN95s offered the best protection without an explicit recommendation to wear them (Edwards, Citation2022)). In short, conflicting information may have come from partisan elites, from changes in scientific recommendations and/or from the fact that such recommendations were also intended to be variable by level of community transmission, which requires interpretation and updating.
Understanding how exactly messaging about mask recommendations varied by community and whether coverage was actually responsive to changing conditions of local transmission or highlighted conflicts consistently, however, requires a focus on local media. TV news and local television in particular remains a critical source of health information for most Americans (Gollust et al., Citation2019), and local news has been cited as a top source for COVID-19 information specifically (Hamel et al., Citation2021; Nagler et al., Citation2020). As guidance on face coverings continued to change over the course of the pandemic, the framing of mask information on local news may have been particularly important to the public’s understanding of and reaction to the scientific recommendations. Finally, an examination of local television news coverage of changing guidelines provides an informative test of existing theories of news coverage in part because it provides ample variation but also extends prior work to the local level. We therefore turn our attention next to the theoretical contribution.
Theoretical Context: Media Storms, Norms of News Production, and Local Factors
In addition to building on the theoretical traditions of competitive framing, our analysis is also informed by and contributes to larger theoretical literatures on media storms, the norms of news production, and the role of local context in building local news agendas. Theories of media attention and norms of news production both suggest that the volume and content of news coverage can be understood as a function of a variety of factors even if “for most events and issues, most of the time, news coverage is out of proportion with their “objective importance” (Boydstun & Russell, Citation2016, p. 7). Boydstun (Citation2013) highlights that the skew and explosiveness of news that is sustained – later termed a media storm (Boydstun et al., Citation2014) – is predicted by a range of factors including key triggering events, policy issues with high policymaker attention, high amounts of public concern, multiple frames being available and low media congestion when the media is both in patrol watchdog mode (where they are constantly surveilling the landscape for potential problems) and in alarm mode (where they attend to the most pressing crisis or fire alarm). The COVID-19 pandemic clearly checked all of the boxes of criteria to be a media storm (perhaps the ultimate media storm): it was a worldwide crisis so global in size, it featured an explosive increase in news coverage of the outbreak that then was met with sustained attention by policymakers and the public that was mirrored across all media ecosystems. And as Boydstun et al. (Citation2014) outline, media storms function differently than non-storm coverage: While non-storm coverage can be very explosive on a day-to-day basis, there is much less variation day-to-day during a media storm. Although masks are just one aspect of the overall media storm, policymaker attention to masks as a mitigation strategy along with the challenges of obtaining personal protective equipment is likely to have made coverage of masks a likely and ongoing topic in news.
Two additional points are important to make: since the scope and scale of the COVID-19 pandemic are quite unprecedented in the modern media area, an analysis of the COVID-19 media storm may yield additional insights about the duration of attention within a super-storm. In addition, analyses of media storms typically focus on larger, elite media, and so turning to local news provides a helpful way to examine how well theories of storms hold up across varied outlets across different geographies that were all experiencing the same global event but sometimes also with drastically different local conditions that varied over time.
To further help us understand how local television news coverage and politicization of masks may vary across the country, we draw on the literature of news production and norms of journalism. More specifically, a long literature suggests that news media are both a business seeking to attract an audience and a political institution with well-established norms and routines that lead to some predictability in terms of coverage (Cook, Citation1998; Graber & Dunaway, Citation2017; Hamilton, Citation2004; McManus, Citation1995). Economic considerations in news are often paramount to business survival and therefore these literatures suggest that news will consider its audience (in the case of local news, the demographics of the media market). Both the economic incentives and the norms of journalism lead local media to be more attentive to stories that have a big impact and are “close to home” (Branton & Dunaway, Citation2009; Fowler et al., Citation2012; Graber & Dunaway, Citation2017). In other words, proximity of events matters as more proximate issues and events can also affect the likelihood that a story will have an impact on the intended audience, which may also interact with features of the local demographics (like the fact that COVID-19 was more easily transmitted in dense, urban settings than in rural ones). An additional and persistent feature of news production that fits with the norms of journalism and economic incentives is the tendency to use more dramatic or conflict-driven coverage as a way to court audiences (Branton & Dunaway, Citation2009; Graber & Dunaway, Citation2017; Patterson, Citation1993), but similar to how proximity and local demographics interact in shaping volume, the same interactions may influence inclusion of controversy. Finally, the news production and economic models of journalism remind us that just like the local audience matters, so do individual characteristics of media outlets, such as organizational and ownership structure (Branton & Dunaway, Citation2009; Dunaway, Citation2008).
By bringing the literature on media storms together with the insights of news production, norms of journalism and local context, we believe that there is much to learn about how news volume and content differ across geography, station and time. Having provided a broad overview of each of these literatures, we now turn to our specific expectations.
Although little is known about local television news coverage of the pandemic, the literature on news production leads us to several expectations about how the volume and politicized content of local news coverage of masks might vary. First, because local news is responsive to proximal local events (Branton & Dunaway, Citation2009; Fowler et al., Citation2012; Graber & Dunaway, Citation2017), we expect that there will be a relationship between case counts and volume of news coverage. This is underscored in the context where CDC guidance about mask wearing explicitly depends on local transmission rates. Although overall we expect case counts to positively correlate with news coverage of mitigation strategies (in this case, masks), we do not necessarily expect a linear relationship. In particular, with respect to volume of attention, we might find more attention to masks during periods of low and high transmission due to discussions about mask requirements ending (in low periods) and more urging of their use (during high periods) than during moderate transmission periods when masks may not be as newsworthy (see H1 below). With respect to politicization, we might also expect to find a nonlinear relationship between case rates and controversy. Just as debate over whether masks are needed may rise as cases rise, when rates climb high enough and the local emergency becomes more severe, we might expect controversy to die down compared to the more moderate transmission periods (H2). However, we caution that in the absence of strong prior evidence, alternative expectations might also be considered plausible, and we discuss an alternative specification in the results section. Since most of our hypotheses refer to multiple outcomes (volume, controversy, and partisan controversy), we index sub-hypotheses for each individual outcome using the letters v (volume), c (controversy), and p (partisan controversy).
H1:
We expect a U-shaped relationship between (v) discussion of masks (volume) and case rates.
H2:
We expect an inverse U-shaped relationship between (c) controversy and(p) partisan controversy and case rates
In line with the proximity factor, the norms of journalism also suggest that stories which have a strong impact on the viewing audience are more likely to be covered (Graber & Dunaway, Citation2017). Since population density was an important factor in the speed and spread of the disease and public opinion data suggests that mask wearing was more prominent in populous areas (Lazer et al., Citation2021), we expect that mask coverage will be higher in populous areas where social distancing is harder and mask wearing is more important compared to rural markets. Although the tendency to emphasize drama and conflict is a characteristic of news generally (Branton & Dunaway, Citation2009; Graber & Dunaway, Citation2017; Patterson, Citation1993), prior work has also suggested that larger, more populous markets face stiffer competition for attention and respond by being even more sensational (Althaus & Trautman, Citation2008; Vinson, Citation2003). As such, we expect that we may find more politicization (i.e., controversy, and controversy with partisan cues) in larger markets than in smaller ones. Given that the need for masking is greater in areas with higher population density, whereas the expectation with regard to TV market competition relates to raw population, we propose two hypotheses:
H3:
We expect greater (v) volume in markets with greater population density.
H4:
We expect greater (c) controversy, and (p) partisan controversy in markets with greater population size.
Models of news-making acknowledge that partisan and ideological biases – often driven by profit motives – are likely to shape the production of news (Gentzkow & Shapiro, Citation2010; Mullainathan & Shleifer, Citation2005). Based on the national news analysis by Muddiman et al. (Citation2020), we know that the partisan-leaning cable news outlets were most likely to feature politicized coverage and critiques of opposing partisans. Although local television news draws viewers from both sides of the aisle (and is more trusted than cable news (Hamel et al., Citation2021)), the make-up of any particular local television news station’s audience is likely to be related to the partisanship of the television viewers in the local media market and the ownership of the individual stations. Because news outlets depend upon audiences for business, we might expect that stations in markets that skew more Democratic or more Republican or those that are simply more partisan overall regardless of lean (i.e., less competitive electorally) may differ in coverage from those markets with a more even split between partisans. Whereas one could make a number of different arguments about whether pro-Trump areas may be more or less likely to pay attention to masks relative to those areas who support Democrats, we do expect that pro-Trump areas may be more likely to cover mask politicization as a way of catering to pro-Trump audiences. Partisanship also relates back to the previous point – market population density. While more densely populated markets aren’t necessarily just cities (they can still include rural areas), they usually are. Given that cities skew liberal and rural areas conservative, and that cities are inherently at a greater risk due to ease of transmission, the schism between Democrats and Republicans on mask-wearing is inextricably tied to the urban/rural cleavage. Given that mask mandates impose an equal burden on the populations of urban and rural areas, but have a greater upside for people living in cities, it is plausible that this results in resentment which further adds economic incentives for broadcasters to air controversial content on masks in Trump-leaning (meaning rural) markets. We note that the effects we’re expecting are net of the other factors, for which our statistical models control. This does mean that unexpected results are possible, but since we use 2-tailed tests, opposing findings will still be detected.
H5:
We expect greater (c) controversy and (p) partisan controversy in markets with a larger share of Trump voters.
There are clear expectations for local TV in areas that are competitive electorally. Since journalists are predisposed to cover conflict and areas that are competitive are more likely to have competitive messaging surrounding politics and policies, we expect that both the volume and politicization of mask stories will be higher in competitive areas than in areas that are less competitive electorally.
H6:
We expect greater (v) volume, (c) controversy, and (p) partisan controversy in markets that are more competitive electorally.
Ownership of local television news has been identified as being particularly important in shaping the quality of its coverage (Branton & Dunaway, Citation2009; Dunaway, Citation2008), and recent work has also identified Sinclair Broadcasting Group in particular as being more conservative in its content, with consequences for public opinion (Levendusky, Citation2021; Martin & McCrain, Citation2019). How exactly Sinclair ownership may affect the volume of attention to masks is somewhat unclear, however, we do expect that Sinclair-owned stations, when they discuss masks, to be more likely than others to air coverage that politicizes mask wearing, given the audience to which it caters.
H7:
We expect greater (c) controversy and (p) partisan controversy in Sinclair-owned stations.
Party control over public health decisions is also likely to shape news coverage. Given the norms of journalism to privilege conflict and controversy (Graber & Dunaway, Citation2017; Patterson, Citation1993) and the nature of competitive framing (Chong & Druckman, Citation2007), we anticipate that journalists in areas where the party of the governor does not match the partisanship of the viewing audience may be more likely to discuss conflict due to the inherent tension over public health authority. More specifically, governors are invested with much of the public health authority to issue statewide mask requirements or mask bans, but if the governor’s view does not line up with the partisan lean of the residents of a particular area, conflict is more likely. Research on framing acknowledges that the framing of issues is a dynamic and evolving process through which strategic actors compete to define problems and solutions in the public sphere (Chong & Druckman, Citation2007). Local media markets with a concentration of partisans of one type that are located in a state controlled by a governor of the opposing party are more likely to have naturally occurring conflicts between mayors and governors; however, it is also possible that reporters in these areas may pay more attention to tensions between public opinion in their location and the actions of the governor. Either way, we expect that mismatches in party agreement will lead to more politicized coverage.
H8:
We expect greater (c) controversy and (p) partisan controversy in markets in which there is a mismatch between the party of the governor and the partisan lean of local voters.
Finally, the issue of masks in the pandemic is not static, and just as the scientific guidance and recommendations with respect to masks were changing, so were strategic actors (party leaders, businesses and interest groups) competing to portray mask wearing in public discourse. Media storms are dynamic and sustain themselves based on both the interest of the public as well as the actions of political elites responding to the storm (Boydstun & Russell, Citation2016). During the early stages of the pandemic, a flurry of events – and reactions to them, especially from policymakers – kept the storm going, whereas later on, attention to masks more closely resembled the punctuated equilibria outside of storms (Boydstun & Russell, Citation2016). As such, we expect to find variation in the volume and content of mask coverage over time during different pandemic phases. How exactly coverage will vary is harder to predict. However, we explore whether there were differences descriptively and in our modeling by focusing on the waves of the pandemic.
Data & Methods
Scope
Our corpus consists of closed captionsFootnote4 of local television news broadcasts, captured by the Wesleyan Media Project from the company TVEyes (https://tveyes.com/). We focus our analysis on all 758 stations that are affiliates of the major four networks (ABC, CBS, NBC, or Fox), spanning all 210 media markets (not every market has stations from all four networks). We use data from February 1, 2020 to November 23, 2021Footnote5,Footnote6. Broadcasts are not limited by the hour of the day. We have about twice as much content for each weekday as for Saturday and Sunday, but due to 7-day running averages, the same amount of information is available on each day of the week. TVEyes classifies whole programs by type, e.g. “news”, “sports”, “lifestyle”, etc. We limit our dataset to news. Furthermore, we restrict our data to local news programs only.Footnote7 The resulting corpus contains 2,267,059 documents, each consisting of a program’s worth of closed caption text.
Story Identification
Not all news content is related to our topic of interest, and unlike newspaper databases, individual stories are not easily identifiable in local television news, especially given the challenges and variance in closed caption quality. We select mask-related content by searching for the following pattern in any documentFootnote8:
MATCH: mask*, face cover*, face shield*
NOT MATCH: gas mask(s), mask their pain, mask his pain, mask her pain
We segment content into stories by tokenizing the text (i.e. splitting the text into individual words) and selecting the token(s) matching this pattern, as well as 50 words to either side.Footnote9 If the 50 words on either side contain another keyword hit, the boundary gets extended by another 50 words, until no more additional keywords are found. If two such sections overlap, we merge them.Footnote10 Our corpus contains 3,590,779 such token spans, which we refer to as stories.Footnote11,Footnote12 At the station or national level of aggregation, this variable is a 7-day moving average, which we also refer to as “volume.”
Measurement – Dependent Variables
Operationalizing Politicization
Despite the growth in studies assessing the politicization of science, the concept of politicization itself is often ill-defined and/or differs from study to study. There are at least three dimensions identified in prior literature (Fowler et al., Citation2022; Saulsberry et al., Citation2019):
The extent to which an issue is controversial (Lupia, Citation2015),
The extent to which partisan politics are infused into the debate (Fowler & Gollust, Citation2015), and
The extent to which the inherent uncertainty of science is exploited to cast doubt on scientific consensus (Bolsen & Druckman, Citation2015).
The commonality across all three dimensions is that discussions are public and contested (Fowler et al., Citation2022). It is important to acknowledge that these definitions differ from the approach of Hart et al. (Citation2020), building on Chinn et al. (Citation2020), who define politicization as “the prominence of political actors in coverage” (p. 682). This definition leads them to count all coverage mentioning political actors and/or parties as politicized. We believe this definition and measurement strategy is too broad as it lacks the defining element of conflict or controversy (or public debate) held in common across most of the literature on politicization (Bolsen & Druckman, Citation2015; Fowler & Gollust, Citation2015; Lupia, Citation2015).
It is our contention that elected officials, particularly governors or mayors can be referenced in policy coverage generally (and in our case in coverage of mask mandates and other mitigation strategies or responses more specifically) without references to conflict and that these mentions on their own (without controversy) should not be counted as politicization. For example, news often covers announcements of new policy proposals, upcoming policy changes that might affect beneficiaries, and/or factual information about policy recommendations guidelines including partisan figures or cues without the inclusion of politicized controversy. These sort of informational stories containing factual discussions of policy recommendations advanced by elected officials with partisan labeling and/or discussion of bipartisan efforts to bring about change may certainly affect how people view the content because of the partisan cues. But this should not be conflated with politicization per se that requires explicit attention to debate or conflict. We expand on potential consequences of our measurement choice below and in the discussion section.
Due to the inherent challenge in separating coverage of scientific uncertainty from coverage questioning the certainty of scientific evidence in this particular case, we chose to focus our analysis of politicization on (1) the extent to which coverage featured conflict and controversy and (2) the extent to which controversial coverage featured partisan cues as described below.
(1) Controversy. Similar to story selection, we rely on a keyword-based approach to measure controversy in stories. We classify any story as being related to controversy if it contains at least one of the following tokens:Footnote13,Footnote14,Footnote15
controvers*, disagree*, disput*, debat*, question*, dissent*, battl*, fight*, attack*, argu*, enemies, enemy, tension, heated, hotly, conflict*, contested, contentious*, contempt*, showdown, rift, wrath, explod*, erupt*, divis*, divide*, scorn*, angry, anger, opponent*, opposition, struggl*, clash*, bicker*, competing
We aggregate controversy from the story level to either the station or national level by summing over stories classified as controversial. The variable used in the analysis is a 7-day moving average, including the current day, as well as the three before and after.
(2) Partisan Cues To find instances of partisan cues being discussed in the context of mask stories, we search for tokens matching the following patterns:
Democrat*, Biden, Pelosi, Schumer, Harris, DFL,Footnote16 D-NPLFootnote17
Republican*, Trump, McCarthy, McConnell, Pence, GOP
The variable “Controversy + Partisan” used in the results section describes stories that are defined as controversial as described above and also contain a reference to either a Democrat, a Republican, or both. Although it is still possible that our method will capture some instances of controversy where the partisan actor is not directly implicated, we believe that the restriction to stories that also contain controversy make it less likely, especially because stories discussing conflict may still shape perceptions of partisan actors. In this way, our definition emphasizes the presence of partisan cues in particular, rather than any reference to politicians. Therefore, we count both national party leaders who are the most widely known (and for whom partisanship is likely to be known even without a party label attached) along with references to the two major parties.
Like the controversy variable, this is also a two-sided 7-day moving average. To test the validity of our measures of controversy, partisan cues, and controversy + partisan (as well as the story selection itself), we conducted human validation on 200 randomly selected stories. The results of this validation can be found in Appendix B. To illustrate what the stories classified as controversial, partisan, both, or neither look like, in Appendix C, provides some examples.
Measurement – Independent Variables
COVID Case Counts
We utilize The New York Times county-level counts of new COVID-19 cases per dayFootnote18,Footnote19,Footnote20 These numbers are then aggregated (summed) to the market-level, before computing a two-sided 7-day moving average.Footnote21 In the models, we use a quadratic term for case counts, given that we expect a U-shaped (or inverse U-shaped) relationship.Footnote22
Market Population
To incorporate information on the population size of the media market, we draw on data from the 2018 American Community Survey (ACS) available from IPUMS. Taking a crosswalk from county to media market, we aggregate county-level information to the media market. Population is expressed in millions.
To operationalize the population density of the media market, we rely on county-level Census dataFootnote23 based on the ACS, and then aggregate up to the media market. This measure is expressed as population per square kilometer.
Political Orientation
To measure the political leaning of the market, we rely on Donald Trump’s 2016 (given that the 2020 elections had not happened yet for part of our time series) presidential election vote share, based on David Leip’s Atlas of U.S. Presidential Elections.Footnote24 We also construct a “folded” version of presidential vote share to operationalize the level of one-party dominance in a market (defined as ), which ranges from 0 (partisans from both parties evenly balanced) to 50 (one-party dominance).Footnote25
Sinclair Ownership
As prior evidence suggests that Sinclair Broadcasting Group shifts the content of stations it owns rightward with consequences for public opinion (Levendusky, Citation2021; Martin & McCrain, Citation2019), we incorporate an indicator of whether a particular station is owned by Sinclair based on data from BIA Kelsey.
State Party Control versus Local Audience
To measure the extent to which the partisanship of the governor lines up with the party views of the majority of the residents in each market, we employ a “partisan agreement” variable that is 1 if (a) the governor is Republican and the vote share for Trump in the market was greater than Clinton’s or (b) if the governor is a Democrat and the vote share for Trump in the market was less than Clinton’s, and 0 otherwise.
Additional Controls
As the COVID-19 pandemic has disproportionately affected health and social outcomes for people of color and older adults in the US (Moore et al., Citation2020; Romano et al., Citation2021), we include controls for the percentage of the population that is nonwhite, under 18, and seniors (over 65) in the market. In addition, we also include a control for the percentage of residents with some college education.
Pandemic Waves
We also estimate stratified models to assess model predictors in different phases of the pandemic, based on local minima of case counts in the national trend data – as following: Wave 1 (February 1 to June 9, 2020), Wave 2 (June 10 through September 12, 2020), Wave 3 (September 13, 2020 to July 4, 2021), and Wave 4 (July 5 to November 23, 2021).
Descriptive and Statistical Analysis
We present descriptive statistics and then employ a multivariate modeling approach to test our hypotheses. For the latter, we estimate linear mixed-effects models to predict the volume and content of coverage with random intercepts for national network, media market, and date (we cannot use fixed effects because of variables such as population that are constant within units) using the R package lme4. This allows us to account for variance caused by factors such as network effects, market-specific idiosyncrasies and events that we cannot model through covariates.
Results
Local TV Coverage of Masks: Descriptive Findings
How often and to what extent does local television news cover the issue of face masks? And how does the volume and politicization (i.e., proportion of controversy and controversy with partisan cues) vary with coverage of masks? displays the daily range, average and standard deviation of the main variables of interest at the station-level. As noted in the table, the volume of mask stories ranges from 0 to nearly 80 per station per day with an average of 7.32 and a standard deviation of 6.82. Mask stories containing controversy range from 0 to just over 30 stories, but the average per day is much lower, just over one story per day accounting for an average of 15% of mask stories, whereas controversial stories incorporating partisan cues are even rarer (an average of two percent per day). These averages move around throughout the different waves (data not shown) with wave three seeing the fewest mask stories per day on average overall (an average of six) and wave two seeing the most (an average of twelve) with waves one and four approaching seven. Controversy, on the other hand, is most prominent in wave four, accounting for 17% of coverage compared to 14 in wave two, and 13 in waves one and three.
Table 1. Summary statistics for the main variables of interest. The unit of analysis is the station-day level.
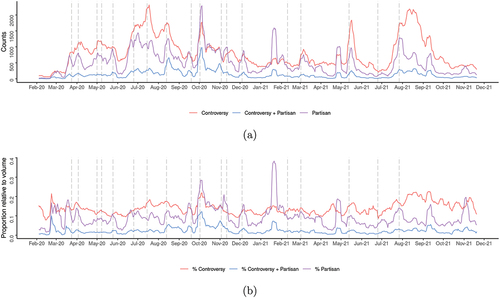
displays the over time raw counts of COVID cases, volume of mask and volume of controversy coverage in the top plot, and controversy (either on its own (red) or when combined with partisan mentions (blue)) as a proportion of mask story volume in the bottom plot. For reference, we also insert vertical lines indicating events relevant to mask guidelines or other important political events, which are likely to be one of the biggest drivers of coverage.Footnote26,Footnote27 Overall, we see that coverage of masks on local TV is a consistent feature of newscasts throughout the pandemic, ramping up through February and March 2020 to an initial peak in April 2020, when the CDC first recommended that masks be worn in public. The trend in volume of coverage – except for the period just after George Floyd’s murder – is positive through mid-summer 2020 before trending downward until early 2021.
Figure 1. Top plot: COVID cases, mask stories, and controversy over time. Bottom plot: controversy (either on its own (red) or in combination with partisan mentions (blue)) relative to volume – i.e. the red line in the bottom plot is the ratio between the red and blue lines in the top plot.
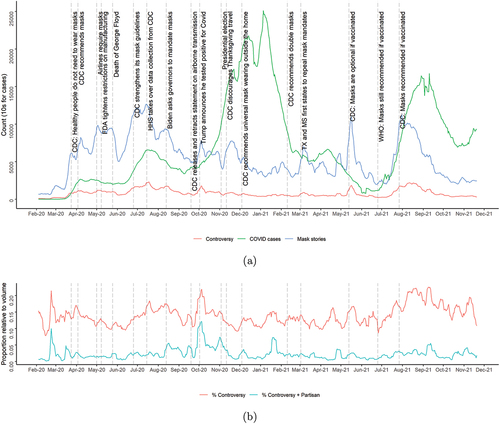
The top panel of the figure shows that most spikes in coverage of masks (blue) and controversy (red) occur at the same time as mask-related events or announcements. The point in time with the single greatest volume of mask coverage coincides with the Department of Health and Human Services taking over data collection from the CDC, which was explicitly noted to be very controversial by many mainstream sources, such as Huang and Simmons-Duffin (Citation2020); Piller (Citation2020); Stolberg (Citation2020).Footnote28 While the evidence presented here is not causal, it suggests – consistent with literature on episodic news (Branton & Dunaway, Citation2009; Fowler et al., Citation2012; Graber & Dunaway, Citation2017) – that events are a major driving force for mask coverage and mask-related controversy on television. However, even beyond spikes, the graph demonstrates that local TV attention to face coverings is a prominent story throughout the first 22 months of the pandemic.
Turning to the blue volume line’s association with cases (in green), we see initial evidence that the volume of local TV attention to face masks in the aggregate does seem to correspond to case rates in the first eight months. When coronavirus cases really explode during the third wave in fall 2020, however, a disconnect between volume of cases and attention to face masks begins to appear. Volume during 2021 fluctuates more than in earlier periods with spikes throughout the spring, a drop-off during the summer months (which did correspond again with case rates) before increasing attention in late summer as case rates due to the Delta variant picked up again and the CDC recommended masks be worn by everyone indoors.
Although the volume of mask coverage on local TV is quite prominent, coverage of controversy is comparatively much lower as shown by the red line in panel a and b, which never exceeds 25% of mask coverage. The overall volume of controversial coverage appears to vary with the volume of stories, although there is less variance, meaning that controversy is likely a larger focus of coverage when volume declines. (We will formally test these relationships in the modeling section to follow).
Turning to panel b of , as shown in the red line, one of the largest spikes in controversy occurs after Donald Trump tested positive for COVID. Even greater however, was the spike in late summer 2021, which we attribute to the Delta variant and the reversal of CDC guidance with respect to the vaccinated (from first saying masks are optional to recommending them again), as well as back-to-school coverage. Controversy pretty consistently makes up about 10 to 15% of stories mentioning masks during winter 2020 to spring 2021, with news in the summer of 2021 containing much more controversy than at any point since the presidential election in fall 2020. Examining the blue line of the panel b, partisan cues in controversial mask stories tend to rise and fall with the proportion of controversy. However, partisan cues are much more likely during the fall 2020 when Trump tested positive for COVID-19. Interestingly, partisan cues do not follow the fall 2021 uptick in proportion of controversial coverage.
Station Ownership
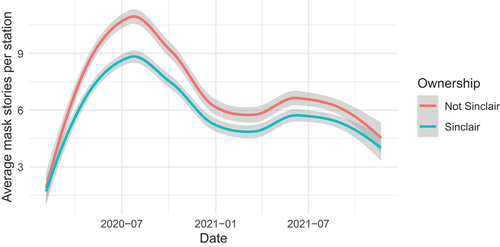
The ownership of the station also appears to be associated with the volume of mask-related content (see Appendix A for a similar discussion of audience partisanship). shows the number of mask-related stories for both the average Sinclair and non-Sinclair owned station, on a given day. The lines are created using Loess smoothing. For most of the pandemic, as shown in the figure, there is a noticeable difference between the two – Sinclair-affiliated stations tend to run fewer stories about masks per day.
Figure 2. Sinclair-owned stations have a lower average number of mask-related stories per day.
Modeling Mask Coverage and Controversy
Next, we model the relationship between volume and controversy as a function of the severity of the pandemic (measured here via logFootnote29 case rates) along with time and market characteristics to evaluate our hypotheses and formally test whether apparent patterns in the descriptive presentation of results persist when accounting for time and market factors (more specifically with covariates included along with random intercepts for the national network of the station, the media market and the date). The unit of analysis is the date-station level. Controversy and story volume are explicitly measured at the date-station level, while for the purposes of covariates such as case numbers and population, the station level is identical to the media market level. We model the relationship between case numbers and the dependent variable, using the covariates specified earlier.
In model 1 (see in Appendix C for models 1 to 5), volume is the dependent variable. Models 2 and 3 predict the volume or amount of controversy and controversial partisan coverage, and include a control for overall volume. The dependent variables in models 4 and 5 are controversy and controversy that is partisan, as a proportion of volume. This provides a measure of whether controversy in mask-related stories is higher than expected for a given level of mask-related stories.
All models include random intercepts for three variables: the network affiliate of the TV station (ABC, CBS, Fox, and NBC), the media market, and the date. The latter not only accounts for changing dynamics over the course of the pandemic, but also the event effects discussed above.
Because we employ a quadratic term for case counts, we plot the predictions in order to better understand the relationship. The association between case counts and mask stories is positive and almost linear (). When cases are at their lowest, the predicted number of mask stories is 3. At the maximum number of 24,261 new cases per day, the number of stories increases to 12. This partially conforms to our expectations expressed in H1v – high case numbers equate to high coverage, but we don’t see the expected increase in coverage as cases get very low.
Figure 3. Predicted values of controversy, for a given level of Covid case counts (cases are logged in the model, but rescaled here), with 95% confidence intervals. Corresponding regression results in .
The results of model 2 (see ) suggest a U-shaped relationship between case counts and controversy. Given that H2c predicts an inverse U-shaped relationship, this is the reverse of our expectation. There are about 1.27 controversial stories per day when cases are low. This drops to about 1 story as cases reach a medium level (about 100 cases), and then increases to up to 1.5 stories per day when cases are at their highest. Here it should be noted that while the scale for cases goes up to almost 25,000, the 90th percentile of case numbers is only 926 - meaning that most of the variation that is broadly relevant happens in the 1–1000 range. To test for higher-order nonlinearities, we also provide results from a model with a cubic term (see ). While there is some (fairly weak) evidence for nonlinear relationships with other variables, controversy retains its U-shape. When assessing the relationship between case counts and controversy as a proportion of volume, we find a mostly positive association ().
Figure 4. Predicted values of controversy, for a given level of Covid case counts (cases are logged in the model, but rescaled here), with 95% confidence intervals. Alternative model specification with a cubic instead of quadratic term for Covid cases.
Model 3 (), where the DV is volume of controversy with partisan mentions, shows a different pattern. Cases and partisan controversy are negatively correlated, and in a largely linear fashion. With cases at their lowest, there are 0.25 predicted stories per day that are both controversial and partisan. As cases reach 1000, this number decreases to 0.13. Similarly, controversy plus partisan mentions, as a proportion, is negatively and linearly related to case counts (). When cases are low, this proportion is estimated to be 0.03. As cases climb to 1000, the proportion is 0.02. While the multivariate models confirms our descriptive account that case counts and volume are positively related, it also demonstrates that the relationship between case counts and controversy is not straightforward. Support for H2p is tenuous.
Turning to the relationship between market characteristics and news coverage of masks, we find evidence that more densely populated media markets experience a greater volume of mask stories. For example, a market with a population density of about 7 people per square kilometer can expect 6 mask stories per day, while a market with a population density of 682 people per square kilometer gets an estimated 11 stories. Population size has a positive and statistically significant estimate in Model 4 (as well as Model 1), but not in Models 2, 3, and 5. Consequently, there is good evidence in favor of H3v, weak evidence for H4c, and no evidence for H4p.
How does coverage vary by partisanship and other characteristics of the viewing audience? Multivariate results here expand on our preliminary descriptive statistics regarding the relationship between partisan skew of the market audience and controversy. Partisanship (in terms of the presidential vote share) is not associated with greater controversy (with the exception of Model 2), which means little evidence in favor of H5c and none for H5p. However, the extremity (or one party dominance) of the market is negatively correlated with controversy. For example, when both parties are evenly matched, there are about 7 mask stories. When one party dominates by about 30%, the number of predicted mask stories is below 6. In other words, more moderate markets experience both a greater volume of mask stories, as well as a greater degree of controversy. This is good evidence in support of H6 (v, c, and p). There is also a strong association between the volume and content of coverage by stations owned by Sinclair Broadcasting Group. The results of Model 1 suggest that Sinclair stations are less likely than other stations to air mask stories in the first place (5 predicted stories per day for Sinclair stations, compared to 6.6 for their non-Sinclair counterparts), and controlling for other variables, when they do air coverage, Models 2, 3, 4 and 5 all indicate that Sinclair-owned stations are more likely to air stories containing controversy and controversial stories with partisan cues, whether we measure them in absolute number or in proportion (for example, non-Sinclair stations air about 1 controversial story per day, compared to 1.13 for Sinclair-owned stations). This is strong evidence in favor of H7c and H7p. Interestingly, the match between the state governor and the local viewing audience’s party lean is associated with greater coverage of masks (about which we do not have a hypothesis), and coverage of controversy (volume of controversy and proportion of partisan controversy). If anything, these results provide evidence in the opposite direction of our expectations outlined in H8c and H8p.
Turning briefly to the standard controls corresponding with key demographics affected by COVID-19, we find some evidence that age of the viewing audience is related to mask coverage. More specifically, the greater proportion of the market who are seniors, the more likely coverage is to include controversy – but not controversy including partisan cues. We also find that mask story volume is lower in markets with a greater proportion of market audience who is under 18. Education of the market audience does not appear to be relevant to coverage.
Pandemic Waves
suggests that while there is a relationship between case counts and coverage (measured through both volume and controversy), it also appears to depend on the stage of the pandemic. While the association between case counts and volume/controversy seems consistent with the overall model for the first two waves, the third wave sees a large spike in cases that is not associated with a corresponding change in TV coverage. To test the extent to which the relationship depends upon the pandemic’s waves, we estimate a separate model for each wave. The results can be found in and (in Appendix C). Here it is evident, that some of the relationships observed over the full time period change. For example, while the relationship between controversy and case counts stays at least somewhat similar to the overall model for waves 1, 2, 4 (with a U-shape), there is an inverse U-shape for wave 3 (which, unlike for the other waves, is in line with H2c). The other models also exhibit such reversals, and in some cases also for other waves.
Figure 5. Predicted values of controversy, for a given level of Covid case counts (cases are logged in the model, but rescaled here), with 95% confidence intervals, by wave. The figure shows that the third wave appears to be fundamentally different from the others, as all relationships are reversed. Full regression results in Tables A4, A5, A6, and A7.
With respect to the other variables beyond case counts, the models by wave suggest that Trump vote share matters more in the first wave than the subsequent ones. Population density of the market plays a role in shaping volume in all waves (in line with H3v, though it is only statistically significant at the 10% level for waves 1 and 2). For raw population and the controversy and controversy with partisan cues models, positive and statistically significant relationships exist, but are much more sporadic across the waves. One-party dominance is not associated with coverage in wave 1, but it is negatively associated with controversy and volume in wave 2, and then less so in waves 3 and 4 (and thus largely in line with H6 (v, c, and p). These changing results are not due to a lack of data in the wave subsets – even the shortest wave, wave 2, still has 71,155 station-day level data points. In spite of the variability that is present between the stratified wave models, none of the coefficient estimates change direction in a statistically significant way between waves. Instead, different variables that are statistically significant in the aggregate model either gain or lose statistical significance depending on the wave.
That said, there is one variable that is entirely consistent across all waves: whether a station is owned by Sinclair. Throughout all waves, Sinclair ownership is always associated with lower mask volume and greater politicization. In other words, H7 (both c and p) is the hypothesis for which we find the most reliable evidence across the entirety of the period of study. This finding and its consistency lends support to the increasing evidence that station ownership matters (Dunaway, Citation2008; Levendusky, Citation2021), and more specifically, that Sinclair owned stations air more conservative content than local television news on other stations.
Discussion & Conclusion
In this paper, we examine the volume and tenor of local television news coverage of masks in all 210 media markets in the United States for the first 22 months of the pandemic. The results demonstrate that discussion of face coverings on local television news is quite prominent throughout – with more than 25 stories a day per market (with a variance of 872) – frequently matching or exceeding the volume of attention devoted to the initial CDC recommendation that the public wear them. While the volume of mask coverage correlates positively with case rates during the first two waves, there is less correspondence during later waves. Although we can only speculate, it is possible that the novelty of vaccines during wave three plays a role in shifting media attention away from masks.
While politicization in mask stories is prevalent throughout the 22 months of coverage, it is a minority of coverage (one in every seven stories contains controversy), and only one in six of the 14.8% percent also contain a partisan cue (2.4% overall). Controversy and partisan controversy tend to correlate with increases and decreases in the volume of coverage, but are especially prominent in coverage during fall 2020 when nearly 12% of mask coverage contain both conflict and partisan cues (and more than 20% of coverage was controversial). This could have been driven by Trump testing positive for COVID-19 and the widespread discussion surrounding the wisdom of his decision to put secret service agents at risk by having them drive him around to wave at supporters, but it is also possible that the heated presidential election and Biden’s focus on the pandemic contributed to it too.
The proportion of controversy is also higher in fall of 2021 as the Delta variant raged and back-to-school debates over masking were heated (though even at its highest point in our series, controversial content does not exceed 25% of total mask coverage). Overall, however, the fact that controversy and partisan controversy is not very prominent in local television news coverage of masks is likely welcome news for those concerned about how media may contribute to politicization and its consequences, especially since we demonstrate that local news coverage is less politicized overall than network news (see descriptive statistic comparison in Appendix A) and research has shown that network news was less politicized than newspapers (Hart et al., Citation2020).
We do find evidence, consistent with the literature (Althaus & Trautman, Citation2008; Patterson, Citation1993), that the volume of attention to masks as an issue in local TV news is positively associated with the population density of a market and this effect is consistent throughout all four waves, which suggests that more densely populated markets where masks are likely to be more important as a mitigation measure do receive more coverage of the issue. There is also some evidence to suggest that population size is related to controversy, but the result is not consistent over all waves.
Our findings suggest that local television news coverage differs in volume and in politicization by the partisan distribution of the audience in a market. Overall, the extent to which one party dominates a media market appears to be associated with decreases in the volume and controversial coverage of masks, suggesting that competitive markets see more mask stories overall and more controversial stories; however, among our variables that tap into partisan features (Trump vote share, the folded, one-party dominance and party agreement with gubernatorial control), there is a fair amount of variability in the results by wave, which suggests these effects are conditional on broader social/contextual factors related to the phases of the pandemic. Normatively, higher levels of attention to important health issues, and lower controversy and partisan controversy would be ideal. Competition however increases both, which makes it a double-edged sword.
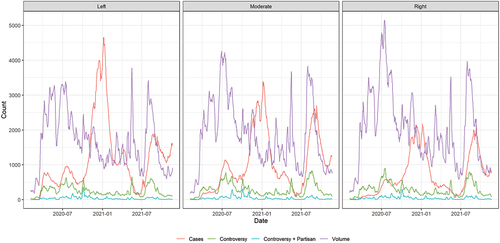
More, specifically, unequal attention to and coverage of prevention behaviors and discussion of prevention mechanisms as controversial in local television by electoral competition means that both news media and paid advertising in some markets during election season are getting saturated with messages that are more likely to compete and conflict. If competition and competing messages increases interest and attention as is often cited in the electoral context (Blais, Citation2000; Darr & Dunaway, Citation2018; Flavin & Shufeldt, Citation2015), it may mean that some markets are deprived of opportunities to hear and be informed by the discussion. Yet, on the other hand, if (from a health communication perspective) exposure to conflict and controversy may heighten negative emotional arousal, increase confusion about health behaviors and spill over into other attitudes and mitigation strategies (Fowler et al., Citation2022; Nagler et al., Citation2021), then some markets are also being spared. Qualitative and further computational methods might be helpful for future extensions of this work. For example, looking at , it is quite clear that local TV news viewers in conservative media markets experienced a different pandemic in terms of case counts and in volume of coverage. How these differences were portrayed and whether they qualitatively differed across markets would be especially helpful to understand if they might have played a role in conservatives’ reluctance to follow recommendations made by scientists.
Figure 6. Timeline of Covid case counts, mask story volume and controversy, by partisanship of media market audience, aggregated to the national level.
Finally, our results add to the growing evidence that stations owned by Sinclair Broadcast Group are distinctive among local newscasters for their conservative content (Levendusky, Citation2021; Martin & McCrain, Citation2019), which in our case means they are both less likely to discuss masks generally and more likely to discuss controversy and partisan conflict when they do cover it. Since there is robust evidence that the entry of FOX News Channel and a strong conservative ideological bent into cable news affected both the public and legislator responses (Arceneaux et al., Citation2016, Citation2020; Levendusky, Citation2021; Martin & Yurukoglu, Citation2017), the distinctive finding for Sinclair throughout the pandemic may be among the most concerning.
The phenomenon under observation here also provides an opportunity to learn more about media storms (Boydstun et al., Citation2014). With most media storms, researchers can only observe how a storm unfolds, but it is often difficult to quantify its driver. Storms can appear to be fairly irrational in the sense that the magnitude of the storm can’t be explained by the importance of the underlying issue (Boydstun & Russell, Citation2016). But importance is subjective. In the context of the pandemic, the case rate does provide us with a quantified and objective measure – which is both fine-grained and available over a long period of time. As long as the case rate is high, the storm should continue. But that is not what happens. The fact that media attention decreased as cases reached their highest point in wave 3 shows that a media storm can end even when the topic that drives it is not only still highly relevant, but in fact keeps producing events that ought to fuel the storm. Based on its quantified importance to the public interest, the end of the storm does seem to be irrational and capricious indeed. After the main storm passes in the fall of 2020 and the election-related storm that supplants it abates as well, new pandemic-related events happen, which might have revived the original storm. But this doesn’t happen, consistent with classic theories of the constrained nature of issue-attention (Downs, Citation1972), where the media have only a finite “carrying capacity” to maintain public attention (Hilgartner & Bosk, Citation1988). There are spikes of volume in 2021 and the start of what could be more sustained coverage in line with the Delta variant, but it doesn’t last long, and in general variation is much more abrupt and more consistent with the punctuated equilibria outside of storms (Boydstun & Russell, Citation2016).
In addition to learning about media storms, our data allow us to reflect on the consequences of our conceptual definitions of politicization and how they differ from alternative conceptualizations and measurement strategies. More specifically, we examine how our measures of politicization would compare to a measure similar to the one used in Hart et al. (Citation2020). Recall that our concern was conflating policy references that contain partisan cues with politicization, which by definition should include controversy (and the strategic enhancement of controversy in particular). shows how the use of partisan cues on their own relative to a narrower definition of partisan controversy might overstate politicization (we include the red lines for controversy for comparison). The purple lines show the total volume of partisan cues in mask stories (first panel) and proportion of partisan cues in mask stories (second panel).
Figure 7. Equivalent to , but with the addition of a line for partisan mentions regardless of whether they contain controversy. The purple line, compared to the blue line, shows the extent to which politicization would be overestimated if it were based on partisan mentions alone.
As can be seen clearly in both panels, the difference between the purple line (the measure used in Hart et al., Citation2020) and the blue line (our preferred measure of partisan controversy) is nontrivial and represents the amount of stories that contain partisan cues but no controversy. In our view, operationalizing politicization as partisan cues alone would dramatically overstate the number of times that partisan figures appear in news coverage that also contains controversy – more commonly than not, the purple line appears to be more than double the blue line, but can be three or four times the amount. Although partisan cues alone (regardless of whether the counts also include controversy) are often more similar to the volume of controversy, suggesting that the overall volume of politicization in our measure may be similar to the measure employed by Hart et al. (Citation2020), the two are not the same as shown clearly in of Appendix C that provides qualitative examples of coverage that fits into each category.
Coverage that includes partisan cues but not controversy include efforts by the Biden administration and specifically Jill Biden who appeared with the CDC Director and the Education Secretary on a National PTA virtual town hall urging schools and parents to take mitigation measures and masking seriously. One would be hard pressed to call that politicization since there is no mention of opposition in the story. This stands in sharp contrast to both controversy on its own, where passengers are described as refusing to wear masks on planes and public concern as reaching a boiling point, and partisan controversy, in which partisans are frequently described as involved in heated debate (for example, in the example in , the story says “some Republican lawmakers who have spoken out and rejected masks – are now doubling down”).
Perhaps most importantly, we can see clearly in the purple lines that measuring politicization through partisan cues alone will be especially prone to picking up the high volume of event-driven coverage (as indicated by the large spikes) on local television news regardless of whether that coverage contains controversy. For example, the purple lines tend to correspond to the dotted lines indicating events labeled in - like announcements of new CDC recommendations, Trump testing positive for Covid-19, and the CDC discouraging Thanksgiving travel along with more political events that are unlabeled like Biden’s pre-inauguration announcement that he would sign an executive order requiring masking on federal property and for interstate travel – all of which could be covered in a purely informational way without suggestions that the events were controversial, and that’s likely what the gap between the purple and blue line reflects. For these reasons, we recommend that the literature utilize measures of politicization that either measure controversy alone or controversy with partisan cues, which is a much smaller subset of news containing reference to political officials who are identified in stories with partisan (or presidential) labels.
These results come with a few caveats. First and foremost, the evidence presented cannot be interpreted as causal. The relationship between case rates, controversy, events and other factors is complex, and causal pathways likely point in multiple directions. Events such as CDC directives are likely a response to case counts and an attempt to address existing controversy. Conversely, events (such as promotion of mask wearing) and controversy about mask wearing likely influence actual mask wearing and thus transmission rates. Arguments could be made that this data calls for any one of a number of more elaborate models, such as time series models treating events as shocks, hierarchical models, selection models, count models, or nonparametric models. Given that we cannot implement all of these at the same time, and that the more complex and specific the model, the less useful it becomes, we opt for the simpler approach. Second, our text-based measures – of both stories and controversy – are subject to a variety of sources of error, such as errors in closed captioning, classification, or search terms. Furthermore, owing to the varied level of data quality, our methods for identifying segments intended to represent stories are less advanced than other approaches – that are able to rely on punctuation features – which means that for example, they might not be picking up controversy related to masks, but merely controversy in a 100 word-long chunk of text that also happens to mention masks (our human validation shows that this does indeed happen in some cases). Third, we don’t incorporate behavioral or attitudinal data to understand how the patterns in coverage of masks on television correspond to attitudes about masks or compliance with mask wearing. Future work should examine the relationship between news coverage and public attitudes and behaviors. Fourth, our measure of partisan cues through partisan figures only covers prominent national politicians.Footnote30 This means it is possible that we’re missing partisan controversy that originates from the local level (although this requires the story to refer to the politician by name only without Democrat/Republican, since their partisanship will be captured that way otherwise). While research shows that polarization on the pandemic was driven by national elites (Hegland et al., Citation2022; Pink et al., Citation2021), there is also evidence that the local context did matter (Druckman et al., Citation2020). This is a limitation of our research, as the omission of local partisan figures might mean that we are undercounting the share of controversial messaging that is also partisan.
Nevertheless, the data we present represent the most comprehensive assessment of local TV news coverage of one critical pandemic mitigation strategy. Our findings suggest that local TV news coverage of masks was prominent but variable throughout the pandemic, and sometimes featured controversy and partisan controversy in the stories presented to the public. Local TV coverage was responsive to local variations in case rates, suggesting that local context does matter even though we also find evidence of signature features of storm coverage. We find differences in coverage by population density, partisan differences in audience of each market and especially by station ownership that might raise concerns and additional questions about the variation in local television coverage and its effects on the public. Our analysis demonstrates that news content on local television stations is still responsive to the traditional norms of news production during intense media storms even while the widespread attention to masks appears to corroborate the lower changes in media attention of media storm theory. These findings contribute to the existing theories of news making and our understanding of the volume and content of the information that was transmitted to Americans and how it varied market-to-market over time during a media super-storm.
Acknowledgments
We thank Chris Frenier for compiling the county level data used in this analysis and Breeze Floyd for training and supervising the human coding validation set. We gratefully acknowledge support from the Robert Wood Johnson Foundation (grant no. 77645 and 79754) and the entire team at the Collaborative on Media and Messaging (COMM) for Health and Social Policy (commhsp.org). The content of this article is solely the responsibility of the authors and does not necessarily represent the official views of the Robert Wood Johnson Foundation. We also thank the participants at APSA 2021, several anonymous reviewers, and the editors for helpful comments and suggestions.
Disclosure statement
No potential conflict of interest was reported by the author(s).
Data availability statement
Restrictions apply to the availability of these data, which were used under license by the Wesleyan Media Project from TVEyes for this study. Data on volume of coverage that support the findings of this study are available from the corresponding author upon reasonable request.
Additional information
Notes on contributors
Markus Neumann
Markus Neumann was Postdoctoral Research Fellow at the Wesleyan Media Project at Wesleyan University during the analysis and drafting of this manuscript. He is currently Assistant Professor of Political Science and Computational Social Science at Duke Kunshan University. His research focuses on the application of machine learning and statistics to social science problems, in particular in political advertising.
Steven T. Moore
Steven T. Moore is Assistant Professor of Government at Wesleyan University. His research examines attitudes regarding race, racism, and inequality in the mass public, how these attitudes are reflected in media and how they shape political behavior.
Laura M. Baum
Laura M. Baum was formerly Associate Director of the Wesleyan Media Project at Wesleyan University.
Pavel Oleinikov
Pavel Oleinikov is Assistant Professor of the Practice at the Quantitative Analysis Center and Research Faculty at the Wesleyan Media Project, at Wesleyan University. His research interests include social media platforms, big-data pipelines, text mining, and remote sensing.
Yiwei Xu
Yiwei Xu is a graduate student in Communication at Cornell University. Her research examines theory-driven communication strategies that address persistent and emergent public health challenges, with the goal of promoting evidence-based policies and health equity.
Jeff Niederdeppe
Jeff Niederdeppe is Senior Associate Dean of Faculty Development in the Jeb E. Brooks School of Public Policy and Professor of Communication and Public Policy at Cornell University. His research examines the mechanisms and effects of mass media campaigns, strategic messages, and news coverage in shaping health behavior and social policy.
Neil Lewis
Neil Lewis Jr. is Associate Professor of Communication at Cornell University and Co-Director of the Cornell Action Research Collaborative. His research examines the motivational, behavioral, and equity implications of social interventions and policies.
Sarah E. Gollust
Sarah Gollust is Professor in the Division of Health Policy and Management, University of Minnesota School of Public Health. Her research examines media effects and public opinion related to health policy and public health.
Erika Franklin Fowler
Erika Franklin Fowler is Professor of Government at Wesleyan University and Co-Director of the Wesleyan Media Project. Her research examines the content, variation, and effects of media messaging in electoral and health policy settings.
Notes
1. Here we consider conflict and controversy interchangeably. Conflict could be defined as just the presence of debate or disagreement, whereas controversy also can invoke the addition of inflammatory or emotional language See, for instance, Nagler et al. (2019) who refer to conflict and controversy as a matter of degree. Since these distinctions are challenging to measure in the real world of media content reliably (as opposed to in an experimental setting), and neither our human coding nor automated coding were able to reliably distinguish the two (see Appendix B), we use the terms interchangeably in this manuscript.
2. We chose not to examine uncertainty (see Bolsen & Druckman, 2015) because in the case of COVID-19, there was legitimately a lot of uncertainty due to the fact that this was emerging science. This contrasts with other cases like climate science where scholars have argued that politicization can occur by emphasizing uncertainty on topics where there is a lot of scientific agreement. We discuss this further in the methods section.
3. See the CDC Museum COVID-19 Timeline (https://www.cdc.gov/museum/timeline/covid19.html).
4. Closed captions are transcripts of the audio. Closed captions should not be confused with chyrons, which is text displayed in the lower third of some TV broadcasts.
5. Given that we use 7-day moving averages (including the current day, as well as the three before and after) for several of our measures, the effective range is February 4, 2020 to November 20, 2021.
6. We select November 23 as our end date because the Omicron variant was first reported to the WHO on November 24, representing the start of a fifth wave. (https://www.who.int/news/item/26-11-2021-classification-of-omicron-(b.1.1.529)-sars-cov-2-variant-of-concern)
7. Our heuristic for whether a program is local is whether the maximum number of markets it has run in on any day in the time series is smaller than 8. We make one exception for “Eyewitness News at 6,” which we also classify as local because this name is used by many stations. Furthermore, we exclude anything with “national” or “world” in the title.
8. For further details on, and human validation of, our keywords, please see Appendix B.
9. 50 words is a fairly conservative (as in, small) value, to ensure that only content (and controversy) related to the mask story gets captured, as opposed to any other news content on adjacent stories.
10. We’ve experimented with different approaches to text segmentation, relying on word embeddings, topic models, and other keyword-based approaches. However, since our corpus lacks proper punctuation and capitalization, these more advanced approaches designed to respect sentence and paragraph boundaries offer few advantages (see also Tarr et al. (2022), who, similar to us, analyze transcripts of WMP content, and cite the lack of punctuation as the main reason for eschewing more advanced approaches). We found that for our corpus, our method works as well as these alternatives, and does so in a much more simple and intuitive way.
11. Occasionally the captions consist of nonsensical combinations of random characters. To remove documents that are entirely nonsensical from the dataset, we calculate the distribution of characters for every document, as well as all documents together. If the correlation between an individual document’s distribution and the distribution of the corpus is less than 0.9, we remove it. However, this is not a widespread problem so only 1,896 out of 3,592,675 documents (0.053%) get removed.
12. Readers might be concerned about the proportion of duplicate stories in our corpus. While TV stations do run some news more than once, we don’t find duplicate stories to be particularly common in our corpus. We sampled 40,000 stories (due to memory limitations) and compared them to one another with cosine similarity. Only 0.0002% of story pairs have a cosine similarity above 0.99, meaning that exact duplicates are infrequent.
13. We experimented with thresholds higher than one, but found that in aggregate, the basic substantive interpretation of the results remained similar.
14. We again experimented with more advanced techniques and found a topic model to be a somewhat reasonable alternative, but concluded that it didn’t offer any advantages, while its greater complexity only added an unnecessary point of failure. This point is underlined by van Kessel and Hughes (2019) who argue that when a list of well-theorized keywords is available for the concepts of interest, topic models offer few advantages.
15. This list was compiled by the authors by drawing heavily on Atkinson’s (2017) examples of words used in news descriptions of conflict.
16. Minnesota Democratic-Farmer-Labor Party.
17. North Dakota Democratic-Nonpartisan League Party.
19. Case counts include both confirmed and probable new cases.
20. The New York Times data comes with the caveat that the number of new cases can sometimes be negative. This happens because new cases are calculated from the difference in cumulative case counts, which may sometimes be subject to corrections from officials, for example due to backlogs.
21. The two-sided 7-day moving averages we use differ slightly from The New York Times’ own methodology for calculating moving averages, which uses 7-day trailing averages, i.e. the average of the current day and the 6 preceding days. We use two-sided moving average for the sake of consistency with our other measures.
22. in also provides results from a model with a cubic term.
25. We also experimented with an alternative operationalization of measuring political diversity by calculating the Gini coefficient of the percentage of Trump votes in the counties that make up the market. However, the coefficients of this variable in the 5 main models were all not statistically significant, and the variable also had little effect on the other results.
26. To compile a list of relevant events – especially changes in CDC guidance – we used Safarpour et al. (2022) and the CDC website itself (https://www.cdc.gov/museum/timeline/covid19.html, https://www.cdc.gov/media/releases/2020/archives.html) as a starting point.
27. Especially during the early months of the pandemic, potentially pertinent events happened almost every day (Wikipedia contributors, 2021). This makes it difficult to quantitatively estimate which events are responsible for a spike.
28. Mid-July 2020 also contained several other noteworthy events, such as CDC director Robert Redfield claiming that the pandemic could be controlled within 4–8 weeks if all Americans wore masks (Mayberry et al., 2020). Therefore, the spike cannot be attributed to just a single event.
29. For the model, we express case rates in log space because the distribution of these values has a long tail. The median value is 131.29, the mean 375.34, but the standard deviation is 835.87 and the maximum value is 24,261.
30. We made this choice because reliably searching for people in text based on their names is unreliable, as names can be ambiguous. For extremely well-known politicians this is not a problem, but for lesser known public figures, such an approach would produce many false positives.
31. False positives, uncommon as they are, include stories about topics such as beauty masks, masks in the context of wildfires, or masks in the context of crime.
References
- Althaus, S. L., & Trautman, T. C. (2008). The impact of television market size on voter turnout in American elections. American Politics Research, 36(6), 824–856. https://doi.org/10.1177/1532673X08317767
- Arceneaux, K., Dunaway, J., Johnson, M., & Vander Wielen, R. J. (2020). Strategic candidate entry and congressional elections in the era of fox news. American Journal of Political Science, 64(2), 398–415. https://doi.org/10.1111/ajps.12478
- Arceneaux, K., Johnson, M., Lindstädt, R., & Vander Wielen, R. J. (2016). The influence of news media on political elites: Investigating strategic responsiveness in congress. American Journal of Political Science, 60(1), 5–29. https://doi.org/10.1111/ajps.12171
- Atkinson, M. L. (2017). Combative politics: The media and public perceptions of lawmaking. University of Chicago Press.
- Blais, A. (2000). To vote or not to vote?: The merits and limits of rational choice theory. University of Pittsburgh Press. https://doi.org/10.2307/j.ctt5hjrrf
- Bolsen, T., & Druckman, J. N. (2015, October). Counteracting the politicization of science. Journal of Communication, 65(5), 745–769. https://doi.org/10.1111/jcom.12171
- Boydstun, A. E. (2013). Making the news: Politics, the media, and agenda setting. University of Chicago Press.
- Boydstun, A. E., Hardy, A., & Walgrave, S. (2014, October). Two faces of media attention: media storm versus non-storm coverage. Political Communication, 31(4), 509–531. https://doi.org/10.1080/10584609.2013.875967
- Boydstun, A. E., & Russell, A. (2016). From crisis to stasis: Media dynamics and issue attention in the news (Vol. 1). Oxford University Press. https://doi.org/10.1093/acrefore/9780190228637.013.56
- Boykoff, M. T. (2008, January). Lost in translation? United States television news coverage of anthropogenic climate change, 1995–2004. Climatic Change, 86(1), 1–11. https://doi.org/10.1007/s10584-007-9299-3
- Branton, R. P., & Dunaway, J. (2009). Slanted newspaper coverage of immigration: The importance of economics and geography. Policy Studies Journal, 37(2), 257–273. https://doi.org/10.1111/j.1541-0072.2009.00313.x
- Chinn, S., Hart, P. S., & Soroka, S. (2020 February). Politicization and po- larization in climate change news content, 1985-2017. Science Communication, 42(1), 112–129. Publisher: SAGE Publications Inc. Retrieved June 6, 2023. https://doi.org/10.1177/1075547019900290
- Chong, D., & Druckman, J. N. (2007). Framing public opinion in competitive democracies. American Political Science Review, 101(4), 637–655. https://doi.org/10.1017/S0003055407070554
- Cook, T. E. (1998). Governing with the news: The news media as a political institution. University of Chicago Press.
- Darr, J. P., & Dunaway, J. L. (2018, November). Resurgent mass partisanship revisited: The role of media choice in clarifying elite ideology. American Politics Research, 46(6), 943–970. https://doi.org/10.1177/1532673X17735042
- Downs, A. (1972). Up and down with ecology: The issue-attention cycle. The Public, 28, 38–50.
- Druckman, J. N., Klar, S., Krupnikov, Y., Levendusky, M., & Ryan, J. B. (2020, November). Affective polarization, local contexts and public opinion in America. Nature Human Behaviour, 5(1), 28–38. https://doi.org/10.1038/s41562-020-01012-5
- Dunaway, J. (2008, October). Markets, ownership, and the quality of campaign news coverage. The Journal of Politics, 70(4), 1193–1202. https://doi.org/10.1017/S0022381608081140
- Edwards, E. (2022, January). CDC Updates Mask Guidance, Says N95s Offer ’highest Protection’. https://www.nbcnews.com/health/health-news/cdc-updates-mask-guidelines-know-n95-kn95-masks-rcna12302.
- Flavin, P., & Shufeldt, G. (2015, October). State party competition and citizens’ political engagement. Journal of Elections, Public Opinion and Parties, 25(4), 444–462. https://doi.org/10.1080/17457289.2015.1035277
- Fowler, E. F., & Gollust, S. E. (2015, March). The content and effect of politicized health controversies. The ANNALS of the American Academy of Political and Social Science, 658(1), 155–171. https://doi.org/10.1177/0002716214555505
- Fowler, E. F., Gollust, S. E., Dempsey, A. F., Lantz, P. M., & Ubel, P. A. (2012, April). Issue emergence, evolution of controversy, and implications for competitive framing the case of the HPV vaccine. The International Journal of Press/politics, 17(2), 169–189. https://doi.org/10.1177/1940161211425687
- Fowler, E. F., Nagler, R. H., Banka, D., & Gollust, S. E. (2022, January). Chapter six - effects of politicized media coverage: Experimental evidence from the HPV vaccine and COVID-19. In T. Bolsen & R. Palm (Eds.), Progress in molecular biology and translational science (Vol. 188, pp. 101–134). Academic Press. https://doi.org/10.1016/bs.pmbts.2021.11.008
- Gadarian, S. K., Goodman, S. W., & Pepinsky, T. B. (2022). Pandemic politics: How COVID-19 exposed the depth of American polarization. Princeton University Press.
- Gadarian, S. K., Goodman, S. W., Pepinsky, T. B., & Lupu, N. (2021, April). Partisanship, health behavior, and policy attitudes in the early stages of the COVID-19 pandemic. PLOS ONE, 16(4), e0249596. https://doi.org/10.1371/journal.pone.0249596
- Gauchat, G. (2015, December). The political context of science in the United States: Public acceptance of evidence-based policy and science funding. Social Forces, 94(2), 723–746. https://doi.org/10.1093/sf/sov040
- Gentzkow, M., & Shapiro, J. M. (2010, January). What drives media slant? Evidence from U.S. Daily newspapers. Econometrica, 78(1), 35–71.
- Goldberg, D. S. (2012, January). Against the very idea of the politicization of public health policy. American Journal of Public Health, 102(1), 44–49. https://doi.org/10.2105/AJPH.2011.300325
- Gollust, S. E., Fowler, E. F., & Niederdeppe, J. (2019). Television news coverage of public health issues and implications for public health policy and practice. Annual Review of Public Health, 40(1), 167–185. https://doi.org/10.1146/annurev-publhealth-040218-044017
- Gollust, S. E., Nagler, R. H., & Fowler, E. F. (2020, December). The emergence of COVID-19 in the US: A public health and political communication crisis. Journal of Health Politics, Policy and Law, 45(6), 967–981. https://doi.org/10.1215/03616878-8641506
- Gottfried, J., & Liedke, J. (2020). Partisan divides in media trust widen, driven by a decline among republicans. Pew Research Center. Retrieved September 20, 2021 https://www.pewresearch.org/fact-tank/2021/08/30/partisan-divides-in-media-trust-widen-driven-by-a-decline-among-republicans/
- Graber, D. A., & Dunaway, J. L. (2017). Mass media and American politics (Tenth edition ed.). CQ Press.
- Hamel, L., Lopes, L., Kirzinger, A., Sparks, G., Stokes, M., & Mollyann, B. (2021). Kff COVID-19 vaccine monitor: Media and misinformation. Retrieved January 3, 2021 https://www.kff.org/coronavirus-covid-19/poll-finding/kff-covid-19-vaccine-monitor-media-and-misinformation/(KaiserFamilyFoundation)
- Hamilton, J. T. (2004). All the news that’s fit to sell: How the market transforms information into news. Princeton University Press. https://doi.org/10.1515/9781400841417
- Hart, P. S., Chinn, S., & Soroka, S. (2020, August). Politicization and polarization in COVID-19 news coverage. Science Communication, 42(5), 679–697. https://doi.org/10.1177/1075547020950735
- Hart, P. S., & Nisbet, E. C. (2012). Boomerang effects in science communication: How motivated reasoning and identity cues amplify opinion polarization about climate mitigation policies. Communication Research, 39(6), 701–723. https://doi.org/10.1177/0093650211416646
- Hegland, A., Zhang, A. L., Zichettella, B., & Pasek, J. (2022, March). A partisan pandemic: how COVID-19 was primed for polarization. The ANNALS of the American Academy of Political and Social Science, 700(1), 55–72. https://doi.org/10.1177/00027162221083686
- Hilgartner, S., & Bosk, C. L. (1988). The rise and fall of social problems: A public arenas model. American Journal of Sociology, 94(1), 53–78. https://doi.org/10.1086/228951
- Huang, P., & Simmons-Duffin, S. (2020,). White House strips CDC of data collection role for COVID-19 hospitalizations. NPR. https://www.npr.org/sections/health-shots/2020/07/15/891351706/white-house-strips-cdc-of-data-collection-role-for-covid-19-hospitalizations
- Jamieson, K. H., Kahan, D. M., & Scheufele, D., Jamieson, K. H., Kahan, D. M., Scheufele, D. A. (2017). The oxford handbook of the science of science communication. Oxford University Press. https://doi.org/10.1093/oxfordhb/9780190497620.001.0001
- Kahane, L. H. (2021, January). Politicizing the mask: Political, economic and demographic factors affecting mask wearing behavior in the USA. Eastern Economic Journal, 47(2), 163–183. https://doi.org/10.1057/s41302-020-00186-0
- Lang, J., Erikson, W. W., Jing-Schmidt, Z., & Cotfas, L.-A. (2021, April). #maskon! #MaskOff! Digital polarization of mask-wearing in the United States during COVID-19. PLoS One, 16(4), e0250817. https://doi.org/10.1371/journal.pone.0250817
- Lazer, D., Baum, M., Ognyanova, K., & Volpe, J. D. (2020, June). The COVID states project #1: A 50-state COVID-19 survey report. OSF Preprints. Retrieved September 20, 2021 https://osf.io/arwh3/
- Lazer, D., Santillana, M., Perlis, R., Quintana, A., Ognyanova, K., Green, J., … Gitomer, A. (2021, February). The COVID states project #26: Trajectory of COVID-19-related behaviors (Tech. Rep.). OSF Preprints. Retrieved March 10, 2022 https://osf.io/37jbe/
- Levendusky, M. S. (2021, April). How does local TV news change viewers’ attitudes? The case of Sinclair broadcasting. Political Communication, 0(0), 1–16. https://doi.org/10.1080/10584609.2021.1901807
- Lilleker, D., Coman, I., Gregor, M., & Novelli, E., Lilleker, D., Coman, I. A., Gregor, M., Novelli, E. (2021). Political communication and covid-19. Routledge. https://doi.org/10.4324/9781003120254
- Lupia, A. (2014, January). What is the value of social science? Challenges for researchers and government funders. PS: Political Science & Politics, 47(1), 1–7. https://doi.org/10.1017/S1049096513001613
- Lupia, A. (2015). Uninformed: Why people seem to know so little about politics and what we can do about it. Oxford University Press. https://doi.org/10.1093/oso/9780190263720.003.0020
- Martin, G. J., & McCrain, J. (2019). Local news and national politics. American Political Science Review, 113(2), 372–384. https://doi.org/10.1017/S0003055418000965
- Martin, G. J., & Yurukoglu, A. (2017, September). Bias in cable news: Persuasion and polarization. American Economic Review, 107(9), 2565–2599. https://doi.org/10.1257/aer.20160812
- Mayberry, K., Allahoum, R., & Alsaafin, L. (2020). Un Chief Warns Coronavirus Could Set World Back for Years: Live. Retrieved July 14, 2020 https://www.aljazeera.com/news/2020/7/14/un-chief-warns-coronavirus-could-set-world-back-for-years-live(AlJazeera)
- McManus, J. (1995). A market-based model of news production. Communication Theory, 5(4), 301–338. https://doi.org/10.1111/j.1468-2885.1995.tb00113.x
- Milosh, M., Painter, M., Sonin, K., Van Dijcke, D., & Wright, A. L. (2020, November). Unmasking partisanship: Polarization undermines public response to collective risk ( SSRN Scholarly Paper No. ID 3664779). Social Science Research Network. https://doi.org/10.2139/ssrn.3664779
- Moore, J. T., Ricaldi, J. N., Rose, C. E., Fuld, J., Parise, M., Kang, G. J., … Westergaard, R. (2020, August). Disparities in incidence of COVID-19 among underrepresented racial/ethnic groups in counties identified as hotspots during June 5–18, 2020 — 22 States, February–June 2020. MMWR Morbidity and Mortality Weekly Report, 69(33), 1122–1126. https://doi.org/10.15585/mmwr.mm6933e1
- Mordecai, M., & Connaughton, A. (2020). Public Opinion About Coronavirus is More Politically Divided in U.S. Than in Other Advanced Economies. Retrieved September 20, 2021 https://www.pewresearch.org/fact-tank/2020/10/28/public-opinion-about-coronavirus-is-more-politically-divided-in-u-s-than-in-other-advanced-economies/
- Motta, M. (2018, May). The dynamics and political implications of anti- intellectualism in the United States. American Politics Research, 46(3), 465–498. https://doi.org/10.1177/1532673X17719507
- Muddiman, A., Budak, C., Romas, B., Kim, Y., Murray, C., Burniston, M. M., Geiger, J., Purcell, A., Ludzenski, J., Turner, M., Duchovany, M., & Stroud, N. J. (2020). Cable and Nightly Network News Coverage of Coronavirus. Center for Media Engagement. https://mediaengagement.org/wp-content/uploads/2020/12/Cable-and-Nightly-Network-News-Coverage-of-Coronavirus-2.pdf
- Mullainathan, S., & Shleifer, A. (2005). The market for news. The American Economic Review, 95(4), 1031–1053. https://doi.org/10.1257/0002828054825619
- Nagler, R. H., Fowler, E. F., & Gollust, S. E. (2015, July). Covering controversy: What are the implications for women’s health? Women’s Health Issues, 25(4), 318–321. https://doi.org/10.1016/j.whi.2015.04.011
- Nagler, R. H., Vogel, R. I., Gollust, S. E., Rothman, A. J., Fowler, E. F., Yzer, M. C., & Liu, S. Y. (2020, October). Public perceptions of conflicting information surrounding COVID-19: Results from a nationally representative survey of U.S. adults. PLOS ONE, 15(10), e0240776. https://doi.org/10.1371/journal.pone.0240776
- Nagler, R. H., Vogel, R. I., Gollust, S. E., Yzer, M. C., & Rothman, A. J. (2021, August). Effects of prior exposure to conflicting health information on responses to subsequent unrelated health messages: Results from a population-based longitudinal experiment. Annals of Behavioral Medicine, 56(5), 498–511. https://doi.org/10.1093/abm/kaab069
- Nagler, R. H., Yzer, M. C., & Rothman, A. J. (2019, August). Effects of media exposure to conflicting information about mammography: Results from a population-based survey experiment. Annals of Behavioral Medicine, 53(10), 896–908. https://doi.org/10.1093/abm/kay098
- Nielsen, R. K., Fletcher, R., Newman, N., Brennen, J. S., & Howard, P. N. (2020). Navigating the ‘infodemic’: How people in six countries access and rate news and information about coronavirus. Reuters Institute.
- Nyhan, B. J., Carey, J. M., Guess, A., Phillips, J. B., Loewen, P. J., Merkley, E., & Reifler, J. (2021, August). The ephemeral effects of fact-checks on COVID-19 misperceptions: Evidence from the United States, Great Britain, and Canada. OSF Preprints. Retrieved September 20, 2021 https://osf.io/yezgv/
- Ognyanova, K., Lazer, D., Baum, M., Druckman, J., Green, J., Perlis, R. H., … Uslu, A. (2021, August). The COVID states project #60: COVID-19 vaccine misinformation: From uncertainty to resistance. OSF Preprints. Retrieved September 20, 2021 https://osf.io/xtjad/
- Patterson, T. (1993). Out of order. A. Knopf.
- Piller, C. (2020, October). The Inside Story of How Trump’s COVID-19 Coordinator Undermined the World’s Top Health Agency. https://www.science.org/content/article/inside-story-how-trumps-covid-19-coordinator-undermined-cdc.
- Pink, S. L., Chu, J., Druckman, J. N., Rand, D. G., & Willer, R. (2021, August). Elite party cues increase vaccination intentions among Republicans. Proceedings of the National Academy of Sciences, 118(32), e2106559118. https://doi.org/10.1073/pnas.2106559118
- Rafkin, C., Shreekumar, A., & Vautrey, P.-L. (2021). When guidance changes: Government stances and public beliefs. Journal of Public Economics, 196, 104319. https://doi.org/10.1016/j.jpubeco.2020.104319
- Romano, S. D., Blackstock, A. J., Taylor, E. V., El Burai Felix, S., Adjei, S., Singleton, C.-M., Fuld, J., Bruce, B. B., & Boehmer, T. K. (2021). Trends in racial and ethnic disparities in COVID-19 hospitalizations, by region — United States, March–December 2020. MMWR Morbidity and Mortality Weekly Report, 70(15), 560–565. https://doi.org/10.15585/mmwr.mm7015e2
- Safarpour, A., Quintana, A., Lazer, D., Perlis, R., Baum, M., Ognyanova, K., … Qu, H. (2022, January). The COVID States Project #78: American Mask Use and CDC Guidance. https://doi.org/10.31219/osf.io/j53u2
- Saulsberry, L., Fowler, E. F., Nagler, R. H., & Gollust, S. E. (2019, August). Per- ceptions of politicization and HPV vaccine policy support. Vaccine, 37(35), 5121–5128. https://doi.org/10.1016/j.vaccine.2019.05.062
- Stolberg, S. G. (2020, July). Trump administration strips C.D.C. of control of coronavirus data. The New York Times.
- Stryker, J. E., Wray, R. J., Hornik, R. C., & Yanovitzky, I. (2006, June). Validation of database search terms for content analysis: The case of cancer news coverage. Journalism & Mass Communication Quarterly, 83(2), 413–430. https://doi.org/10.1177/107769900608300212
- Suhay, E., & Druckman, J. N. (2015, March). The politics of science: Political values and the production, communication, and reception of scientific knowledge. The ANNALS of the American Academy of Political and Social Science, 658(1), 6–15. https://doi.org/10.1177/0002716214559004
- Tarr, A., Hwang, J., & Imai, K. (2022, November). Automated coding of political campaign advertisement videos: An empirical validation study. Political Analysis, 1–21. https://doi.org/10.1017/pan.2022.26
- Tucker, E., Miller, Z., & Schneider, M. (2020, April). Face Coverings Recommended, but Trump Says He Won’t Wear One. https://apnews.com/article/health-donald-trump-ap-top-news-virus-outbreak-understanding-the-outbreak-227fa2d005b3923157b9eb736c12e6c5.
- van Kessel, P., & Hughes, A. G. (2019). Semi-supervised topic models for political rhetoric and survey open-ends. APSA 2019 Presentation.
- van Kessel, P., & Quinn, D. (2021). Both Republicans and Democrats Cite Masks as a Negative Effect of COVID-19, but for Very Different Reasons. https://www.pewresearch.org/fact-tank/2020/10/29/both-republicans-and-democrats-cite-masks-as-a-negative-effect-of-covid-19-but-for-very-different-reasons/
- Vinson, C. D. (2003). Local media coverage of congress and its members: Through local eyes. Hampton Press.
- Wikipedia contributors. (2021). Timeline of the COVID-19 Pandemic — Wikipedia, the Free Encyclopedia. Retrieved September 21, 2021 https://en.wikipedia.org/w/index.php?title=TimelineoftheCOVID-19pandemic&oldid=1043813526
Appendix A
- Additional Analyses
Controversy and Partisan Cue Co-Occurrence
Because controversy and party cues can occur independently, contains a cross-tabulation of controversial and partisans stories. Out of nearly 3.6 million stories in total, 14.8% are controversial. Out of the controversial stories, 16.4% also mention a party or partisan figure, while 83.6% do not. This ratio is much smaller among non-controversial stories, where only 8% contain a partisan mention.
As noted earlier, although our primary interest is in local television coverage, we also have data on national network news programs. Since these are broadcast in every market and thus contain a lot of duplicate broadcasts in our data, we focus only on the three national network evening news programs – “NBC Nightly News With Lester Holt,” “CBS Evening News With Norah O’Donnell,” and “ABC World News Tonight With David Muir” broadcasts aired on three stations in New York City (WNBC, WABC, and WCBS). shows the national network equivalent of . Here, the overall proportion of controversial coverage of masks is much higher, at 26.4%, compared to 14.8%. Furthermore, controversial coverage at the national level also contains a greater proportion of partisan cues − 30.4% of controversial coverage, compared to 16.4% at the local level.
Audience Partisanship
To get a sense for how local TV coverage varies by partisanship of the audience, shows case counts, mask stories and various measures of controversy over time by primarily Democratic markets, moderate markets, and primarily Republican markets. The two most notable patterns in this plot are the large differences in case counts by market partisanship (in red) and the difference in mask story volume (in purple). Taking story volume first, there is more coverage of masks in right-leaning markets early on in the pandemic compared to both moderate and especially left-leaning markets. Case counts are largest in liberal media markets and smallest in conservative ones. This is consistent with the greater spread of COVID-19 in cities, which tend to be more liberal. This discrepancy in case counts makes differences in the level of controversy in coverage even more plausible, as audiences are likely to differ not only in their opinions about the proper response to the pandemic, but also the objective reality of COVID-19 impact. However, few such differences in controversy coverage are evident in the plot – controversy and partisan mentions appear to differ little across panels by the partisanship of a media market’s audience.
Alternative Specification - Cubic Term for Cases
The main model uses a quadratic term for case counts in order to allow for nonlinear effects, in particular the hypothesized (inverted) U-shape. Since alternative expectations of higher-order nonlinearities are also plausible, provides results from a model with a cubic rather than quadratic term for case counts. While additional nonlinearities are evident, the overall relationships don’t change drastically compared to .
Measuring Politicization
Compared to Hart et al. (2020), who operationalize politicization through partisan references alone, we rely on controversy plus partisan references. (the counterpart of ), shows the extent to which politicization would be overestimated if it were based on partisan mentions alone.
Appendix B
- Validation
Keyword Selection
We arrived at the keywords for story selection by evaluating the quality of our searching phrases on content retrieved by them during the March to June 2020 period using an iterative process with two criteria: recall (how well the search phrases can accurately call up all relevant items) and precision (whether the search phrases can avoid calling up irrelevant items) (Stryker et al., 2006). We then followed the keyword searching and validation procedure suggested by Stryker and colleagues in three stages. At Stage I, we defined story relevance and manually selected our universe of relevant hits. Specifically, the research team watched 180 news clips and manually marked news content that is relevant to our topic of interest. At Stage II, we developed and refined searching phrases with random sub-samples drawn from the universe of hits (the 180 news clips from Stage I). We started with some “open” search terms (i.e., mask, face cover, face shield), with the goal of getting a high recall rate first. We used the search phrases to identify hits and then manually compared those to the human coded clips to get the recall and precision rates. We did four rounds of calibration in total, and each round included 20 randomly drawn hits. Before each new round of calibration, we revised the search phrases based on the previous round of recall and precision results. During Stage III, we did a formal validation test using a new and large random sample. On a validation dataset (with the other unused 100 manually marked clips), this approach yields a precision of 96% and a recall of 99%.Footnote31
Validating Masks, Controversy, and Partisan Cues
Given the variety of computational methods we use to measure our core concepts (i.e., mask stories, controversy and partisan controversy), we sought to validate our measures with human coding. To do so, we trained a set of four coders to evaluate 200 stories (defined by the 50 word boundary surrounding a mask key word hit) on the following items: 1) Does this text segment mention masks in the context of the COVID-19 pandemic? 2) Does the text segment contain controversy? 3) Does it contain partisan cues or leaders? 4) Is any of the controversy partisan in nature? 5) Is the controversy (partisan or not) about masks/Covid/pandemic-related actions? 5.1) Is the controversy about masks? We ask both 5 and 5.1 because we realized that it was often challenging to determine whether controversy in the story was about masks specifically or about pandemic-related actions more broadly, and since even the broader conflict can affect perceptions and behaviors surrounding masks, we believe that even the broader category is important.
Performance
To evaluate inter-coder reliability, we double-coded 40 stories (though for some stories, not all questions were coded since some of the later questions were not presented to the coders if they answered ’No’ earlier) and calculated Krippendorff’s alpha. Alphas are 0 for Q1 (this happens because of a quirk in Krippendorff’s alpha when all but one units (39 out of 40 in this case) are coded the same way (’yes’) by both coders, so Krippendorff’s alpha becomes 0 even though ICR is extremely high), 0.66 for Q2, 1.0 for Q3, 0.78 for Q4, 0.69 for Q5, and 0.7 for Q5.1.
Performance of the automated approach compared to the human coding is evaluated in terms of precision (to minimize false positives) and recall (to minimize false negatives). For Q1, 96% of the stories the model considered to be related to Covid masks were in fact related to them (this measure is effectively precision). Since we’re only evaluating stories that the keyword search has identified as being mask-related, recall is not defined for this question. For controversy alone (Q2), precision is 71% and recall is 59%. For partisan mentions (Q3), precision is 100% and recall 96%. For controversy and partisan (Q4) precision is 76% and recall is 58%. For controversy that is explicitly focused on masks (Q5.1) precision is 51% and recall is 58%. Q5 doesn’t have a direct counterpart in the automated coding, but if we simply compare it to the automated predictions of controversy (which are assumed to be pandemic-related), precision is 61% and recall 59%.
Inter-coder reliability and validation performance for Q1 are unequivocally good. We conclude from this that our story selection method, with the mask keyword in the middle, and 50 words to either side, works well. For partisan mentions (Q3), ICR and validation performance are similarly high. Evidently, this is a fairly easy task to automate with keywords, and the only potential for error comes from alternate spellings. The controversy-related questions on the other hand (Q2, Q4, Q5.1) were harder, for both humans and our keyword-based method. The bar for what constitutes controversy can be conceptually challenging, and we ultimately decided to lower the threshold for what counted as controversial to also include mere disagreement (even if it had happened in a fairly polite manner) as this allowed for a more consistent application of the coding rules across different stories. This is likely part of why recall is only 59% for Q2 – the human coders had a lower threshold for what counted as controversial than the automated approach.
Appendix C
- Tables
Table A1. Prevalence of controversy and partisan cues in local TV mask stories.
Table A2. Prevalence of controversy and partisan cues in national network mask stories.
Table A3. Regression table for models across the full time series. The models differ in the way they control for the volume of mask stories, and whether the dependent variable is controversy alone, or stories that are both controversial and also include partisan mentions. Model 1 is a model of volume itself, models 2 and 3 are based on (7-day average) counts and control for volume, and for 4 and 5, the dependent variable is analogous to 2 and 3, but as a proportion of volume. All models include random intercepts for the national network of the TV station, the media market, and the date.
Table A4. Regression table for models across the first wave of the pandemic. The models differ in the way they control for the volume of mask stories, and whether the dependent variable is controversy alone, or stories that are both controversial and also include partisan mentions. Model 1 is a model of volume itself, models 2 and 3 are based on (7-day average) counts and control for volume, and for 4 and 5, the dependent variable is analogous to 2 and 3, but as a proportion of volume. All models include random intercepts for the national network of the TV station, the media market, and the date.
Table A5. Regression table for models across the second wave of the pandemic. The models differ in the way they control for the volume of mask stories, and whether the dependent variable is controversy alone, or stories that are both controversial and also include partisan mentions. Model 1 is a model of volume itself, models 2 and 3 are based on (7-day average) counts and control for volume, and for 4 and 5, the dependent variable is analogous to 2 and 3, but as a proportion of volume. All models include random intercepts for the national network of the TV station, the media market, and the date.
Table A6. Regression table for models across the third wave of the pandemic. The models differ in the way they control for the volume of mask stories, and whether the dependent variable is controversy alone, or stories that are both controversial and also include partisan mentions. Model 1 is a model of volume itself, models 2 and 3 are based on (7-day average) counts and control for volume, and for 4 and 5, the dependent variable is analogous to 2 and 3, but as a proportion of volume. All models include random intercepts for the national network of the TV station, the media market, and the date.
Table A7. Regression table for models across the fourth wave of the pandemic. The models differ in the way they control for the volume of mask stories, and whether the dependent variable is controversy alone, or stories that are both controversial and also include partisan mentions. Model 1 is a model of volume itself, models 2 and 3 are based on (7-day average) counts and control for volume, and for 4 and 5, the dependent variable is analogous to 2 and 3, but as a proportion of volume. All models include random intercepts for the national network of the TV station, the media market, and the date.
Table A8. Example stories that are either controversial, partisan, both, or neither. The words that lead to the classification are printed in bold.