
 ?Mathematical formulae have been encoded as MathML and are displayed in this HTML version using MathJax in order to improve their display. Uncheck the box to turn MathJax off. This feature requires Javascript. Click on a formula to zoom.
ABSTRACT
The mobility of an Unmanned Aerial Vehicle (UAV) offers significant benefits when deploying remote Non-Destructive Testing (NDT) inspections of large-scale assets. Ultrasonic inspection is primarily a contact-based NDT method, that grants the opportunity to remotely monitor the structural health of an industrial asset with enhanced internal integrity information. Presented in this paper is an implementation of an autonomous UAV system, equipped with an ultrasonic thickness measurement payload. This system is designed to conduct ultrasonic inspections of non-magnetic facilities and industrial infrastructure where surface adhesion cannot be achieved magnetically. Operating within a laboratory environment, this system autonomously positioned the transducer on a vertically mounted, unpainted, aluminium sample and completed an ultrasonic thickness measurement without manual intervention. An onboard laser scanner provided instantaneous UAV alignment and standoff error measurements versus the sample’s surface normal vector. While inspecting a region of the aluminium sample with 12.92 mm nominal thickness, the UAV system demonstrated a measurement error of 0.03 mm. During this process, the standard deviation of the craft’s positional error was recorded to be below 63.26 mm, accompanied by an angular alignment error versus the surface normal vector of below 2.71°. The accuracy of the UAV deployed inspection, including thickness measurement accuracy and positional accuracy, depends on many factors. As such, transducer alignment constraints, electrical noise and UAV stability are investigated and discussed. Findings from this paper may be taken to inform future research regarding autonomous airborne ultrasonic inspection of constructed infrastructure and industrial facilities.
1. Introduction
A UAV (Unmanned Aerial Vehicle) is a pilotless aerial robot system, generally comprised of a flight controller, navigation and communication systems and a functional payload. Their mobility and size provide UAVs with the ability to effectively undertake many laborious or dangerous tasks, such as NDT (Non-Destructive Testing) evaluations of live power lines [Citation1,Citation2] and concrete crack detection in bridges [Citation3]. UAVs provide an airborne approach to inspect high-altitude and high-risk sites such as offshore wind turbine blades and selected areas within nuclear facilities which conventionally require inspectors to work in the presence of radiological safety hazards.
Traditionally, the UAVs for NDT inspections deploy a sensing payload with a relatively large standoff distance to avoid collisions and near-surface aerodynamic challenges [Citation4,Citation5]. Photogrammetric inspection is one such approach whereby UAVs equipped with a high-resolution camera evaluate the surface condition of the target object [Citation6]. This technique has been demonstrated by many commercial industrial inspection services [Citation7]. In some cases, it has been expanded to include information available outside the visible light spectrum [Citation8]. Thermographic inspection is another non-contact evaluation technique. It focuses on using a thermal camera to monitor heat distribution in damaged or worn structures or, in more sophisticated cases, to observe infrared absorption spectra specific to a leaking gaseous hydrocarbon [Citation9]. A further example of thermographic inspection lies in solar panel defect detection [Citation10]. The photogrammetric and thermographic measurements, however, are only capable of identifying prominent near-surface and surface-exposed defects. They therefore represent forms of visual inspection and are heavily influenced by environmental conditions and hardware setups. Additionally, such technologies are not sensitive to incipient damage and are inadequate to determine early-stage defects hidden underneath a surface coating [Citation11,Citation12].
Ultrasonic measurement is an inspection technology, used to determine internal support material corrosion or fatigue crack formation beneath an exposed outer surface [Citation12,Citation13]. In doing so, pressure wave packets are transmitted into the sample. Reflection signals from discontinuities in the material are then captured and analysed to assess structural defects. The relative amplitude of these signals and instrumentation noise, expressed as the Signal to Noise Ratio (SNR), strongly influences measurement accuracy. Contact-based ultrasonic inspections grant higher SNR compared to the contactless air-coupled measurements [Citation14]. This remains problematic as long as existing UAVs fly only at comparatively large standoff distances from the target object. It is also highly challenging to manually pilot a UAV with sufficient accuracy to perform a close-range inspection whilst maintaining an appropriate contact force and alignment for a conventional transducer to operate successfully. To this end, R. Mattar et al. demonstrated an early prototype of a wall-sticking, manually piloted UAV for ultrasonic corrosion mapping of metallic storage tanks [Citation15]. Mattar et al. mounted an ultrasonic transducer, accompanied by an electromagnet, at the tip of an extended arm. They utilised an onboard microcontroller to control the electromagnet and generated around 530 N adhesive force to ensure the ultrasound probe remained in stable contact and acoustically coupled to the tank wall. However, the system is only capable of conducting thickness measurements of ferromagnetic structures. Other non-magnetic materials, such as aluminium, cannot support the required adhesive force. A further attempt at UAV deployed ultrasonic inspection is presented by R. Jarvis et al., placing an EMAT (Electromagnetic Acoustic Transducers) onto two industrial samples (a ferromagnetic plate and pipe) with a manually piloted UAV [Citation16]. The authors measured wall thicknesses of these two samples with a limited success rate: 65% in the case of the plate, dropping to 60% for the pipe. The unsuccessful deployments occurred when the landing trajectory was not perpendicular to the target surface and translational momentum cause the probe to topple over after making contact. B, Kocer et al. developed an ultrasonic system with a non-linear controller to conduct thickness measurements of a ceiling using a commercial ultrasonic transceiver [Citation17]. The authors focused on the flight controller design to achieve stable flight and exert force on the ultrasonic transducer. The inspection accuracy was about 10% of the nominal thickness.
Currently, UAV deployed ultrasonic thickness measurement systems are being prototyped by a selection of industrial inspection companies [Citation18,Citation19]. Most current literature is focused on the measurement of ferromagnetic structures, with the notable omission of consideration for significant infrastructure, buildings and bridges composed of non-magnetic materials (e.g. concrete, aluminium, titanium and a variety of composites). These materials lack the susceptibility to magnetic force necessary to ensure the transducer remains on the inspection surface. Recently published examples of UAV based ultrasonic measurement systems focus on flight control theory, using commercially available ultrasonic inspection payloads. Herein, a custom transceiver was designed and fully integrated into the UAV system, granting additional flexibility for future research.
Thus, this paper presents a UAV system, integrated with an ultrasonic thickness measurement payload capable of assessing surfaces without relying on magnetic adhesion, demonstrated against an aluminium target with no susceptibility to magnetic force. The system is autonomously stabilised and guided for ultrasonic inspection of both large metallic storage vessels and other non-magnetic industrial assets. A laser scanner onboard the UAV determines the craft’s standoff distance and alignment offset relative to the inspection surface while measurements are obtained using a 5 MHz split-crystal ultrasonic transducer and on-board ultrasonic transceiver circuitry. Air gaps between the transducer and sample cause impedance mismatch and reduce the efficiency of energy transmission. To transmit more ultrasonic energy into the sample, a small quantity of couplant gel is applied between the transducer and inspection surface, as is common in conventional inspection. The transducer itself is held in a spring-loaded mounting structure to ensure an appropriate contact is maintained while the UAV manipulates its thrust to provide the force that couples the probe with the surface. Employing this strategy, the UAV autonomously measures thickness at pre-planned locations on the target surface.
Ultrasonic thickness measurements aboard the UAV are attained by a conventional split-crystal transducer, utilising piezoelectric materials to generate and receive the ultrasonic pressure waves. The transducer operates in a ‘pitch-catch’ configuration, which helps to minimise the near-field dead-zone and improves resolution when measuring thin plates [Citation20].
However, as is discussed in greater detail below, several factors may mitigate the performance benefits offered by this configuration when applied in the context of UAV-based inspection. Notably, transducer alignment errors and UAV instability can give rise to poor acoustic coupling, resulting in high attenuation of the returned ultrasonic signals. Electromagnetic noise introduced by interference from UAV motors may also be expected to raise the noise floor in the measurement signal, causing additional reduction of the SNR and further diminishing the inspection accuracy.
2. Aim and objectives
This paper presents a prototype UAV system for ultrasonic thickness mapping of large-scale facilities and evaluates the UAV deployment parameters which influence inspection accuracy. Particular examination is given to the detrimental effects of the aerodynamic challenges induced by close proximity flight, transducer alignment constraints and electrical interference from the craft’s motors. These experimental results provide benchmarks for UAV ultrasonic inspection system performance.
The structure of this paper is as follows. Section 3 demonstrates the implementation of a UAV system with an integrated ultrasonic inspection payload and details the experimental setup used to assess its performance. Section 4 details the procedure developed for measuring the alignment error and offset distance to the aluminium plate using an onboard laser scanner. Section 5 evaluates and analyses the parameters influencing the system SNR and inspection accuracy. Section 6 details empirical results of the UAV deployed ultrasonic inspections. Section 7 provides a discussion based on these experimental results. Finally, in Section 8, the paper is concluded with a summation of insights gained from the work.
3. System overview and experimental setup
3.1. System overview
The inspection system utilised in this paper (as shown in ) is composed of: an AscTec Firefly UAV [Citation21], custom manufactured ultrasonic transceiver circuitry, a 5 MHz, 10 mm diameter spilt-crystal ultrasonic transducer [Citation22] installed at the tip of the spring-loaded arm and a Hokuyo URG-04 LX laser scanner [Citation23].
Figure 1. (a) AscTec Firefly UAV equipped with ultrasonic payload (b) Cross-section of the spring-loaded arm mechanism (c) The UAV system top-down view and bounding dimensions.
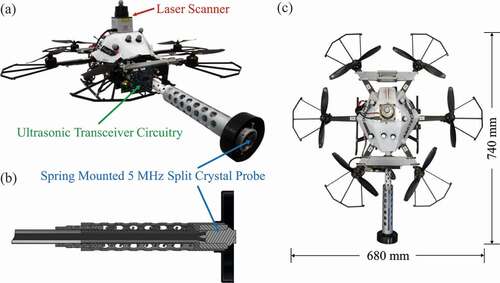
The Firefly UAV is a commercially available aerial platform, which is specified for a maximum take-off mass of 1.6 kg and offers circa 15 minutes flight time under nominal conditions. Flights are automated by a customised Proportional-Integral-Derivative (PID) controller [Citation24] running on a ground-based workstation accompanied by an onboard computer for sensor data acquisition and wireless transmission.
In a manner common to most commercial UAVs, the AscTec Firefly relies on GPS satellite data to perform autonomous navigation. However, the experiments presented in this paper were undertaken within an indoor laboratory environment, wherein GPS signals are unavailable. Therefore, a Vicon MX T-series tracking system is used as a replacement to conduct the laboratory-based inspections [Citation25]. The system is comprised of twelve optical cameras and precisely tracks the full position and orientation UAV pose at 100 Hz in real-time. This data is utilised by the controller to govern the UAV altitude, updating every 50 ms.
A Hokuyo URG04-LX planar laser scanner [Citation23] mounted atop the UAV is utilised to provide distance mapping of the inspection scene in front of the UAV. The scanner has a mass of 160 g, a 240° field of view with 0.35° angular resolution and presents with a 20 mm peak-to-peak measurement error. A curve-fitting algorithm is utilised to process the raw data output and compute the standoff and orientation errors in real-time, as detailed in Section 4. Sensor readings are used to estimate target orientation relative to the front of the craft and thereby determine its alignment offset versus the surface normal vector. This mechanism ensures that the UAV flies with correct orientation, keeping the probe face parallel to the asset surface while the distance measurement provides information used to maintain a designated standoff distance and avoid damaging collisions.
Ultrasonic thickness measurement is attained by deploying a 5 MHz, 10 mm diameter, split-crystal transducer, accompanied with customised ultrasonic transceiver circuitry. The transducer is manufactured by GB Inspection with plastic housing that reduces its mass to 17 g [Citation22]. Like most hard-face transducers, it requires appropriate angular alignment and utilises acoustic couplant gel, placed between the asset and transducer surfaces, to eliminate any air gap and propagate acoustic energy.
The customised ultrasonic transceiver circuitry is a 76 g, light-weight system, specifically designed to minimise the mass of the hardware necessary to operate split-crystal ultrasonic probes within small robotic platforms. The system contains a pulse generator; a Variable Gain Amplifier (VGA); an Analogue to Digital Converter (ADC) for digitising A-scan echo signals and a high-speed Field-Programmable Gate Array (FPGA) controller for data acquisition.
The ultrasonic transceiver generates 180 V unipolar rectangular pulses, stimulating the piezoelectric element inside the transducer, and thus effecting the transmission of ultrasound waves into the sample. A transimpedance amplifier, coupled with the VGA, forms the receiver front end to pre-process the ultrasonic echo signal and amplify it into the acquisition range of the ADC. The amplified signals are digitised at a sampling rate of 100 MHz. These signals are initially buffered in the FPGA, then wirelessly transmitted via the UAV’s onboard computer to a ground-based workstation for further processing to provide the final quantitative A-scan thickness measurement. The software running within the UAV onboard computer fires the transducer and ultimately controls the acquisition process, providing a 20 Hz pulse repetition frequency.
The AscTec Firefly is designed as a platform for fundamental UAV control research and applications in free flight around other bodies. As such it is particularly suited for photogrammetric inspection when equipped with a lightweight camera. However, unlike photogrammetry, ultrasonic inspection is a contact-based measurement, which requires the transducer to meet the inspection surface with appropriate force and alignment to ensure adequate coupling of the transmitted and received acoustic energy. Because of aerodynamic challenges and concerns regarding collisions, the UAV is required to maintain a small distance (110 mm) between the propeller swept area and the inspection surface. Therefore, the ultrasonic transducer is held at the tip of a spring-loaded arm extending from the centre of the UAV.
This approach is not without compromise. The presence of this arm and transducer increases the UAV mass and alters its distribution, introducing a significant turning moment (the product of force and distance to the UAV’s centre) and so acting to destabilise the aircraft. Thus, the mechanical mounting structure was designed to minimise the increase in payload mass and turning moment. The 3D printed, lightweight structure (depicted in ) is composed of a central tube, a spring-loaded head, a UAV mounting manifold and a battery carriage. The battery carriage is placed at the back of the UAV to counterbalance the additional turning moment of the arm, aiding flight stability.
Herein, all thickness measurements are conducted by evaluating the time difference between two back-wall echoes observed in the A-scan results. An increased noise level and weakened signal strength are noted to negatively influence the measurement accuracy, obfuscating the peaks used to define thickness in the acquired signal. In order to investigate such effects, the relative strength of the signal versus the accompanying noise is defined by the SNR, calculated by dividing the peak amplitude of the reflected signal by the noise amplitude and expressing the result in decibels:
In this case, the noise is taken as the maximum amplitude of the signal within the regions where the reflected echo is not observed, ignoring the initial pulse transmission.
3.2. Experiment setup
A 1 m2 aluminium plate of 15 mm nominal thickness was fabricated and vertically mounted in the laboratory to mimic an industrial inspection scenario as presented in . Dimensions of the plate are defined to provide suitable scale to replicate flight conditions in proximity to industrial structures such as petrochemical tanks and nuclear facilities. In such scenarios, measurement accuracy mainly depends on the quality of ultrasonic coupling between the probe and the asset, itself related to the flight conditions and motion of the UAV. This setup is therefore indicative of the accuracy during inspection of larger scale assets under a similar UAV flight profile. Rectangular pockets were machined into the rear surface of the plate to simulate the measurement of different thicknesses and complex corrosion geometry. Additionally, 15 flat-bottomed holes were also drilled in the plate with different depths and diameters, representing different sizes and depths of sub-surface defect.
Figure 2. (a) Aluminium sample schematic diagram. Still images taken from a video of the inspection process when UAV was: (b) close to the surface, (c) undertaking ultrasound inspection and (d) retracting to leave the surface.
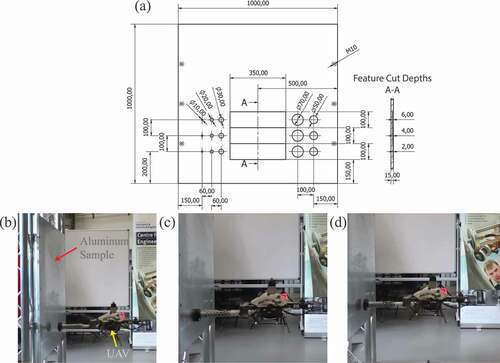
Whilst the surfaces of inspection targets will likely be painted in the case of in situ assets, here the sample retained a finish as manufactured, noting that non-destructive inspections commonly require the removal of surface coatings prior to measurement. Such conditions provide a means to evaluate system performance in the absence of the negative effects of surface coating including signal attenuation by ultrasonic impedance mismatch or variations in acoustic coupling caused by uneven coating thickness. Furthermore, the unpainted surface allows for characterisation of UAV inspection of materials with high reflectivity, known to present additional uncertainty in laser distance measurements [Citation26].
When conducting the airborne inspections, the UAV initially rises to the target height and stabilises itself at a distance from the asset, centring itself relative to the desired inspection point prior to approach. After achieving this pre-planned attitude, the controller guides the UAV closer to the asset until the ultrasonic probe at the front of the arm contacts the surface and measurements may be taken. Thereafter, the controller retracts the UAV to a standoff distance of 800 mm to prevent collision damage from forward movement induced by environmental disturbances. The UAV thereby leaves the inspection surface and makes ready for the next point measurement, repeating the alignment and approach stages. After finishing the inspection process, the controller guides the craft to a designated safe area and performs an automatic landing.
4. Distance and alignment measurements of reflective surfaces
Locating the position of the target object and understanding its surface geometry is essential in autonomous in-service inspections. The Hokuyo URG-04 LX laser rangefinder employed by this system is a phase-shift measurement sensor, commonly used for obstacle avoidance, mapping of the area immediately surrounding a mobile robot and localisation of the robot within that area [Citation26]. The scanner has a mass of 160 g, a 240° field of view with 0.35° angular resolution and presents with a 20 mm peak-to-peak measurement error. As described in Section 3.2, it was mounted atop the UAV to measure instantaneous standoff and orientation error relative to the target asset and permit the autonomous control of the aircraft. Generally, standoff distance to the sample is determined based on the minimum distance in the rangefinder’s swept measurement arc, while alignment is calculated using the angle at which the minimum distance is recorded. However, in this case the specular reflective nature of the aluminium sample, as with other highly reflective materials, results in measurement errors in the laser scanner range data, owing to its reliance on phase-shift measurements [Citation26,Citation27]. To improve the measurement accuracy, a curve-fitting based data processing algorithm was applied. This process computes the standoff and orientation errors in real-time by fitting a plane to the closest part of the structure.
In considering this algorithm it is first noted that the laser scanner output for a flat plane in noiseless conditions can be written as:
where is the measured distance to the surface at an angle of θ°, D is the UAV standoff and θ’ is the angle with the shortest distance (representative of the UAV orientation error), as shown in .
Figure 3. A generic representation of the laser scanner reading with θ’ alignment angle offset.
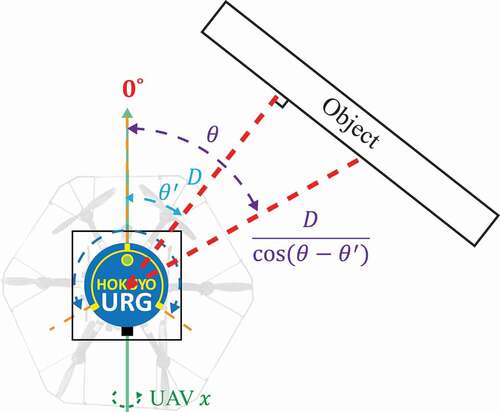
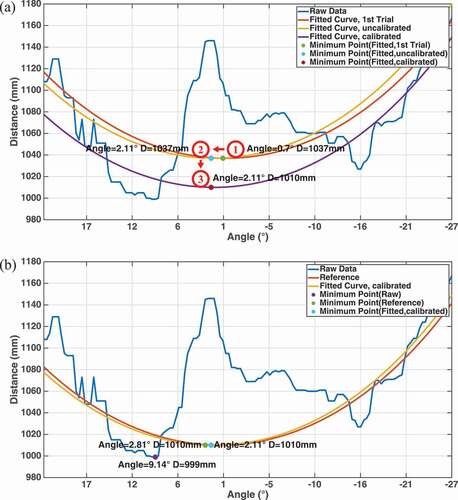
Therefore, the objective of the curve fitting process is to find the value of D and θ’, which best fits the laser measurement data. However, due to the specular reflective nature of aluminium material, the sensor measurements around the angle where the path of the laser light approaches the surface normal direction contain relatively large error, as visible in . Such surface finishes complicate the laser scanner curve fitting and measurement interpretation but do provide a unique feature to retrieve the alignment offset after curve fitting, as the distance acquired perpendicular to the target surface (0° incidence angle) contains the largest error relative to the ideal curve. Hence, the alignment angle acted on by the flight controller was estimated using this phenomenon. is an example of the distance and alignment measurement versus the aluminium plate described in Section 3.2 using the laser scanner output. As shown in the figure, a 27 mm steady-state error was visible on the resultant fitted curve and corrected for using the calibration data of the aluminium material [Citation26]. The process successfully estimated the alignment angle and the standoff distance to the inspection sample.
Figure 4. Measurements from the raw laser data (a) curve fitting sequence (b) comparison of the results from raw data, fitted curve and reference.
Overall, the distance and alignment measurement can be determined per the following procedure, as shown in ).
Table
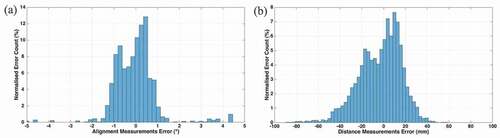
shows the distance and alignment error measured from the UAV onboard laser scanner during the inspection, compared with the measurements from the Vicon system. As shown in ), the majorities of alignment measurement errors and the distance measurement errors were below 2° and 60 mm Such results show the laser scanner has successfully estimated the alignment and standoff distance when inspecting a high reflective surface.
Figure 5. Measurement errors from the onboard laser scanner, compared with the values from the Vicon tracking system (a) alignment angle (b) standoff distance.
5. Factors impacting ultrasonic inspection accuracy
5.1. Probe alignment angle
The transducer utilised in this paper is a split-crystal ultrasonic probe. It may be readily found from practical experience that probe alignment error causes signal attenuation when the transducer face is not parallel to the target surface. As described in [Citation28], such misalignments produce uncertainties in the measurement process, resulting in measurement errors. This experiment is thus designed to measure the alignment constraints of the transducer and quantify their impact on inspection accuracy in the larger context of the UAV deployment. Here, the ultrasonic transducer was mounted on the end of a KUKA KR6 R900 sixx: an industrial, six-degree of freedom, robotic manipulator arm [Citation29]. Utilising the internal pose feedback, the robot pitch, roll and yaw angles and (x,y,z) translations, measured with 0.01° angular and 0.01 mm translational resolution respectively, were manually adjusted to move the ultrasonic probe through a range of poses. Compared with the vibration present when mounted on the UAV, the KUKA robot can deploy the transducer to much more precise positions granting the experiment repeatability and providing more accurate quantification results. Additionally, the measurements under this setup are not influenced by interference from the UAV motors, which is further described in Section 5.2. The motors of the robot were stationary during the data acquisition, so they have no contribution to noise.
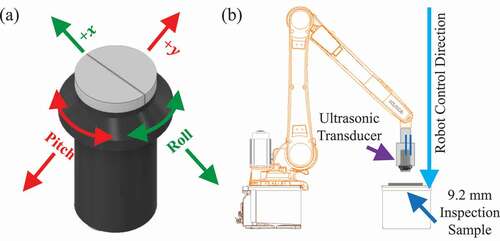
In conducting the assessment, the transducer is triggered and its output signal digitised while the robot arm is manually controlled to adjust the transducer through a range of ± 6° in pitch and ± 9° in roll angle while maintaining contact with the inspection target via a layer of couplant gel. As demonstrated in , an aluminium sample of 9.2 mm thickness is horizontally attached to the robot inspection platform and constitutes the inspection target for this scenario. This sample is approached vertically by the robotic manipulator, using the same transducer and circuitry as on the UAV platform, described in Section 3. To ensure that the maximum usable range of transducer orientations is determined, the amplifier gain of the ultrasonic acquisition board was set to its maximum value (47 dB) for the duration of these trials.
Figure 6. (a) Transducer orientations (b) Experiment setups for the quantification of alignment constraints.
The A-scan signals of the transducer with different alignment errors are presented in . These received signals have been digitally post-processed utilising a bandpass filter with a centre frequency of 5 MHz and bandwidth of 2 MHz. list the measurement errors with different roll and pitch alignment errors, respectively, relative to the surface normal vector. It should be noted that measurement errors when the transducer is positioned at large angles from surface normal are omitted from because the reflections are not distinguishable in the A-scan signals in these cases.
Figure 7. A-scan signals with different transducer alignment errors (a) the transducer roll angle was adjusted between ± 9° (b) the transducer pitch angle was adjusted between ± 6°.
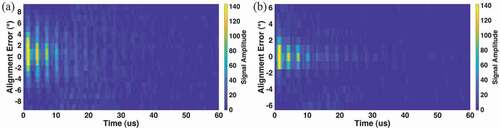
Table 1. Thickness measurement errors with different roll angle alignment errors
Table 2. Thickness measurement errors with different pitch angle alignment errors
As shown in , the reflection signals had the largest amplitude while the transducer was parallel to the surface. In this case, a total of nine repetitions of the back-wall echo are identifiable in the A-scan signals. The increased signal attenuation at orientations diverging from normal and accompanying growth in measurement error highlights the relationship between the transducer alignment and inspection accuracy. As such, the back-wall reflections are markedly attenuated in the case where the transducer roll and pitch offset are larger than 6° and 3°, respectively, to the point where no single echo can be visually identified within the A-scan signal. Thus, the bounding constraints for alignment offset that may be tolerated while obtaining recognisable reflections are ± 6° on roll angle and ± 3° on pitch angle. It should, however, be noted that the reflection signals can be recognised in one direction of the movement about the roll axis up to 6° but 8° in the other. This phenomenon occurs owing to the alignment error’s influence on the sound propagation path. Specifically, the transmitting and receiving piezoelectric elements are offset from the probe’s columnar axis within the housing and so are tilted slightly towards this axis, to focus at a specific depth and achieve better signal transduction when properly aligned with the surface. This trigonometric effect means that the returning energy diverges more slowly from the receiver element when movement occurs in the direction of positive roll than in the negative, for a consistent angular increment.
5.2. UAV interference
Interference from the UAV system, generated by the electric motors that provide the flight thrust, represents an influential factor in terms of inspection accuracy when using an aerial system. The raising of the noise floor as a result of the high-current electrical switching and magnetic field induction when the motors are activated may be expected to reduce the SNR, negatively influencing the accuracy of thickness measurement.
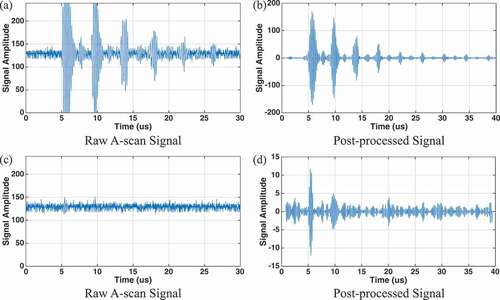
In an experiment designed to investigate these effects, ultrasonic thickness measurements were undertaken from a stationary UAV that had been mounted rigidly in contact with the inspection surface and had its motors deactivated, to isolate the effects of electrical interference. To provide a comparison, the measurements were then repeated while the rotating UAV’s six motors at speeds matching those required for flight. With the transducer having been optimally aligned manually and the amplifier gain set to maximise SNR, the rigid mounting structure acted to eliminate the effects of inconsistent alignment across the comparative trials. The raw signals recorded with deactivated stationary motors and with rotating motors are shown in ), respectively. The digitally post-processed signals returned from the bandpass filter are similarly presented in ).
Figure 8. Thickness measurement signals (a) raw A-scan when the motors were stationary (b) processed A-scan when the motors were stationary (c) raw A-scan when the motors were rotating (d) processed A-scan when the motors were rotating.
As presented in , the rotating UAV motors slightly increased the power density of the noise: discrete flickers are observed in both raw signals, retaining a consistent amplitude but increasing in frequency upon activation of the motors. However, this effect does not remain observable in the bandpass filtered signals. Although the interference increased the level of the noise, the SNR in the post-processed signal is reduced by less than 1 dB (from 25.13 dB to 24.22 dB), which did not influence the measurement accuracy. Hence, the electrical noise could be filtered out by appropriate digital signal processing. These noise sources can thus be considered to have minimal negative impact on measurement accuracy.
5.3. UAV positional accuracy
As described in Section 5.1, the ultrasonic transducer requires the alignment error to be maintained below 3° in the roll and 6° in the pitch angle. This translates to a tolerance of ± 3° and ± 6° on the pitch and yaw angles expressed in the UAV’s orientation frame. Due to the nature of multirotor kinematics and aerodynamic effects arising from near-surface flight [Citation30], these boundaries for alignment error of the probe represent a significant challenge from a UAV control perspective. Additionally, the mass of the ultrasonic measurement payload is close to the upper limits of feasibility for the UAV, which affects the craft’s controllability and stability and further influences the transducer alignment and positional accuracy [Citation31]. Unlike the alignment error, the positional error will not attenuate the signal amplitude as long as surface contact can be maintained. Such positional error may represent an obstacle in terms of repeatability, but a meaningful inspection may be conducted so long as the precise deployment position can be accurately recorded.
In attempting to quantify the flight stability performance of the current hardware, the UAV’s full pose was tracked by the Vicon motion capture hardware and the positional accuracy relative to the desired point of inspection determined across flights with and without the ultrasound inspection payload. The results below demonstrate the impact of the payload mass on the UAV’s positional accuracy. Additionally, to evaluate the influence of near-surface aerodynamic effects, the position and alignment accuracy was quantified while the UAV was flying at distances of 200 mm and 800 mm from the aluminium plate. These two distances represent examples of a relatively small standoff, where the aerodynamic effects are prevalent, and the far distance, where the craft experiences free flight. These results therefore present the impact of the near-surface aerodynamic challenges and that of payload mass. contains the standard deviations of the UAV pitch angle, yaw angle, y-axis position and z-axis position, respectively. The positional error in the x-axis is omitted because the UAV motion in this axis was used to approach the surface and so the error is of no consequence during contact inspection owing to constraints imposed on the craft position by the nature of physical contact .
Table 3. Standard Deviation of the UAV poses
Table 4. UAV pose error and inspection results during contact measurement
The results illustrate that the ultrasonic payload mass increased the standard deviation of the UAV yaw angle by 50% (from 1.82° to 2.61°), while the pitch angles were similar in both configurations. As described in Section 5.1, such reductions in UAV stability impact the accuracy of the inspection results, the measurement error could be increased by a factor of 1.5. The increased moment of inertia about the UAV’s vertical axis introduced by the mass of the transducer and extended arm, coupled with the limited yaw authority when using differential motor reaction torque to turn the UAV, lead to a situation where negative effects were observed more readily in the yaw stability. The positional stability was also diminished with the standard deviation on the y-axis growing from 54.47 mm to 63.26 mm. Similar z-axis stability was observed in the inspections with and without payload. Of all the directions considered in terms of the decrease in UAV stability during the close-range inspections, the y-axis was therefore most affected. The presence of the inspection payload increased the UAV total mass to a value approaching the upper limits of the UAV’s capability, leading to challenges when utilising a PID controller to stabilise the aircraft in the horizontal plane. This effect is not present to the same extent in the z-axis as the craft may use all six motors to concertedly correct for disturbances in this direction, reducing the sensitivity to increased payload.
In spite of the increase in alignment and positional error observed when carrying the additional ultrasonic payload and moving into close proximity with the inspection surface, it is possible to maintain the UAV alignment errors in pitch and yaw angle within the transducer’s identified limitations such that contact-based inspection readings were able to be taken.
6. Inspection results
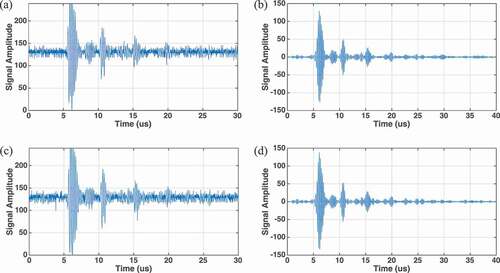
The UAV successfully delivered the ultrasonic probe to the sample surface, as shown in . During the inspection, the difference between total thrust used during free flight and when in contact was found to be negligible upon examination of the recorded battery voltage draw data. ) shows one such ultrasonic A-scan signal captured during the thickness measurement deployed by the UAV using 180 V unipolar excitations to stimulate the transducer. At the time of signal acquisition, the pitch and yaw angle errors were 1.21° and 0.07°, while the errors on the y-axis and z-axis relative to the desired inspection position were 25.41 mm and 41.90 mm respectively. In this instance, the SNR of the filtered signal is 30.05 dB, and the error in the thickness measurement is 0.03 mm versus the independently ascertained thickness of 12.92 mm as measured when the UAV was manually positioned and oriented in the optimal pose with its motors disabled.
Figure 9. Thickness measurement signals acquired from the autonomous UAV deployed inspection (a)(b) with relatively good alignment (c)(d) with relatively large alignment error.
By contrast, ) shows an A-scan signal captured with poorer alignment, having angular errors of 1.61° and 2.01° in the pitch and yaw axes of the UAV frame and translational errors of 46.73 mm and 20.11 mm in the y-axis and z-axis, respectively. The presence of the alignment error attenuated the signal amplitude by 22 dB and increased the error to 0.22 mm.
It should be noted that the gain of the amplifier in the ultrasonic transceiver circuit was maximised to ensure the signals captured with large alignment errors were visible to the transceiver ADC. However, the high amplitude signals returned by a system with small alignment errors were overamplified to the point of saturation, resulting in distortion of the echo signals (as shown in )). Due to the increasing attenuation of the acoustic signals by the material as a function of path length, the third and later echoes of sufficiently reduced amplitude to appear undistorted, as depicted in ). Hence, the thickness was measured using the time difference between the first and second undistorted echoes and the earlier distorted echoes were ignored.
Thickness mapping can be retrieved from a collection of the thickness measurements in various known positions. Despite the limited ability of the current system to deploy the sensor precisely, recording the craft positional data while conducting the measurements using the Vicon tracking system allows for the results of repeated flights to build up an image of component thickness across its surface area. presents an inspection result as an example of this, intended to simulate inspection in an industrial scenario. The inspection is composed of six measurements acquired in three independent flight trials. Thickness measurement was conducted by the autonomous controlled UAV system in different locations on the sample, focussed around a central point of interest. Depending on the UAV starting position, the overall time cost of each measurement trial (including take-off, approach, retracting, landing) is around 1 minute. Over the trials, the ultrasonic measurements were successfully acquired by the UAV system with measurement errors below 2% versus reference geometry, which demonstrated the feasibility of the system for NDT inspections.
Figure 10. Inspection result of the UAV measurements conducted in six different positions.
7. Discussion
While the results presented herein demonstrate the capability of the system to perform contact-based ultrasonic thickness measurements of a non-magnetic aluminium sample, the nature of the method by which the system enters contact using rotor thrust means that it is not limited to assets composed of this material.
The inspections detailed above were performed in a laboratory environment, wherein the UAV position data for navigation was provided by the Vicon tracking system. When operating outdoors and in situ, the localisation systems commonly employed, such as conventional GPS or its differential implementations, are less accurate with typical accuracy of 0.22 m [Citation32] compared to the millimetre scale errors of the Vicon photogrammetry-based system. Therefore, the UAV positional accuracy during such inspections can be worse compared with the results presented in this paper. However, the challenges from near-surface aerodynamic and payload mass remain pertinent to outdoor inspection scenarios. Therefore, the impacts of such parameters, as evaluated in this paper, are still indicative of some of the challenges encountered in field use.
Compared with other state-of-art systems, the UAV described herein utilised a spring-loaded structure to deploy the ultrasonic transducer and conducts NDT measurement with a customised, light-weight ultrasonic transceiver, which grants full flexibility of the instrumentation software, allowing adaptation to a number of unique inspection scenarios. While aerial inspection systems documented in literature employ non-linear control structures with fine position control [Citation17], the UAV detailed here is able to attain superior measurement accuracy in interactions while governed by a common PID control loop. Here, accuracy of airborne thickness measurement versus the known geometry ranged from 0.03 mm, while inspecting a 12.92 mm thick region of the aluminium plate, to approximately 0.20 mm when measurements were located near a feature boundary. It is notable, therefore, that further measurement accuracy improvements maybe be possible if such non-linear control algorithms were integrated with the ultrasonic instrumentation hardware and laser-based surface alignment method employed here.
Operating as detailed in this paper, the UAV system successfully and autonomously positioned the transducer to complete ultrasonic thickness measurements without manual intervention. Guided by range measurements from a planar laser scanner with a curve-fitting compensation algorithm, the UAV system was able to compute the standoff and orientation errors relative to its target structure in real-time. Employing this feedback, dynamic pose correction allowed execution of the flight path required for inspection without detailed prior knowledge of the asset geometry or its position within the operating environment. This can be highly advantageous for in situ inspection, where such asset information is often undocumented, without requiring the computational burden of a full real-time mapping strategy.
In practical experimentation, the standard deviation of the positional error versus the target location was recorded below 63.26 mm, with angular alignment error versus the surface normal vector below 2.71°. Investigation presented in Section 5 determined the bounding constraints of operability in this regard. Due to the nature of the ultrasound coupling mechanism, alignment offset may be tolerated up to ± 6° about the UAV roll axis and ± 3° on pitch axis. These figures quantify the challenge of the aerial ultrasound application in terms of flight control and stability. Direction of future research is further informed by the experiment results in Section 5.3, indicating minimal negative effects of electrical noise arising from UAV systems on ultrasonic measurement accuracy.
Overall, these findings provide benchmarks for autonomous ultrasonic inspection and the factors impacting measurement accuracy, offering practical insight towards industrial deployment of future airborne NDT technologies.
8. Conclusions and future work
This paper presents an autonomous, UAV deployed, contact-based, ultrasonic measurement system for the inspection of vertical non-magnetic facilities and details how measurements were conducted by utilising a commercial split-crystal probe with customised transceiver circuity. The UAV was able to successfully navigate an indoor laboratory environment under the direction of the flight controller utilising additional information from a planar laser scanner and acting without manual intervention. The onboard scanner successfully estimated distance and alignment during the inspection of a reflective aluminium sample. As such, the system conducted measurements in a region of the aluminium sample with 12.92 mm nominal thickness, reporting the thickness with 0.03 mm error owing to non-ideal conditions intrinsic to the nature of the system. At the point of inspection, the pitch and yaw errors were 1.21° and 0.07°, while the errors on the y-axis and z-axis were 25.41 mm and 41.90 mm, respectively, relative to the desired inspection pose.
Two parameters, probe alignment angle and electrical interference from the UAV motors are considered as potential constraints on inspection performance, influencing the ultrasonic measurement accuracy in terms of a reduction in SNR. Their isolated impacts on the overall accuracy were quantified and analysed. Despite the increased power density of system noise conferred by the electrical interference of the active brushless motors, the noise contribution from this source is much less than that arising from the probe alignment error. Experimental analyses show that the probe’s roll and pitch angle are required to be within 6° and 3°, respectively, of the surface normal vector to receive any identifiable back-wall echoes in the A-scan signal. It is noted that while conducting measurements of an area of the sample with 9.2 mm thickness, non-ideal alignment within the bounds stated gave rise to maximum errors of 0.82 mm, a marked increase when compared to other better-aligned measurements.
In its role governing the transducer orientation, the UAV’s positional accuracy, including the surface alignment accuracy, is crucial to producing a meaningful inspection and, as such, the accuracies of the current inspection system were evaluated and discussed. Due to the aerodynamic challenges and the payload mass restrictions, the performance levels presented are taken as the intrinsic limitations of the current system.
The findings from this paper can be used for future research regarding autonomous airborne ultrasonic inspection of civil infrastructure and industrial facilities. Future work will also consider methodologies to improve UAV stability and reduce its positional and alignment error in a manner that would grant enhanced inspection accuracy. The six motors of the UAV system are currently positioned within a single horizontal plane with the same orientation and so struggle to produce an appropriate force to maintain contact with the surface in a manner decoupled from the manoeuvring of the aircraft. In attempting a manoeuvre to hold the probe in place, the nature of this thrust mechanism limits the controllability of the aircraft, in turn impacting the stability of the transducer coupling. Hence, alternative UAV mechanical designs will be investigated to lessen the probe alignment issues and further improve the inspection accuracy beyond current efforts. Moreover, a novel ultrasonic transducer topology with a wider angular coupling capability, is identified as a strategy to offer greater redundancy against alignment error caused by the non-idealities in the UAVs positioning. Investigations into the capability of coded ultrasonic excitation schema to better extract sample thickness information in instances of limited coupling are also regarded as a means of improving the overall system performance. Similarly, although the main contribution of this paper may be found in deployment of an ultrasound probe for the thickness measurement of an aluminium test sample, the aerial system and methodology are versatile. Future work utilising a different inspection payload may permit ready application to other types of contact-based NDT, such as EMAT (Electro Magnetic Acoustic Transducer), pulsed eddy current and phased array ultrasound. This constitutes an opportunity to further researches upon the inspections of more complicated structures, such as multi-layered assemblies [Citation33].
Finally, it is worth noting that, as a conventional transducer, the ultrasonic probe utilised in this system requires a small quantity of couplant gel to be applied between the transducer and inspection surface, which is of limited practicality in real inspection scenarios. Thus, a dry-coupled ultrasonic transducer coupling via a deformable layer of rubberised material instead of liquid couplant, will be considered as part of future work.
Disclosure statement
No potential conflict of interest was reported by the author(s).
Correction Statement
This article has been republished with minor changes. These changes do not impact the academic content of the article.
Additional information
Funding
References
- Nguyen VN, Jenssen R, Roverso D. Automatic autonomous vision-based power line inspection: a review of current status and the potential role of deep learning. Int J Electr Power Energy Syst. 2018;99:107–120.
- Zhang J, Liu L, Wang B, et al. High speed automatic power line detection and tracking for a UAV-based inspection. Proc. 2012 Int. Conf. Ind. Control Electron. Eng. Xi'an, China: ICICEE 2012, 2012, p. 266–269.
- Omar T, Nehdi ML. Remote sensing of concrete bridge decks using unmanned aerial vehicle infrared thermography. Autom Constr. 2017;83:360–371.
- Pratt KS, Murphy R, Stover S, et al. CONOPS and autonomy recommendations for VTOL small unmanned aerial system based on hurricane katrina operations. J. F. Rob. 2009;26(8):636–650.
- Stokkeland M, Klausen K, Johansen TA, Autonomous visual navigation of unmanned aerial vehicle for wind turbine inspection. 2015 Int. Conf. Unmanned Aircr. Syst. Denver, CO, USA: ICUAS 2015, 2015, p. 998–1007.
- Zhang D, Watson R, Dobie G, et al. Quantifying impacts on remote photogrammetric inspection using unmanned aerial vehicles. Eng Struct. 2020 Apr;209:109940.
- Cyberhawk. UAV inspection surveying. 2018.
- Vertex Air. Drone thermal imaging. [Online]. 2018 [cited 2018 Dec 30]. Available from: http://vertexaccess.co.uk/vertexair/services/thermal-imaging/
- FLIR. Inspectahire relies on the FLIR GFx320 optical gas imaging camera for maintenance inspections and hydrocarbon leak detection in the offshore oil and gas industry. [Online]. 2017 [cited 2019 Feb 13]. Available from: http://www.flirmedia.com/inspectahire-relies-on-the-flir-gfx320-optical-gas-imaging-camera-for-maintenance-inspections-and-hydrocarbon-leak-detection-in-the-offshore-oil-and-gas-industry.html
- Li X, Yang Q, Chen Z, et al. Visible defects detection based on UAV-based inspection in large-scale photovoltaic systems. IET Renewable Power Gener. 2017;11(10):1234–1244.
- Meola C, Boccardi S, Carlomagno GM, et al. Nondestructive evaluation of carbon fibre reinforced composites with infrared thermography and ultrasonics. Compos Struct. 2015;134:845–853.
- Menendez E, Victores JG, Montero R, et al. Tunnel structural inspection and assessment using an autonomous robotic system. Autom Constr. 2018;87:117–126.
- Dobie G. Ultrasonic sensor platforms for non-destructive evaluation. 2010 Feb.
- Farlow R. Low noise techniques applied to a piezoceramic receiver for gas coupled ultrasonic flaw detection. 1998.
- Mattar RA, Kalai R. Development of a wall-sticking drone for non-destructive ultrasonic and corrosion testing. Drones. 2018;2(1):8.
- Jarvis R, Cegla F, Kovac M, et al. NDE sensor delivery using unmanned aerial vehicles. Insight Non-Destr Test Condition Monit. 2018;60(8):463–467.
- Kocer BB, Tjahjowidodo T, Pratama M, et al. Inspection-while-flying: an autonomous contact-based nondestructive test using UAV-tools. Autom Constr. 2019;106:102895.
- TexoDrone. UAV integrated UT gauge. [Online]. 2018 [cited 2018 Dec 01]. Available from: https://www.texodroneservices.co.uk/service/uav_integrated_ut
- Apellix. UT. [Online]. 2018 [cited 2018 Dec 12]. Available from: https://www.apellix.com/ut-probe/
- Hellier CJ. Handbook of nondestructive evaluation. United States: Publisher McGraw-Hill Education. 2003.
- Ascending Technologies. AscTec Firefly Technical Data. Online Webpage. [Online]. 2015 [cited 2018 Nov 07]. Available from: http://wiki.asctec.de/display/AR/AscTec+Firefly#AscTecFirefly-TechnicalData
- GB Inspection Systems Ltd. Compression wave 0° probes. [Online]. 2018 [cited 2018 Dec 30]. Available from: https://www.gbinspection.com/products/probes-accessories/compression-wave-0-probes
- Hokuyo. Scanning laser range finder URG-04LX specifications. Online Webpage. [Online]. 2005 [cited 2018 Oct 31]. Available from: https://www.hokuyo-aut.jp/dl/Specifications_URG-04LX_1513063395.pdf
- Araki M. Pid control. Vol. 2. Control Syst Rob Autom. 2002, p. 1–23.
- Vicon. Go further with Vicon MX T-series. [Online]. 2011. [cited 2018 Dec 30]. Available from: https://www.viconpeak.com/downloads/documentation/go-further-with-vicon-mx-t-series
- Macleod CN, Summan R, Dobie G, et al. Quantifying and improving laser range data when scanning industrial materials. IEEE Sens J. 2016;16(22):7999–8009.
- Siegwart R, Nourbakhsh IR, Scaramuzza D. Introduction to autonomous mobile robots. United States: MIT Press; 2011.
- Ramirez-Martinez A, Rodríguez-Olivares NA, Torres-Torres S, et al. Design and validation of an articulated sensor carrier to improve the automatic pipeline inspection. Sensors (Switzerland). 2019;19(6):1394.
- KR AGILUS. KUKA. [Online]. 2015 [cited 2018 Dec 30]. Available from: https://www.kuka.com/en-de/products/robot-systems/industrial-robots/kr-agilus
- Robinson DC, Chung H, Ryan K. Computational investigation of micro helicopter near-wall effect. Proc. 19th Australas. Fluid Mech. Conf. Orlando, FL, USA: AFMC 2014, 2014.
- Pounds PEI, Bersak DR, Dollar AM. Stability of small-scale UAV helicopters and quadrotors with added payload mass under PID control. Auton Rob. 2012;33(1–2):129–142.
- Monteiro LS, Moore T, Hill C. What is the accuracy of DGPS? J Navig. 2005;58(2):207–225.
- Mineo C, Lines D, Cerniglia D. Generalised bisection method for optimum ultrasonic ray tracing and focusing in multi-layered structures. Ultrasonics. 2021;111:106330.