
 ?Mathematical formulae have been encoded as MathML and are displayed in this HTML version using MathJax in order to improve their display. Uncheck the box to turn MathJax off. This feature requires Javascript. Click on a formula to zoom.
Abstract
Nano-indentation is an interesting tool for analyzing nano-scale mechanical properties. The analysis of nano-mechanical properties as a function of experimental conditions is very critical for designing engineering components. In this study, nano-indentation experiments were performed by considering different values of amplitude (1, 5, 10 nm), frequency (11.2, 22.5, 45 Hz), strain rate (0.02, 0.05, 0.1, 0.2, 1 s−1), peak load (10, 30, 100 mN) and hold time (1, 3, 5, 10, 20, 50, 100 sec) to analyze their effect on the mechanical properties of LDPE. The results showed that the effect of amplitude and frequency on the nano-mechanical properties of LDPE were negligible. Load-displacement curves displayed a shift towards higher indentation depths along with a decrease in peak load from 20.6 to 14.8 mN by having a decrease in strain rate from 1 to 0.02 s−1. Elastic modulus and hardness values exhibited a decrease with an increase in hold time. Logarithmic creep model was used to fit the experimental data of creep as a function of holding time which showed good agreement (r2 ≥ 0.97) with the experimental values. Recommended holding times are also suggested to eliminate the creep and nose problem in order to achieve high accuracy in measurements.
1. Introduction
Polyethylene is a thermoplastic polymer which consists of amorphous areas in between the crystalline regions due to this reason, it is called semi-crystalline polymer. Low density polyethylene (LDPE) provides good performance as compared to other polymers, glass, or metal. Generally, the exceptional properties of LDPE are easy processing, better electrical, chemical, abrasion and impact resistance, and higher toughness. The mechanical properties of LDPE are strongly influenced by temperature, applied stress, and the speed of test.[Citation1–3] LDPE is an excellent electrical insulator and the typical electrical application is insulating material for cables and wires.[Citation4] Thin films of LDPE have wide range of applications as a packaging material mainly due to its exceptional barrier properties, mechanical properties, low cost, and energy efficiency.[Citation5]
Nano-indentation or depth sensing indentation is a unique tool for characterizing nano-mechanical properties of different materials like metals, polymers, and biological tissues. It is a nondestructive experimental technique which allows several tests to be performed on the same sample without the requirement of optical imaging as used in conventional indentation experiments.[Citation6] Penetration displacement and indentation load are the two main parameters which can be measured using nano-indenter. Hardness and Young’s modulus can be estimated from the numerical analysis of the obtained load-displacement curve.[Citation7] Such analysis is very easy for elastic-plastic material but for materials having time-dependent behavior, this technique becomes delicate as models for mechanical characterization of such materials are not well developed.[Citation8] The load is applied on the sample through the indenter for a particular period of time and the resultant indentation size is measured as in a conventional normal indentation test. The contact compliance method has been recently used for hardness and modulus computation; this method is based on the imposed displacement/reaction force response.[Citation9–11]
A thorough understanding of the nano-mechanical properties of LDPE is required for the successful design of its engineering components. Several researchers have reported the use of nano-indentation technique to analyze the mechanical properties of different materials. The mechanical behavior of multifunctional ZnO/PMMA based nanocomposites was analyzed by using nano-indentation tests.[Citation12] In nano-indentation technique, experimental variables always have a substantial effect on the resulting parameters and the accuracy of such parameters in turns affects the credibility of subsequent numerical analysis of the resultant data. Therefore, a complete understanding of the effect of different experimental variables on the resulting parameters for nano-indentation of LDPE is required. Moreover, in mechanical characterization through nano-indentation, some metals, polymers and biological materials show creeping effect due to the viscous flow of molecular chains. This effect can be seen from loading-unloading curve intersection point which becomes round shape (a nose) together with a slight increase in material indentation depth along with a decrease in applied load.[Citation13] Because of this time-dependent behavior, estimated mechanical properties have inherent errors. Oliver-Pharr method,[Citation14] used to evaluate hardness and elastic modulus via nano-indentation technique, becomes invalid as two assumptions (i.e. elastic recovery occur at incipient unloading and application of power law to unloading curve) are no more applicable. To eliminate creeping effect or nose problem, a typical procedure used is to hold indenter at peak load for a suitable time long enough for the material to attain mechanical equilibrium before unloading.[Citation15] Hence, a deep understanding of the accurate value of holding time and also the effect of different holding times on the final properties of LDPE is required to ensure the elimination of creep problem and to obtain the true mechanical properties of the material.
Several studies have been reported to analyze the effect of different loading conditions on nano-indentation measurements. Golovin et al.[Citation16] studied the effect of oscillation amplitude on the mechanical properties of fused silica, gallium arsenide, molybdenum, tungsten, and aluminum using nano-indentation technique. Jia et al.[Citation17] reported the effect of strain rate on the nano-mechanical properties of different materials like fused silica, single crystal silicon and duplex stainless steel by using both normal indentation and continuous stiffness mode indentation. Voyiadjis and Malekmotiei[Citation18] also studied the effect of strain rate on the mechanical properties of poly (methyl methacrylate) and polycarbonate using nano-indenter in continuous stiffness mode. ML Oyen[Citation19] reported the effect of ramp time and load level on the modulus values of the material having a time-dependent deformation. YC Lin[Citation7] investigated the effect of different holding times on the nano-mechanical properties of ductile and brittle materials. Zhang et al.[Citation8] studied the effect of holding time in nano-indentation tests on zirconia dental ceramic. Chudoba et al.[Citation20] worked on different substrates (steel, nickel, glass) and film combinations (diamond-like carbon, Al2O3, aluminum, gold) to study creep effects on modulus and hardness. Ngan and Tang[Citation21] worked on polypropylene to evaluate creep response in correspondence with applied load.
Nano-indentation measurements of a polymer are highly dependent on the loading conditions. Moreover, the reliability of the data analysis is greatly affected by the precision of the measurements. Therefore, better understanding of the effect of experimental conditions on the nano-indentation behavior of LDPE is required. Furthermore, the knowledge of creep behavior of LDPE is important to prevent creep deformation and rupture because LDPE is known to display larger creep behavior as compared to the another polymer of its class, i.e., HDPE due to lower crystallinity.[Citation22] To date, the analysis of the effect of experimental conditions on the nano-mechanical properties of LDPE and also the creep behavior of LDPE during nano-indentation test has not been investigated in detail. Hence, in this article, a detailed nano-indentation analysis was performed to study the effect of amplitude, frequency, strain rate, peak load and holding time on the mechanical properties (hardness & elastic modulus) of LDPE under different loading conditions.
2. Experimental
Polyethylene was taken from the Goodfellow, UK as commercially available grade with catalog # ME303013. Polymer samples were used for experimentation without any surface treatment. For the evaluation of average peak surface roughness, the optical profilometer was used. Nano-indentation experiments were performed using an MTS Nano-Indenter IIs, (NANO INDENTER® IIs machine, supplied by Nano Instruments Ltd., Tennessee, USA) by adopting both normal indentation mode as well as continuous stiffness mode of indentation.
The machine uses a contact compliance indentation mode for analyzing surface mechanical properties of materials. Thus, the material hardness and the elastic modulus can be calculated without estimating the area of indentation. A trigonal diamond pyramid tip, also known as a Berkovich Indenter, was mounted to the bottom of the indenter column. The Berkovich tip makes an angle of 65.3° with the normal to the base of indenter.[Citation15] The normal force on the indenter was generated with the help of a magnetic field containing an electromagnetic aluminum coil placed on the top of inner indenter tube. To determine the effects of experimental conditions on the nano-mechanical properties of LDPE, following test procedures were used:
Experiment # 01: To determine the effect of amplitude variation, constant strain rate of 0.05 s−1, constant harmonic frequency of 45 Hz and varying amplitudes of 1, 5, 10 nm were selected in continuous stiffness mode.
Experiment # 02: To determine the effect of harmonic frequency variation, constant amplitude of 2 nm, constant strain rate of 0.05 s−1 and changing frequencies of 11.2, 22.5, 45 Hz in continuous stiffness mode were considered.
Experiment # 03: To evaluate the effect of strain rate variation, constant frequency of 45 Hz, constant amplitude of 2 nm and varying strain rates of 0.02, 0.05, 0.1, 0.2, 1 s−1 in continuous stiffness mode were selected.
Experiment # 04: To evaluate the effect of holding time variation, three different peak loads (10, 30, 100 mN), constant loading time of 10 sec and varying holding times of 1, 3, 5, 10, 20, 50, 100 sec were considered in normal indentation mode.
For all experimental conditions, a final hold segment after 80% unloading was applied to account for the thermal drift during all the indentation experiments. On each condition, six different experiments were performed to get a better profile of the results. Hardness and elastic modulus were estimated for LDPE to evaluate the effect of experimental conditions on the aforementioned properties.
3. Results & discussion
3.1. Effect of amplitude and frequency on nano-indentation response
displayed the load-displacement curves of LDPE for various amplitudes of 1, 5 and 10 nm. It can be easily seen from the graph that the loading behavior remains more or less same with minor differences in peak load for various amplitudes. Similarly, and presented the hardness and modulus as a function of displacement for different amplitudes. Remarkable fluctuations were observed for hardness values at very low values of penetration displacement. These uncertainties were thought to be because of defects in the geometry of tip, errors in the determination of surface or effects of indentation size.[Citation15,Citation23] At very low penetration depths, a harder and more changing behavior was observed. This can be attributed to the confined changes in the physical properties of the material under the influence of harsh environment sometimes before the experimentation or during the fabrication process of polymers. These modifications near to the surface may have occurred due to the localized oxidation of polymeric surface or due to the segregation of modifiers or other impurities near to the surface.
Figure 1. Indentation load as a function of displacement for different amplitudes (1, 5, 10 nm).
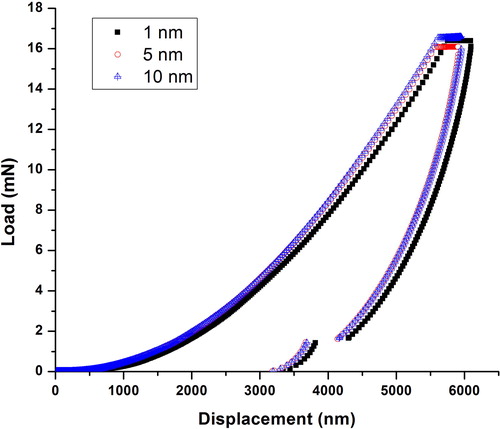
Figure 2. Hardness as a function of displacement for different amplitudes (1, 5, 10 nm).
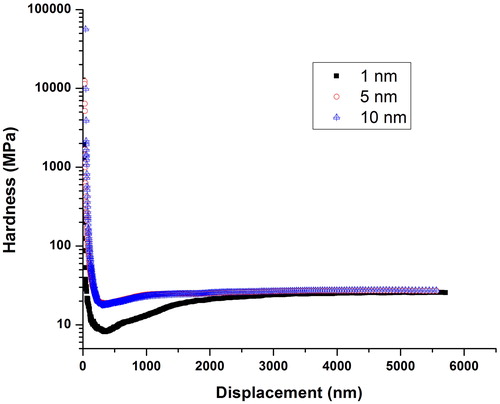
Figure 3. Modulus as a function of displacement for different amplitudes (1, 5, 10 nm).
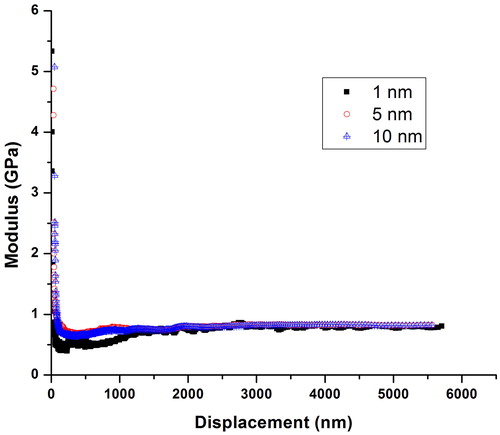
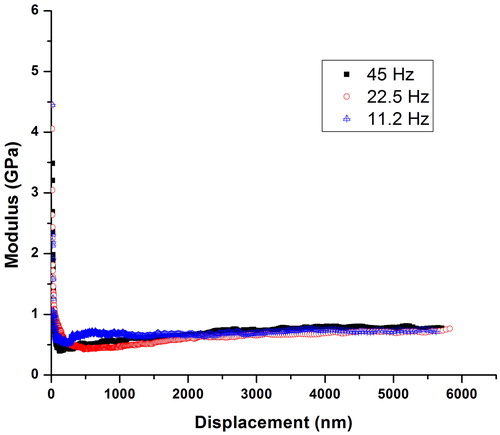
It can be seen that after the indentation depth of 2000 nm, the value of hardness for all the amplitudes remains more or less constant (≈ 0.023 GPa) which is similar to the already reported value (0.022 GPa) for this particular polymer.[Citation24] The modulus values also displayed an independent behavior as a function of amplitude for higher values of indentation depths with more or less constant value of ≈ 0.5 GPa which is of same order of magnitude as already reported in the literature.[Citation24] The similar results were also reported for the effect of oscillation amplitude on the nano-mechanical properties of fused silica, gallium arsenide, molybdenum, tungsten, and aluminum.[Citation16] Similar behaviors were also observed for the nano-mechanical properties of LDPE as a function of frequency as depicted in .
Figure 4. Indentation Load as a function of displacement for different frequencies (11.2, 22.5, 45 Hz).
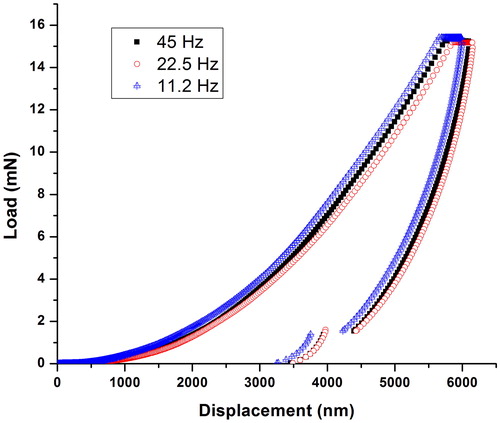
Figure 5. Hardness as a function of displacement for different frequencies (11.2, 22.5, 45 Hz).
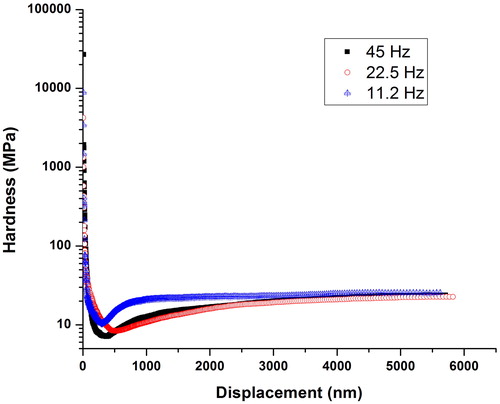
Figure 6. Modulus as a function of displacement for different frequencies (11.2, 22.5, 45 Hz).
3.2. Effect of strain rate on nano-indentation response
presented the load-displacement curves of LDPE for various strain rates of 0.02, 0.05, 0.1, 0.2, and 1 s−1. It can be easily seen from the graph that, the curves shifted towards the higher indentation depths together with a decrease in peak load from 20.6 to 14.8 mN by having a reduction in strain rate from 1 to 0.02 s−1. Therefore, it can be concluded that the polymer exhibits a softer response at the lower strain rates. This result is in accordance with the already reported nano-indentation response of the asphalt-filler mixture.[Citation25] showed the dependency of creep displacement on the strain rate in the load-hold stage. An increase in the creep displacement was evident as a function of increasing strain rate which is in agreement with the already reported results for neat polyamide.[Citation26] This behavior suggested that the higher strain rate during loading stage leads to the greater creep susceptibility of the materials. The polymer has shown a strain rate sensitivity which can be more clearly observed from the and in terms of hardness and modulus.
Figure 7. Indentation load as a function of displacement for different strain rates (0.02, 0.05, 0.1, 0.2, 1 s−1).
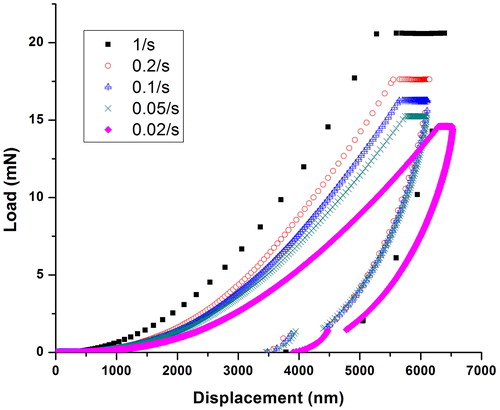
Figure 8. Creep displacement as a function of strain rate at a constant frequency of 45 Hz and an amplitude of 2 nm.
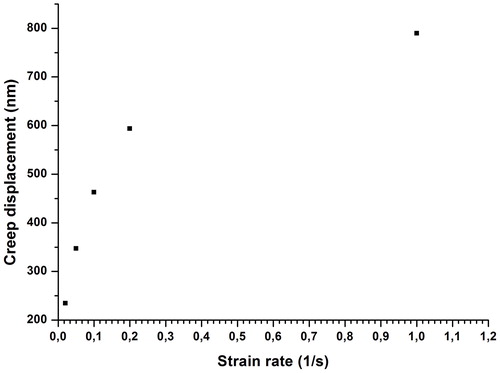
Figure 9. Hardness as a function of displacement for different strain rates (0.02, 0.05, 0.1, 0.2, 1 s−1).
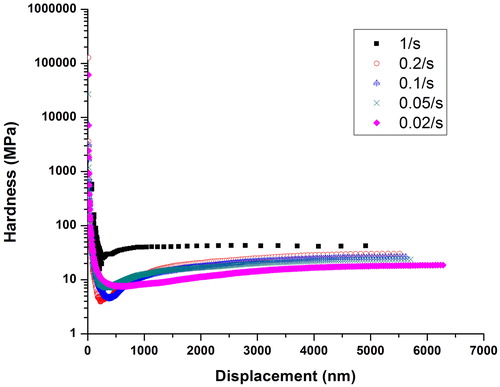
Figure 10. Modulus as a function of displacement for different strain rates (0.02, 0.05, 0.1, 0.2, 1 s−1).
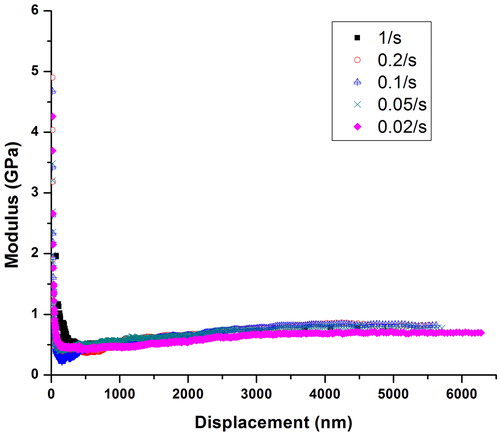
and showed the behavior of hardness and modulus as a function of displacement for various strain rates. Both modulus and hardness exhibited large values at very small indentation depths as already discussed. A decrease in hardness values from 0.46 to 0.09 GPa and a decrease in modulus values from 1.4 to 1 GPa were observed with the decrease in strain rate from 1 to 0.02 s−1 at larger indentation depths. These results are in accordance with the nano-mechanical behavior of fused silica, Si, and duplex stainless steel, already reported in literature.[Citation17]
It is clearly evident from the that the hardness of the polymer displayed an increase with the decreasing indentation displacement which is similar to the already reported results for the polymeric materials.[Citation27,Citation28] This behavior confirmed the existence of indentation size effect in the investigated polymeric material. In case of metals, this phenomenon is usually associated with the geometrically necessary dislocation densities, strain gradient plasticity, and dislocation starved plasticity. However, these reasons are not enough to explain the indentation size effect in polymers because the elastic strain and elastic deformation energy is quite significant in polymers as compared to the inelastic deformation energy. Therefore, the indentation size effect in polymers may be related to the elastic deformation or Frank elasticity comes from bending distortions of polymeric chains and not to the plastic deformation which commonly used to justify the size effects in metals.[Citation29]
3.3. Investigation of creep behavior
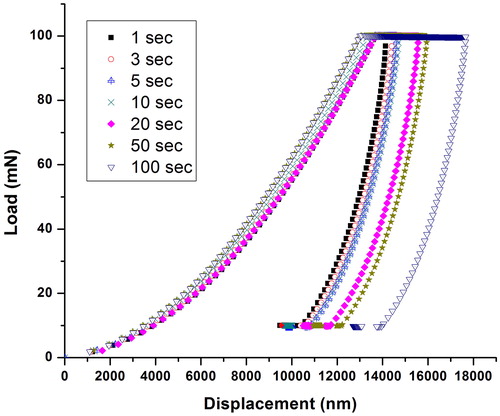
Oliver-Pharr method is used to calculate the values of elastic modulus and hardness by assuming purely elastic behavior in normal mode of indentation. Polymeric and biological materials display time-dependent behavior (creep), therefore, to apply Oliver-Pharr method, creep has been reduced to a minimum level by considering different holding times at peak load. In order to analyze the creep behavior, several peak load holding times (1, 3, 5, 10, 20, 50, 100 sec) were considered on three constant peak loads (10, 30, 100 mN) with constant loading and unloading time of 10 sec in normal nano-indentation mode and the results are displayed in in the form of load-displacement curves. It can be clearly seen from the Figures that creep displacement showed an increase with the increase in holding time. It can also be observed that maximum indentation, in the case of 10, 30 and 100 mN, increased from approximately 4177 nm to 5282 nm (Δ 1105 nm), 7169 nm to 9511 nm (Δ 2342 nm) and 14110 nm to 17654 nm (Δ 3544 nm) respectively, as holding time varied from 1 sec to 100 sec. also presented that all the loading curves follow more or less the same pattern whereas the unloading curves observed to start at higher values of indentation displacements for longer holding times.
Figure 11. Indentation load as a function of displacement by having peak load of 10 mN for different holding times (1, 3, 5, 10, 20, 50, 100 sec).
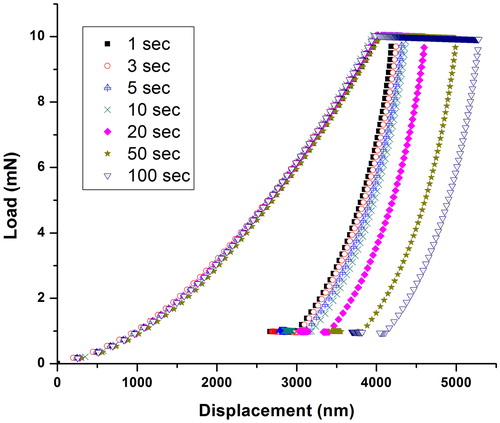
Figure 12. Indentation load as a function of displacement by having peak load of 30 mN for different holding times (1, 3, 5, 10, 20, 50, 100 sec).
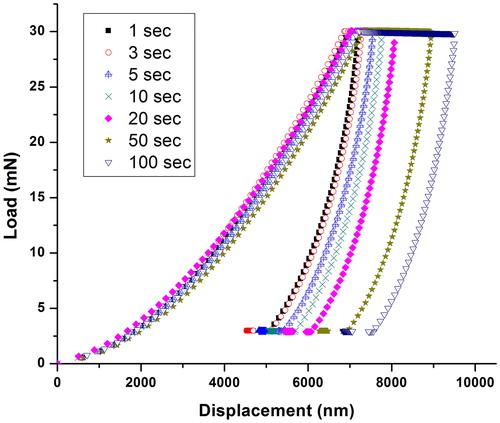
Figure 13. Indentation load as a function of displacement by having peak load of 100 mN for different holding times (1, 3, 5, 10, 20, 50, 100 sec).
displayed the creep depth behavior as a function of holding time for different indentation peak loads (10, 30, 100 mN) applied. It is clear from the that, as holding time increased from 1 sec to 100 sec, creep depth showed an increase from approximately 118 nm to 1293 nm (Δ 1175 nm), 197 nm to 2285 nm (Δ 2088 nm) and 372 nm to 4591 nm (Δ 3847 nm) for the peak loads of 10, 30 and 100 mN respectively. It can also be seen from the graph that, with increasing load of indentation for the same holding time, creep depth was higher for a higher load.
Figure 14. Creep displacement as a function of holding time for different peak loads (10, 30, 100 mN). The solid line represents model fitting.
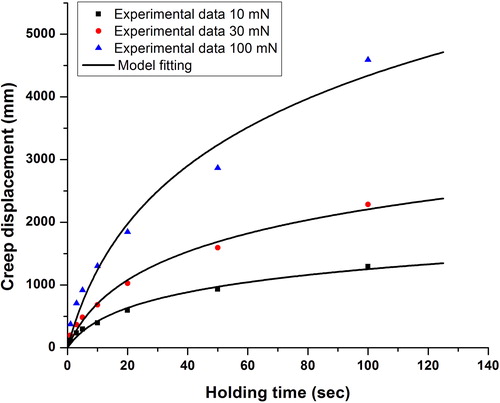
Logarithmic creep model[Citation30,Citation31] was suggested by Chudoba et al.[Citation20] to analyze the creep behavior of different materials like diamond-like carbon, glasses, ceramics, etc. Following form of the logarithmic creep model was used to fit the experimental creep data of the investigated material (LDPE):
[1]
[1]
where
represented holding time,
showed depth change at maximum load and
are the fitting parameters. Creep data of LDPE was treated by means of the fitting algorithms of Table Curve 2 D software, based on the Least Squares Method. Values of model parameters (
&
) for LDPE are listed in the . Logarithmic creep model fitting on the experimental data of LDPE is presented in which shows a good agreement with the experimental data (r2
0.97).
Table 1. Values of fitting parameters for EquationEq. [1][1]
[1] .
3.4. Effect of holding time on modulus and hardness
and presented the hardness and elastic modulus as a function of holding time. The values of modulus and hardness, evaluated using normal nano-indentation mode, were observed to be strongly dependent on holding time and displayed a decreasing trend with increasing holding time. It is evident from that hardness decreased from 0.030 GPa to 0.018 GPa, 0.041 GPa to 0.016 GPa and 0.027 GPa to 0.019 GPa for the applied peak loads of 10, 30, 100 mN respectively, with varying holding time from 1 sec to 100 sec whereas displayed that modulus decreased from 0.668 GPa to 0.545 GPa for the peak load of 10 mN, 0.778 GPa to 0.526 GPa in the case of 30 mN applied load and 0.648 GPa to 0.547 GPa for 100 mN applied peak load, with varying hold time from 1 sec to 100 sec for all the cases. These results are in accordance with the literature which also showed a decrease in modulus and hardness with increasing holding time.[Citation32]
Figure 15. Hardness as a function of holding time for different peak loads (10, 30, 100 mN). Bars represent standard deviation.
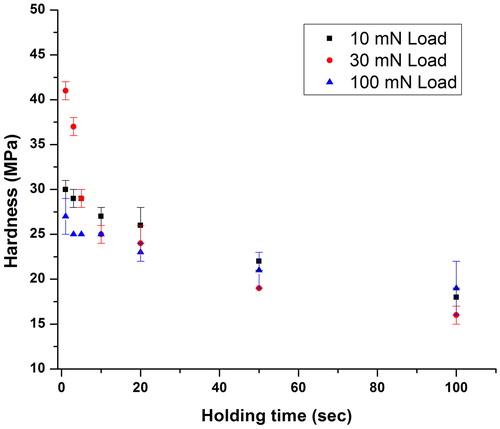
Figure 16. Modulus as a function of holding time for different peak loads (10, 30, 100 mN). Bars represent standard deviation.
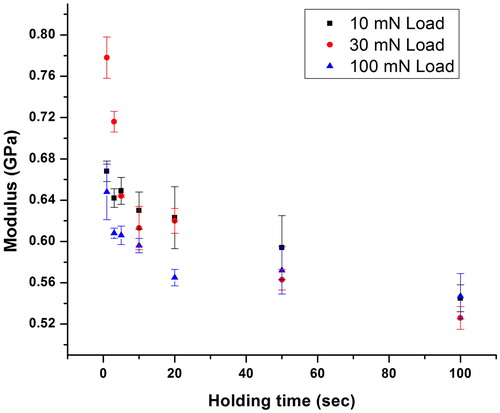
This behavior was observed because of creep deformation resulted from imbalance between stress and strain and due to the motion of molecular chains under stress.[Citation33] The creep effect is usually exhausted during longer holding times, resulted in a smaller recovery of elastic modulus. Therefore, smaller values of elastic modulus were observed with prolonged holding times as indicated by . In addition, increasing creep depth leads to higher contact area which results in smaller hardness values.
In and , hardness and modulus displayed higher values and more dependency on holding time for lower applied loads. This result is in accordance with the already reported behavior for the nano-indentation analysis of PMMA[Citation15] which was attributed to the additional creeping penetration at the higher contact loads, before any creep relaxation occurs. Furthermore, the polymers are known to exhibit a surface hardening response, therefore, lower hardness values were observed at higher peak loads with increasing penetration depths.
3.5. Recommended holding time
The recommended holding time was estimated by using an arbitrary criterion suggested by Chudoba et al.[Citation20] given as follows: “The holding period at maximum load has to be long enough such that the creep rate has decayed to a value where the depth increase in 1 min is less than 1% of the indentation depth”. The first derivative of logarithmic creep calculated from Equationequation [1][1]
[1] was used to calculate the recommended holding times for different applied loads (). An extrapolation was performed in a case when the recommended holding time was longer than the experimental holding time.
Table 2. Recommended holding times for LDPE with different peak loads.
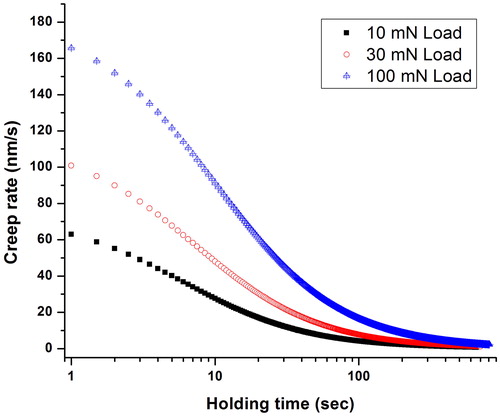
The creep rate, calculated from Equationequation [1][1]
[1] , was plotted as a function of holding time as presented in . It can be easily seen from the graph that, the values of creep rate for the holding time of 1 sec was a bit higher, whereas for the holding time of two orders of magnitude the creep rate is decreased to very small values, which ensured the elimination of nose problem and also verified the values of recommended holding times as discussed above.
Figure 17. Creep rate as a function of holding time for different peak loads (10, 30, 100 mN).
4. Conclusion
The effect of experimental conditions on the mechanical properties was studied by adopting both normal mode and continuous stiffness mode of nano-indentation for LDPE. Different values of amplitude (1, 5, 10 nm), frequency (11.2, 22.5, 45 Hz), strain rate (0.02, 0.05, 0.1, 0.2, 1 s−1), peak load (10, 30, 100 mN) and holding time (1, 3, 5, 10, 20, 50, 100 sec) were considered to analyze their effect on the mechanical properties of LDPE. The results showed that the effect of amplitude and frequency on the nano-mechanical properties of LDPE was negligible. Load-displacement curves displayed a shift towards the higher indentation depths along with a decrease in peak load from 20.6 to 14.8 mN by having a decrease in strain rate from 1 to 0.02 s−1. A decrease in hardness and modulus values, with the decrease in strain rate at larger indentation depths, was also observed. The experimental data also showed that elastic modulus and hardness both depends on holding time variation. Elastic modulus and hardness decreased as holding time increased. For larger holding times, the creep effects were usually exhausted which results in smaller recovery of elastic modulus. Increase in displacement due to creep gives higher contact area which results in lower hardness values as holding time increased. Also, the creep depth at same holding time increased with increase in peak load. Logarithmic creep model was used to fit the experimental data of creep as a function of holding time which showed good agreement with the experimental values (r2 0.97). Recommended holding times was also suggested for different loads by using an arbitrary criterion suggested in literature to eliminate the creep and nose problem. Furthermore, applicability of logarithmic creep model on the results of nano-indentation of different polymeric systems can be further investigated to incorporate more parameters into the model related to the characteristics of considered systems.
References
- Michler, G. H. Electron Microscopy of Polymers; Springer-Verlag: Berlin, Heidelberg, 2008.
- Jordan, J. L.; Casem, D. T.; Bradley, J. M.; Dwivedi, A. K.; Brown, E. N.; Jordan, C. W. Mechanical Properties of Low Density Polyethylene. J. Dynamic Behavior Mater. 2016, 2, 411–420. DOI: 10.1007/s40870-016-0076-0.
- Vasile, C.; Pascu, M. Practical Guide to Polyethylene; Rapra Technology Limited: Shrewsburg, 2005.
- Ashby, M.; Messler, R.; Asthana, R.; Furlani, E.; Smallman, R. E.; Ngan, A. H. W.; Crawford, R. J.; Mills, N. Engineering Materials and Processes Desk Reference, Butterworth-Heinemann: Oxford, 2009.
- Briassoulis, D.; Aristopoulou, A.; Bonora, M.; Verlodt, I. Degradation Characterisation of Agricultural Low-Density Polyethylene Films. Biosystems Eng. 2004, 88, 131–143. DOI: 10.1016/j.biosystemseng.2004.02.010.
- Iqbal, T.; Briscoe, B. J.; Yasin, S.; Luckham, P. F. Continuous Stiffness Mode Nanoindentation Response of Poly(Methyl Methacrylate) Surfaces. Chin. J. Polym. Sci. 2013, 31, 1096–1107. DOI: 10.1007/s10118-013-1301-0.
- Lin, Y. C.; Weng, Y. J.; Pen, D. J.; Li, H. C. Deformation Model of Brittle and Ductile Materials Under Nano-Indentation. Mater. & Design. 2009, 30, 1643–1649. DOI: 10.1016/j.matdes.2008.07.028.
- Zhang, L.; Shao, L.; Li, L.; Jiang, D. An Abnormal Displacement Change during Holding Period in Nanoindentation Tests on Zirconia Dental Ceramic. J. Adv. Ceram. 2016, 5, 153–158. DOI: 10.1007/s40145-016-0184-2.
- Hutchings, I. M. The Contributions of David Tabor to the Science of Indentation Hardness. J. Mater. Res. 2009, 24, 581–589. DOI: 10.1557/jmr.2009.0085.
- Iqbal, T.; Briscoe, B. J.; Luckham, P. F. Surface Plasticization of Poly(Ether Ether Ketone). Eur. Polym. J. 2011, 47, 2244–2258. DOI: 10.1016/j.eurpolymj.2011.09.022.
- Iqbal, T.; Briscoe, B. J.; Yasin, S.; Luckham, P. F. Nanoindentation Response of Poly(Ether Ether Ketone) Surfaces-A Semicrystalline Bimodal Behavior. J. Appl. Polym. Sci. 2013, 130, 4401–4409.
- Chakraborty, H.; Sinha, A.; Mukherjee, N.; Ray, D.; Protim Chattopadhyay, P. A Study on Nanoindentation and Tribological Behaviour of Multifunctional ZnO/PMMA Nanocomposite. Mater. Lett. 2013, 93, 137–140. DOI: 10.1016/j.matlet.2012.11.075.
- Oyen, M. L. Ultrastructural Characterization of Time-Dependent, Inhomogeneous Materials and Tissues; University of Minnesota: Minneapolis, 2005.
- Oliver, W. C.; Pharr, G. M. An Improved Technique for Determining Hardness and Elastic Modulus Using Load and Displacement Sensing Indentation Experiments. J. Mater. Res. 1992, 7, 1564–1583. DOI: 10.1557/JMR.1992.1564.
- Briscoe, B. J.; Fiori, L.; Pelillo, E. Nano-Indentation of Polymeric Surfaces. J. Phys. D: Appl. Phys. 1998, 31, 2395. DOI: 10.1088/0022-3727/31/19/006.
- Golovin, Y. I.; Korenkov, V. V.; Razlivalova, S. S. The Effect of Small-Amplitude Load Oscillations on the Nanocontact Characteristics of Materials in Nanoindentation. Phys. Solid State. 2017, 59, 1127–1138. DOI: 10.1134/S1063783417060105.
- Jia, Y.-F.; Cui, Y.-Y.; Xuan, F.-Z.; Yang, F. Comparison between Single Loading–Unloading Indentation and Continuous Stiffness Indentation. RSC Adv. 2017, 7, 35655–35665. DOI: 10.1039/C7RA06491H.
- Voyiadjis, G. Z.; Malekmotiei, L. Variation of the Strain Rate during CSM Nanoindentation of Glassy Polymers and Its Implication on Indentation Size Effect. J. Polym. Sci. Part B: Polym. Phys. 2016, 54, 2179–2187. DOI: 10.1002/polb.24127.
- Oyen, M. L. Sensitivity of Polymer Nanoindentation Creep Measurements to Experimental Variables. Acta Materialia. 2007, 55, 3633–3639. DOI: 10.1016/j.actamat.2006.12.031.
- Chudoba, T.; Richter, F. Investigation of Creep Behaviour under Load during Indentation Experiments and Its Influence on Hardness and Modulus Results. Surf. Coatings Technol. 2001, 148, 191–198. DOI: 10.1016/S0257-8972(01)01340-8.
- Ngan, A. H. W.; Tang, B. Viscoelastic Effects during Unloading in Depth-Sensing Indentation. J. Mater. Res. 2002, 17, 2604–2610. DOI: 10.1557/JMR.2002.0377.
- Klapperich, C.; Komvopoulos, K.; Pruitt, L. Nanomechanical Properties of Polymers Determined from Nanoindentation Experiments. J. Tribol. 2001, 123, 624–631. DOI: 10.1115/1.1330736.
- Bonne, M.; Briscoe, B. J.; Lawrence, C. J.; Manimaaran, S.; Parsonage, D.; Allan, A. Nano-Indentation of Scratched Poly(Methyl Methacrylate) Surfaces. Tribol. Lett. 2005, 18, 125–133. DOI: 10.1007/s11249-004-1767-6.
- Lee, A.-Y.; Lee, M. Comparative Analysis on the Nanoindentation of Polymers Using Atomic Force Microscopy. Polym. Test. 2010, 29, 95–99. DOI: 10.1016/j.polymertesting.2009.09.009.
- Katsuki, D.; Gutierrez, M. Nanoindentation Approach Characterizing Strain Rate Sensitivity of Compressive Response of Asphalt Concrete. Acta Geotech. 2014, 9, 887–901. DOI: 10.1007/s11440-013-0269-9.
- Shen, L.; Phang, I. Y.; Liu, T.; Zeng, K. Nanoindentation and Morphological Studies on Nylon 66/Organoclay Nanocomposites. II. Effect of Strain Rate. Polymer 2004, 45, 8221–8229. DOI: 10.1016/j.polymer.2004.09.062.
- Chong, A. C.; Lam, D. C. Strain Gradient Plasticity Effect in Indentation Hardness of Polymers. J. Mater. Res. 1999, 14, 4103–4110. DOI: 10.1557/JMR.1999.0554.
- Shen, L.; Liu, T.; Lv, P. Polishing Effect on Nanoindentation Behavior of Nylon 66 and Its Nanocomposites. Polym. Test. 2005, 24, 746–749. DOI: 10.1016/j.polymertesting.2005.04.004.
- Han, C.-S.; Nikolov, S. Indentation Size Effects in Polymers and Related Rotation Gradients. J. Mater. Res. 2007, 22, 1662–1672. DOI: 10.1557/JMR.2007.0197.
- Haasen, P. Physikalische Metallkunde; Springer-Verlag: Berlin, Heidelberg, 1984.
- Schulze, G. E. Metallphysik; Springer-Verlag: Berlin, Heidelberg, 1974.
- Jin, T.; Niu, X.; Xiao, G.; Wang, Z.; Zhou, Z.; Yuan, G.; Shu, X. Effects of Experimental Variables on PMMA Nano-Indentation Measurements. Polym. Test. 2015, 41, 1–6. DOI: 10.1016/j.polymertesting.2014.09.015.
- Fischer-Cripps, A. C. Nanoindentation; Springer: New York, 2011.