
ABSTRACT
Background and Objectives: Individuals evaluate the demands and resources associated with a pressurized situation, which leads to distinct patterns of cardiovascular responses. While it is accepted that cognitive evaluations are updated throughout a pressurized situation, to date, cardiovascular markers have only been recorded immediately before, or averaged across, these situations. Thus, this study examined the influence of in-task performance-related feedback on cardiovascular markers of challenge and threat to explore fluctuations in these markers.
Methods and Design: Forty participants completed a pressurized visual search task while cardiovascular markers of challenge and threat were recorded. During the task, participants received either positive or negative feedback via distinct auditory tones to induce a challenge or threat state. Following task completion, cardiovascular markers were recorded during a recovery phase.
Results: Participants’ cardiovascular responses changed across the experimental protocol. Specifically, while participants displayed a cardiovascular response more reflective of a challenge state following in-task performance-related feedback, participants exhibited a response more akin to a threat state later during the recovery phase.
Conclusions: In-task auditory performance-related feedback promoted cardiovascular markers of a challenge state. These markers fluctuated over the experiment, suggesting that they, and presumably underlying demand and resource evaluations, are relatively dynamic in nature.
Many occupations (e.g., aviation, military, medicine, sport) require individuals to perform skilled tasks in highly pressurized, anxiety-provoking, environments. It is well-documented that there is variation in the way individuals respond to pressure (e.g., Otten, Citation2009). The biopsychosocial model (BPSM) of challenge and threat is a theoretical framework that explains such individual differences (Blascovich, Citation2008). The BPSM suggests that during a pressurized or motivated performance situation (i.e., situation that requires a cognitive and/or instrumental response to achieve an important and self-relevant goal; Mendes & Park, Citation2014), individuals evaluate the demands of the situation and the coping resources they have available. If an individual evaluates that their resources match or exceed situational demands, they enter a challenge state, whereas if they evaluate that the demands exceed their resources, they enter a threat state (Seery, Citation2011). Challenge and threat states are viewed as outcomes of this demand and resource evaluation process (Seery, Citation2011), and, despite their discrete labels, are conceptualized as two ends of a single bipolar continuum, rather than a dichotomy (Seery & Quinton, Citation2016). Therefore, relative rather than absolute differences are often examined (e.g., cardiovascular reactivity more consistent with a challenge or threat state; Seery, Citation2011).
Demand and resource evaluations are proposed to lead to, and be reflected in, distinct cardiovascular responses (Seery, Citation2011), which have been validated in the social psychophysiology literature (Blascovich, Citation2008). Both challenge and threat states are characterized by increases in heart rate (HR; number of heart beats per minute) and ventricular contractility (VC; force exerted by the muscle heart muscle as it beats), along with decreases in pre-ejection period (PEP; period of left ventricular contraction), reflecting active engagement with the task (Seery, Citation2013). Sympathetic-adrenomedullary (SAM) activation also characterizes both states, and leads to the release of catecholamines (e.g., adrenaline), resulting in increases in cardiac activity and dilation of the blood vessels, and thus greater oxygenated blood flow (Seery, Citation2011). However, a threat state is also characterized by hypothalamic-pituitary-adrenocortical axis (or HPA) activation, prompting the release of cortisol and dampening the effects of SAM activation, thus reducing cardiac activity and limiting dilation of the blood vessels (Dienstbier, Citation1989). Therefore, in comparison with a threat state, a challenge state is marked by relatively higher cardiac output (CO; amount of blood ejected by the heart per minute), and lower total peripheral resistance (TPR; net dilation versus constriction of the vasculature), reactivity (Blascovich & Tomaka, Citation1996). Thus, the cardiovascular response accompanying a challenge state is thought to reflect a more efficient mobilization and transportation of energy (Scheepers et al., Citation2012). Researchers often calculate a challenge-threat index (CTI; sometimes termed Threat-Challenge Index; see Scholl et al., Citation2017), which combines CO and TPR reactivity into one measure and highlights where an individual lies on the challenge and threat continuum (Hase et al., Citation2019).
Research has revealed the performance consequences of entering a challenge or threat state, with a challenge state associated with better performance than a threat state (see Behnke & Kaczmarek, Citation2018 and Hase et al., Citation2019 for reviews). For example, Behnke and Kaczmarek (Citation2018) conducted a meta-analysis and revealed a mean standardized coefficient of r = 0.10 for CTI and task performance, indicating a small yet stable effect. Furthermore, Hase and colleagues (Citation2019) reported that 74% of studies included in their systematic review found a performance advantage for a challenge state over a threat state. Nevertheless, it should be noted that Behnke and Kaczmarek (Citation2018) reported a bias in the literature towards positive results, and Hase et al. (Citation2019) argued that future studies should report more information to enable a better assessment of risk of bias (e.g., blinding of outcome assessment – ensuring that researchers do not know if an individual is in a challenge or threat state when assessing task performance). Taken together, the research conducted to date highlights the benefits of entering a challenge state before and while performing a pressurized task.
An individual’s demand and resource evaluation is complex and thought to be influenced by several interrelated factors (e.g., danger, familiarity, effort, skill, support, prior performance; Blascovich, Citation2014). However, the antecedents proposed by the BPSM have rarely been tested (see Moore et al., Citation2014, for an exception). One factor that has been investigated is perceptions of skill level or ability, manipulated via performance-related feedback. For example, Frings et al. (Citation2014) investigated the effect of performance-related feedback on a visual search task. Midway through the experiment, during a break from the task, participants were told that they were either skilled (i.e., challenge group), or unskilled (i.e., threat group), via verbal instructions. Specifically, the challenge group were told that they were currently ranked 5th out of 55 participants, while the threat group were told that they were ranked 51st out of 55 participants. Following these instructions, compared to the challenge group, the threat group displayed a cardiovascular response consisting of relatively lower CO and higher TPR reactivity. This suggests that manipulating perceptions of skill, a proposed antecedent of challenge and threat in the BPSM, influenced cardiovascular reactivity.
However, in many real-world scenarios, feedback is accrued continually, without a period of time to reflect and restart (i.e., Frings et al., Citation2014), and as such, changes in challenge and threat states presumably occur online, while the task is being performed. For example, although an individual might initially view a public speaking task as more of a threat, this task could be re-evaluated as more of a challenge within a few minutes, when the individual notices an audience member responding positively to their speech (e.g., nodding and smiling), thus resulting in a more challenge-like cardiovascular response (i.e., higher CO and lower TPR reactivity; Seery, Citation2011). Similarly, a surgeon whose patient starts coding during open-heart surgery will likely re-evaluate the situation as being more demanding and themselves having fewer coping resources, thus resulting in a more threat-like cardiovascular response (i.e., lower CO and higher TPR reactivity; Seery, Citation2011). To date, research has addressed challenges and threats as relatively static states. Specifically, participants have traditionally been given instructions and then completed an experimental task, with cardiovascular measures often recorded in response to the instructions or averaged across the entire task (Hase et al., Citation2019), rather than continually throughout a pressurized situation. However, to fully understand challenge and threat states, research is needed to understand how the cardiovascular markers accompanying these states change during a pressurized task.
Demand and resource evaluations, and thus the cardiovascular responses marking challenge and threat states, are proposed to continue throughout a pressurized situation, resulting in fluctuations over time as new contextual information becomes available (e.g., information relating to the quality of task performance or skill level; Blascovich & Mendes, Citation2000). Indeed, in-keeping with this notion, Frings and colleagues (Citation2014) found that the cardiovascular markers of challenge and threat states changed during an experimental session, which were proposed to be the result of updating demand and resource evaluations. However, a limitation of the between-subject experimental paradigms commonly used is that they demonstrate distinct cardiovascular responses for different groups of participants. They do not, however, fully explore changes in one individual’s cardiovascular response at multiple time points during an experiment. Quigley et al. (Citation2002) used a within-subjects design in which participants completed a cognitive appraisal before and after four mental arithmetic tasks. Results suggested that cognitive appraisals continued to be associated with cardiovascular responses even after the initial appraisal had changed. Specifically, task-related cardiovascular reactivity influenced cognitive appraisals following the task, thus highlighting a need to consider changes in cardiovascular responses within an individual across an entire task.
An additional concern with the traditional between-subject experimental paradigm is that the differing temporal characteristics of challenge and threat responses are often ignored. Indeed, Mendes and Park (Citation2014) highlight that the biological systems underpinning challenge and threat states act on different timescales (e.g., neuroendocrine versus cardiovascular responses). For instance, SAM activation is proposed to be fast-acting (i.e., seconds), whereas HPA activation is considered to act more slowly (i.e., minutes). In a recent review, Meijen et al. (Citation2020) argued that HPA activation is too slow to be reflected immediately in CV reactivity and, therefore, the majority of existing research presents cardiovascular results that are unlikely to have been affected by HPA activity (Herman et al., Citation2011). It is possible that HPA activation, which contributes to a more threat-like cardiovascular response, may emerge later or even after a pressurized task, resulting in an increase in TPR (and thus decrease in CTI; Mendes & Park, Citation2014). To our knowledge, despite recovery from acute stress having important implications for future health (e.g., cardiovascular disease; Chida & Steptoe, Citation2010), and literature highlighting changes in cardiovascular profiles after a stressful situation (e.g., Brosschot et al., Citation2006; Glynn et al., Citation2002), limited challenge and threat research has included a recovery phase following a pressurized task to explore this possibility (see Eliezer et al., Citation2010 for an exception).
The present study
This study primarily aimed to modify participants’ perceptions of skill, a proposed antecedent of challenge and threat states (Blascovich, Citation2008), by manipulating performance-related feedback during a pressurized visual search task. It was predicted that there would initially be no difference in cardiovascular reactivity between the positive and negative feedback groups following pressure manipulation instructions. However, following in-task performance-related feedback, the positive feedback group was expected to display cardiovascular reactivity more indicative of a challenge state (i.e., higher CO and/or lower TPR reactivity), while the negative feedback group was expected to display cardiovascular reactivity more reflective of a threat state (i.e., lower CO and/or higher TPR reactivity). These divergent cardiovascular responses were anticipated because the positive feedback group was expected to perceive themselves as more skilled, thus evaluating the task as a more of a challenge (i.e., coping resources meet or exceed task demands). In contrast, the negative feedback group was expected to perceive themselves as less skilled, therefore evaluating the task as more of a threat (i.e., task demands exceed coping resources). A secondary aim of this study was to explore cardiovascular markers of challenge and threat during recovery from the pressurized task, to gain an insight into the time course of these cardiovascular responses. Given that a threat evaluation has been linked with slower acting HPA activation, the negative feedback group was predicted to display a cardiovascular response more akin to a threat state when recovering from the pressurized task, whereas the challenge group’s cardiovascular response would return to baseline after the effect of the faster acting SAM activation had dissipated.
Method
This study, including the protocol, primary hypotheses, and analysis procedure, was pre-registered on the Open Science Framework, and all data can be accessed at: https://osf.io/rpcyh/
Participants
Forty participants (25 males, 15 females; Mage = 21 years, SD = 2) volunteered to take part (see for demographic information of both experimental groups). A required sample size of forty was calculated using G*Power 3.1 software, setting power (1 – β err prob.) at 0.80, alpha (α err prob.) at .05, and using the effect size (d = 0.92) reported in Sammy et al. (Citation2017). To take part, participants had to have normal or corrected-to-normal vision, and no known personal or family history of cardiovascular or respiratory disease. Participants also had to refrain from alcohol and strenuous exercise for 24 hours before the study, and from caffeine and food one hour before the study. Participants were tested individually and provided written informed consent. The study protocol was approved by the School of Sport and Health Sciences Ethics Committee at the University of Exeter (Reference Number = 181004/A/01).
Table 1. Demographic information (M ± SD) of participants in the positive and negative feedback groups.
Design
A 2 (Group: positive, negative feedback) × 3 (Time: post-pressure instructions, post-auditory feedback, and post-task recovery) mixed design was used. Group was the between-subjects factor, with participants receiving either positive or negative performance-related auditory feedback during the pressurized task. Time was the within-subjects factor, with cardiovascular reactivity explored at three-time points: (1) after the pressure manipulation instructions (i.e., post-pressure instructions), (2) following the auditory performance-related feedback given during the task (i.e., post-auditory feedback), and (3) during the recovery phase after completion of the pressurized task (i.e., post-task recovery).
Experimental task
The visual search task was programmed and run using MATLAB (version Citation2014b) and Psychtoolbox (Kleiner et al., Citation2007; Psychtoolbox-3; www.psychtoolbox.org). At the start of each trial, sixteen white letters were presented on a black screen in a 4 × 4 grid array. Fifteen of the letters were an “H,” and one of the letters, the target, was an “E.” The mouse cursor was placed in the center of the screen, above the grid, at the start of each trial. Participants were instructed to find the “E” as quickly as possible and click on it with the mouse cursor. When the participant made a correct or an incorrect response, the target turned green or red, respectively. Feedback was presented on the screen for 0.5 seconds until the next trial began. All participants completed as many trials of the experimental task as they could in the three-minute time limit. illustrates the experimental task.
Figure 1. Diagram illustrating the experimental task.
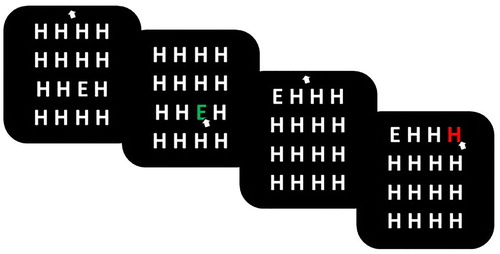
Approximately 60 seconds into the visual search task, participants received either positive or negative feedback via different auditory tones, dependent on the group they were randomly assigned. In the negative feedback group, participants heard a 2000Hz tone for 0.4 seconds followed by silence for 0.4 seconds (i.e., beeping), to indicate that they were performing poorly and going too slowly. In contrast, in the positive feedback group, participants heard a 200 Hz tone, followed by 250 Hz tone, and then a 300 Hz tone, each for 0.4 seconds (i.e., beeping), to indicate that they were performing well and ahead of time.
Measures
Cardiovascular reactivity. An impedance cardiograph device (Physioflow, PF05L1, Manatec Biomedical, Paris, France) was used to record cardiovascular data. HR and CO were estimated directly by the Physioflow, while TPR was estimated using the formula: mean arterial pressure/CO*80 (Sherwood et al., Citation1990). Mean arterial pressure was calculated using the formula [((2*diastolic blood pressure) + systolic blood pressure)/3] (Cywinski & Tardieu, Citation1980), with blood pressure recorded to calibrate the Physioflow using an OMRON-M6 Cuff (OMRON-M6, Medisave, UK). Two blood pressure measurements were taken, and then averaged, at four time points (i.e., baseline, post-pressure instructions, post-auditory feedback, and post-task recovery). HR was measured as an indicator of task engagement (VC and PEP were not calculated because they were not directly estimated by the Physioflow), while CO and TPR were used to index challenge and threat (e.g., Moore et al., Citation2013). In line with previous research (e.g., Moore et al., Citation2015), cardiovascular reactivity, or the difference between the final minute of baseline and a minute during each of the other three key time points in the experiment, were calculated for CO and TPR. Specifically, three reactivity values were calculated: (1) reactivity between the final minute of baseline and the minute after the pressure manipulation instructions (i.e., post-pressure instructions), (2) reactivity between the final minute of baseline and the minute after receipt of the in-task auditory performance-related feedback (i.e., post-auditory feedback), and (3) reactivity between the final minute of baseline and the last minute of recovery, following completion of the pressurized task (i.e., post-task recovery). HR reactivity was only calculated for time points one and two. In line with recent recommendations (Hase et al., Citation2019), the final minute of baseline and recovery were used to obtain true resting values from participants, and only one minute of data was recorded after the pressure manipulation instructions and in-task performance-related feedback to obtain participants’ immediate reactions, given the dynamic nature of challenge and threat states proposed by the BPSM (Blascovich, Citation2008).Footnote1 To differentiate challenge and threat states, CTI was created for each time point by converting each participant’s CO and TPR reactivity values into z-scores and summing them (Seery et al., Citation2009). CO was assigned a weight of +1 and TPR a weight of −1, such that a larger CTI value corresponded with a cardiovascular response more consistent with a challenge state (i.e., higher CO and/or lower TPR reactivity; Moore et al., Citation2015).
Task performance. Reaction time (ms) was taken for each trial, defined as the time between trial onset and the participants’ response (i.e., click on the letter with the mouse cursor). The total number of completed trials during the three-minute experimental task was also recorded. Task performance was split into pre- and post-auditory feedback in the analysis.
Procedure
Participants were randomly assigned to either the positive feedback (n = 20) or negative feedback (n = 20) group prior to entering the laboratory using a random number generator (http://www.randomizer.org). On arrival, participants provided demographic information (i.e., age, gender), had their height (cm) and weight (kg) recorded, and were fitted with the Physioflow. Following skin preparation, six spot electrodes were positioned on the thorax, two on the supraclavicular fossa of the left lateral aspect of the neck, two near the xiphisternum at the midpoint of the thoracic region of the spine, one on the middle of the sternum, and one on the rib closest to V6. After entering participants details (i.e., height, weight), the Physioflow was calibrated over 30 heart cycles while participants sat quietly resting in an upright position. Two resting blood pressure values were then taken (one prior to the 30 heart cycles and one during this time period), and the average was entered into the Physioflow to complete calibration. Five minutes of baseline cardiovascular data were then recorded while participants sat still and quietly rested in an upright position.
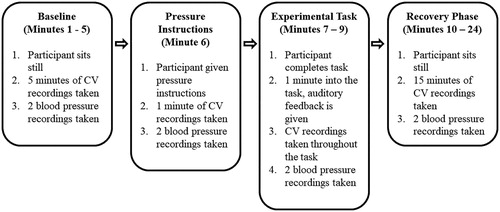
Next, all participants received the pressure manipulation instructions (see below for more details). Within these instructions, participants were played both the positive and negative feedback tones to ensure that they understood the feedback and implications (i.e., you are ahead of time or performing too slowly). Cardiovascular data were then recorded while participants sat quietly and reflected on the pressure manipulation instructions for one minute. Next, participants completed the pressurized visual search task. Approximately 60 seconds into the task, participants received either the positive or negative auditory tone to indicate their current level of performance or skill. The beeping lasted for approximately 20 seconds and then stopped. The participants then completed the rest of the task, which lasted three minutes in total. Finally, cardiovascular data were then recorded during a 15-minute recovery period, before participants were thanked and debriefed. The testing session lasted approximately 30 minutes in total. provides an overview of the experimental protocol.
Figure 2. Schematic diagram representing the experimental protocol.
Pressure manipulation instructions
A number of ego-threatening instructions were adapted from previous research to elevate pressure and help ensure task engagement (e.g., Sammy et al., Citation2017). First, all participants were advised about the importance of completing the experimental task, namely 100 trials within a three-minute timeframe, or their data could not be used. Second, the lead researcher emphasized that if they did not complete the task within this timeframe, another participant would have to be tested, incurring both time and financial costs. Third, participants were also told that, if they completed the task on time, they would be compared against other individuals through a published leader board. Meanwhile, if they did not complete the task on time, they would be interviewed at length at a later date about their poor performance.
Statistical analysis
Consistent with previous research (e.g., Moore et al., Citation2014), a dependent t-test was used to compare HR reactivity at baseline and post-pressure manipulation, and show that across the entire sample, task engagement was present. We also conducted a dependent t-test to compare HR reactivity at baseline and post-auditory feedback. Next, a 2 (Group: positive feedback, negative feedback) × 2 (Time: pre-feedback; post-feedback) mixed-model ANOVA was conducted with reaction time as the dependent variable to see if performance changed in response to the in-task auditory performance-related feedback. An independent t-test then explored if any between-group differences existed in the number of completed trials. Finally, a 2 (Group: positive feedback, negative feedback) × 3 (Time: post-pressure instructions, post-auditory feedback, and post-task recovery) mixed-model ANOVA was conducted with CTI as the dependent variable to see how challenge and threat states changed across the experimental protocol. Follow-up Bonferroni-corrected t-tests were conducted for both ANOVAs. Effect sizes were calculated using partial eta squared (ANOVAs) and Cohen’s d (t-tests). All summary level data is available from the Open Science Framework (https://osf.io/rpcyh/).
Results
Task engagement
A dependent t-test on the HR reactivity data showed that, in the sample as a whole, HR increased significantly from baseline to after receiving the pressure manipulation instructions (M = 4.60 bpm, SD = 4.44), t(39) = 6.55, p < .001, d = 1.04, and from baseline to after receiving the in-task auditory feedback, (M = 15.45 bpm, SD = 13.44), t(39) = 7.27, p < .001, d = 1.15). This indicates that, on average, participants were actively engaged in the pressurized task, allowing further examination of challenge and threat states (see ).
Table 2. Raw cardiovascular data (M ± SD) taken at each critical time point, including: (1) baseline, (2) post-pressure instructions, (3) post-auditory feedback, and (4) post-task recovery.
Task Performance
One participant’s performance data was lost due to technical difficulties. The ANOVA on the reaction time data revealed no significant main effect for Group, F(1, 37) = 1.14, p = .293, ηp²= .030. However, there was a significant main effect for Time, F(1, 37) = 76.56, p < .001, ηp² = .674, with both groups showing faster reaction times after receiving the in-task auditory feedback (M = 2.09 s, SD = 0.19), compared to before receiving the feedback (M = 2.26 s, SD = 0.24). There was no significant interaction effect, F(1, 37) = 0.00, p = .990, ηp² = 0.00. Finally, an independent t-test revealed no significant between-group differences in the number of completed trials in the pressurized task, t(37) = 0.35, p = .730, d = 0.12.
Cardiovascular reactivity
Four univariate outliers (values more than 3.3 SD units from the mean; Tabachnick & Fidell, Citation1996), from three participants, were winsorized by changing the deviant raw score to a value 1% larger or smaller than the next most extreme score (Shimizu et al., Citation2011). Following these outlier analyzes, all data were normally distributed as skewness and kurtosis z-scores did not exceed 1.96. shows the summary cardiovascular data at each of the four time points (i.e., baseline, post-pressure instructions, post-auditory feedback, and post-task recovery).
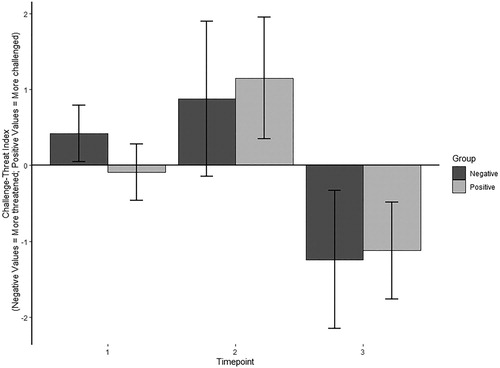
The ANOVA on the CTI data revealed no significant main effect for Group, F(1, 38) = 0.10, p = .920, ηp² = 0.00, indicating that the type of in-task auditory feedback had no effect on the cardiovascular markers of challenge and threat. However, there was a significant main effect for Time, F(2, 7) = 24.02, p < .001, ηp² = .387, indicating a change in CTI over the course of the task. Specifically, Bonferroni-corrected t-tests confirmed that, across both groups, participants displayed a higher CTI, indicating a cardiovascular reactivity pattern more reflective of a challenge state (i.e., higher CO and/or lower TPR reactivity), after receiving the in-task auditory feedback than after receiving the pressure manipulation instructions (p = .014). Furthermore, across both groups, participants displayed a lower CTI, reflecting a cardiovascular reactivity pattern more indicative of a threat state (i.e., lower CO and/or higher TPR reactivity), during the recovery phase than after receiving the pressure manipulation instructions and in-task auditory feedback (both ps < .001). This demonstrates fluctuations in cardiovascular reactivity across the course of the experiment (see ). Finally, there was no significant interaction effect, F(2, 76) = 0.82, p = .445, ηp² = .021.
Figure 3. CTI for the positive and negative feedback groups at each of the three critical time points: (1) post-pressure instructions, (2) post-auditory feedback, and (3) post-task recovery.
Exploratory analysis
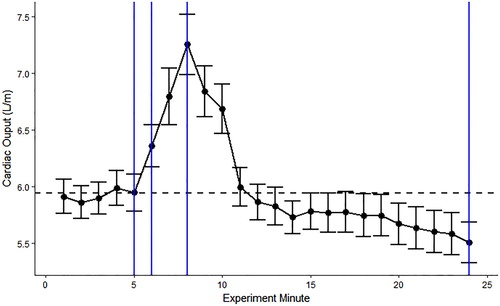
Since there was a main effect of time on CTI, we further examined how CO fluctuated across the experiment. Since the TPR calculation requires blood pressure measures, which were not taken at every minute, it was not suitable to explore TPR in this manner. shows raw CO values at each minute of the experiment. This was averaged across all participants because there was no significant main effect of group on CTI. While participants completed the experiment (minutes seven to nine), there was a peak in CO, which could have reflected the faster-acting SAM activation. During the recovery phase (minutes ten to 24), CO declined and dropped below baseline, which could have reflected the slower acting HPA activation suppressing the effects of SAM.
Figure 4. Raw cardiac output data (M ± SE) at each experiment minute. From the left to right, the blue lines represent the four critical time points, including: (1) baseline, (2) post-pressure instructions, (3) post-auditory feedback, and (4) post-task recovery.
Discussion
This study was the first to explore whether in-task performance-related feedback (i.e., not delivered during a break from the task), which was expected to modify a participant’s perceived skill level, affected cardiovascular reactivity during a pressurized visual search task. Two groups received different auditory feedback which they believed reflected their current performance on the task, but there was no difference in cardiovascular reactivity or performance between the groups. As such, our results conflict with those of Frings et al. (Citation2014), and suggest that more research is needed to further investigate the proposal that perceptions of skill are an important antecedent of demand and resource evaluations (Blascovich, Citation2014). It is possible that the method for delivering in-task performance-related feedback contributed to the differing results. Specifically, Frings et al. (Citation2014) administered their feedback verbally, which could have contributed to stronger effects due to social interaction and demand characteristics (Nichols & Maner, Citation2008). In contrast, the present study administered auditory feedback automatically, which may have elicited smaller effects on participants’ perception of their skill level. Since both verbal (e.g., coach on the side of a pitch) and auditory (e.g., a patient coding in hospital) feedback are present in real-life highly pressurized situations, both modes of feedback require further investigation. An alternative explanation for this result is that the feedback in the present experiment did not impact upon participants’ perception of skill level.
Given the proposed links between demand and resource evaluations and cardiovascular responses outlined in the BPSM (Seery, Citation2011), it was anticipated that any changes in demand and resource evaluations would be captured by the objective cardiovascular measures used. Such measures have the advantage of being relatively bias-free online indicators of challenge and threat, and were, therefore, most suitable for this experiment given the time-critical nature of the pressurized task that did not allow for breaks to capture subjective evaluations of task demands and coping resources. Given the null effect of group on cardiovascular measures, it would have been useful to have had a self-report measure as well to determine the effect of the manipulation on demand and resource evaluations (e.g., cognitive appraisal ratio; Tomaka et al., Citation1993).
Both groups displayed faster reaction times after the in-task auditory feedback. This suggests that, at a behavioral level, the feedback did have an effect, although there was still no overall difference in visual search performance between the positive and negative feedback groups. Participants in the negative feedback group may have sped up because they believed that they were not going to complete the pressurized task on time, which fits with findings that self-doubt can contribute to improved performance (e.g., Woodman et al., Citation2010). Meanwhile, participants in the positive feedback group might have believed that they were doing well, which could have raised their confidence and improved their performance (Tzetzis et al., Citation2008). The behavioral results showing faster reaction times after the feedback, and cardiovascular data showing that both groups displayed a more challenge-like response, fits also with the well-documented finding that entering a challenge state is associated with better performance (Behnke & Kaczmarek, Citation2018). Although it is evident that the feedback had some effect on participants, it is not possible to conclude how it affected their underlying demand and resource evaluations, further reinforcing the need to obtain such subjective data in future investigations. This issue highlights the benefit of using subjective and objective indices of challenge and threat simultaneously to fully explore how these parameters relate to each other and change during a pressurized task (Hase et al., Citation2019).
There was an effect of time on cardiovascular reactivity, with participants demonstrating a more challenge-like cardiovascular response after receiving the in-task auditory feedback (i.e., relatively higher CO and/or lower TPR reactivity), and a more threat-like cardiovascular response in the recovery phase (i.e., relatively lower CO and/or higher TPR reactivity). There are two likely explanations for the emergence of a threat-like response in the recovery period. First, the delayed threat-like cardiovascular response might have purely reflected the longer half-life of cortisol (i.e., a physiological effect). This suggests that researchers should consider the time course of the endocrine and cardiovascular systems that are activated during challenge and threat states (Meijen et al., Citation2020), and highlights a limitation of using blocked designs in challenge and threat research (i.e., instructions followed by task). Such designs oversimplify a dynamic response, and previous results could be biased by the time at which cardiovascular data is collected (Hase et al., Citation2019). Although both SAM and HPA activation mobilize energy reserves, the time course of these neuroendocrine and physiological responses is different. Specifically, SAM activation is relatively fast and leads to short-lived spikes in energy due to the quick release of catecholamines into the bloodstream (Seery, Citation2011). In contrast, the effects of HPA axis activation is slower, partly because cortisol has a half-life of over an hour and is more slowly released into the blood stream (Seery, Citation2013). Threat-like cardiovascular responses during motivated performance situations have been well-documented in the literature (e.g., Lupien et al., Citation2012; Mendes et al., Citation2007; Seery et al., Citation2004; Vick et al., Citation2008), however, our exploratory results suggest that the slower-acting cortisol release could also result in more threat-like responses after the task has finished too.
Second, participants could have continued to ruminate on how they performed on the pressurized task, and this appraisal – without the agency to affect performance – might have led to a more threat-like cardiovascular response (i.e., a cognitive effect with accompanying physiological responses). For example, Brosschot et al. (Citation2006) found that such perseverative cognition is a common response to stress that is associated with enhanced cardiovascular activity and, therefore, the engagement of such cognitive processes in a recovery period following a stressor requires further consideration. It is possible, for example, that participants were evaluating their performance during the recovery period in the present study and doubting whether they completed the task effectively or not, which could have contributed to the more threat-like cardiovascular response observed. This finding further reinforces the need for recovery periods to be included in future challenge and threat research. However, it must be acknowledged that the main aim of this study was not to investigate the time course of SAM and HPA activation, and therefore no strong conclusions can be made from the exploratory data presented. Nevertheless, moving forward, researchers should consider recording cardiovascular measures throughout an entire experimental protocol, which could yield interesting data enabling a better understanding of the time course of challenge and threat states (Meijen et al., Citation2020).
Limitations
Despite the novel findings, this study has some limitations. First, although a sample size calculation was used to determine the number of participants required, it should be acknowledged that the sample size was still small relative to previous research using similar between-subjects designs (e.g., n = 58 in Seery et al., Citation2008). Second, it is possible that the effect of the in-task performance-related feedback was too weak to induce reliable differences in cardiovascular markers of challenge and threat with only 20 participants in each group. Moreover, each participant could have interpreted the in-task performance-related feedback differently, with one participant hearing a negative tone and feeling capable of going faster, and another hearing the negative tone becoming overwhelmed. This type of negative feedback could be qualitatively different to feedback which focuses directly on a participant’s current level of performance relative to others (e.g., “you are currently ranked 5 out of 55 participants.”; Frings et al., Citation2014). Third, both HR and PEP are considered cardiovascular markers of task engagement in the BPSM (i.e., increased HR and/or decreased PEP reflects greater task engagement; Seery, Citation2011). However, only HR changes were estimated in this study because the physiological recording equipment used did not allow PEP to be calculated. Finally, future studies should aim to measure the neuroendocrine changes (e.g., cortisol) that accompany challenge and threat states to provide a more complete picture of the physiological responses associated with these states.
Conclusion
This study examined the effects of in-task auditory performance-related feedback on the cardiovascular markers of challenge and threat states during a pressurized visual search task, offering a test of perceived skill level as a possible antecedent. There was no effect of the type of in-task performance-related feedback (i.e., positive or negative) on cardiovascular reactivity or task performance, suggesting that more research is needed into the antecedents of challenge and threat states proposed by the BPSM (e.g., danger, familiarity, effort, prior performance). This is one of the first studies to provide direct evidence that the cardiovascular markers of challenge and threat fluctuate across a pressurized task, suggesting that these states are relatively dynamic and change over time. Participants displayed a more challenge-like response following in-task performance-related feedback, and a more threat-like cardiovascular response during recovery. However, more research is required to directly investigate the time course of SAM and HPA activation to fully understand their impact on challenge and threat states, thus highlighting the importance of including recovery phases in future studies, particularly given the importance of recovery from stress for future health.
Acknowledgements
We would like to thank Dan Tipp for his help with data collection.
Disclosure statement
No potential conflict of interest was reported by the author(s).
Additional information
Funding
Notes
1. The same qualitative pattern of results was observed if reactivity data were aggregated over longer time periods.
References
- Behnke, M., & Kaczmarek, L. D. (2018). Successful performance and cardiovascular markers of challenge and threat: A meta-analysis. International Journal of Psychophysiology, 130, 73–79. https://doi.org/10.1016/j.ijpsycho.2018.04.007
- Blascovich, J. (2008). Challenge, threat and health. In J. Y. Shah, & W. L. Gardner (Eds.), Handbook of motivation science (pp. 481–493). Guilford.
- Blascovich, J. (2014). Challenge, threat, and social influence in digital immersive virtual environments. In J. Gratch & S. Marsella (Eds.), Social emotions in nature and artefact (pp. 44–54). Oxford University Press.
- Blascovich, J., & Mendes, W. B. (2000). Challenge and threat appraisals: The role of affective cues. In J. P. Forgas (Ed.), Feeling and thinking: The role of affect in social cognition (pp. 59–82). Cambridge University Press.
- Blascovich, J., & Tomaka, J. (1996). The biopsychosocial model of arousal regulation. Advances in Experimental Social Psychology, 28, 1–51. https://doi.org/10.1016/S0065-2601(08)60235-X
- Brosschot, J. F., Gerin, W., & Thayer, J. F. (2006). The perseverative cognition hypothesis: A review of worry, prolonged stress-related physiological activation, and health. Journal of Psychosomatic Research, 60(2), 113–124. https://doi.org/10.1016/j.jpsychores.2005.06.074
- Chida, Y., & Steptoe, A. (2010). Greater cardiovascular responses to laboratory mental stress are associated with poor subsequent cardiovascular risk status. Hypertension, 55(4), 1026–1032. https://doi.org/10.1161/HYPERTENSIONAHA.109.146621
- Cywinski, J., & Tardieu, B. (1980). The essentials in pressure monitoring: Blood and other body fluids. Martinus Nijhoff Medical Division.
- Dienstbier, R. A. (1989). Arousal and physiological toughness: Implications for mental and physical health. Psychological Review, 96(1), 84–100. https://doi.org/10.1037/0033-295X.96.1.84
- Eliezer, D., Major, B., & Mendes, W. B. (2010). The costs of caring: Gender identification increases threat following exposure to sexism. Journal of Experimental Social Psychology, 46(1), 159–165. https://doi.org/10.1016/j.jesp.2009.09.015
- Frings, D., Rycroft, N., Allen, M. S., & Fenn, R. (2014). Watching for gains and losses: The effects of motivational challenge and threat on attention allocation during a visual search task. Motivation and Emotion, 38(4), 513–522. https://doi.org/10.1007/s11031-014-9399-0
- Glynn, L. M., Christenfeld, N., & Gerin, W. (2002). The role of rumination in recovery from reactivity: Cardiovascular consequences of emotional states. Psychosomatic Medicine, 64, 714–726. https://doi.org/10.1097/01.PSY.0000031574.42041.23
- Hase, A., O'Brien, J., Moore, L. J., & Freeman, P. (2019). The relationship between challenge and threat states and performance: A systematic review. Sport, Exercise, and Performance Psychology, 8(2), 123–144. https://doi.org/10.1037/spy0000132
- Herman, J. P., McKlveen, J. M., Ghosal, S., Kopp, B., Wulsin, A., Makinson, R., Scheimann, J., & Myers, B. (2011). Regulation of the hypothalamic-pituitary-adrenocortical stress response. Comprehensive Physiology, 6, 603–621. https://doi.org/10.1002/cphy.c150015
- Kleiner, M., Brainard, D., & Pelli, D. (2007). “What’s new in Psychtoolbox-3”. Perception. ECVP Abstract Supplement.
- Lupien, S. P., Seery, M. D., & Almonte, J. L. (2012). Unstable high self-esteem and the eliciting conditions of self-doubt. Journal of Experimental Social Psychology, 48, 762–765. https://doi.org/10.1016/j.jesp.2012.01.009
- MATLAB Release. (2014b). The MathWorks, Inc., Natick, Massachusetts, U.S.A.
- Meijen, C., Turner, M., Jones, M. V., Sheffield, D., & McCarthy, P. (2020). A theory of challenge and threat states in athletes: A revised conceptualization. Frontiers in Psychology, 11, 126. https://doi.org/10.3389/fpsyg.2020.00126
- Mendes, W. B., Blascovich, J., Hunter, S. B., Lickel, B., & Jost, J. T. (2007). Threatened by the unexpected: Physiological responses during social interactions with expectancy-violating partners. Journal of Personality and Social Psychology, 92, 698–716. https://doi.org/10.1037/0022-3514.92.4.698
- Mendes, W. B., & Park, J. (2014). Neurobiological concomitants of motivational states. In A. ElliotJ (Ed.), Advances in motivation science (pp. 233–270). Elsevier.
- Moore, L. J., Vine, S. J., Wilson, M. R., & Freeman, P. (2014). Examining the antecedents of challenge and threat states: The influence of perceived required effort and support availability. International Journal of Psychophysiology, 93(2), 267–273. https://doi.org/10.1016/j.ijpsycho.2014.05.009
- Moore, L. J., Vine, S. J., Wilson, M. R., & Freeman, P. (2015). Reappraising threat: How to optimize performance under pressure. Journal of Sport and Exercise Psychology, 37(3), 339–343. https://doi.org/10.1123/jsep.2014-0186
- Moore, L. J., Wilson, M. R., Vine, S. J., Coussens, A. H., & Freeman, P. (2013). Champ or chump?: Challenge and threat states during pressurized competition. Journal of Sport and Exercise Psychology, 35(6), 551–562. https://doi.org/10.1123/jsep.35.6.551
- Nichols, A. L., & Maner, J. K. (2008). The good-subject effect: Investigating participant demand characteristics. The Journal of General Psychology, 135(2), 151–166. https://doi.org/10.3200/GENP.135.2.151-166
- Otten, M. (2009). Choking vs. Clutch performance: A study of Sport performance under pressure. Journal of Sport and Exercise Psychology, 31(5), 583–601. https://doi.org/10.1123/jsep.31.5.583
- Quigley, K. S., Barrett, L. F., & Weinstein, S. (2002). Cardiovascular patterns associated with threat and challenge appraisals: A within-subjects analysis. Psychophysiology, 39(3), 292–302. https://doi.org/10.1017/S0048577201393046
- Sammy, N., Anstiss, P. A., Moore, L. J., Freeman, P., Wilson, M. R., & Vine, S. J. (2017). The effects of arousal reappraisal on stress responses, performance and attention. Anxiety, Stress and Coping, 30(6), 619–629. https://doi.org/10.1080/10615806.2017.1330952
- Scheepers, D., de Wit, F., Ellemers, N., & Sassenberg, K. (2012). Social power makes the heart work more efficiently: Evidence from cardiovascular markers of challenge and threat. Journal of Experimental Social Psychology, 48(1), 371–374. https://doi.org/10.1016/j.jesp.2011.06.014
- Scholl, A., Moeller, K., Scheepers, D., Nuerk, H. C., & Sassenberg, K. (2017). Physiological threat responses predict number processing. Psychological Research, 81(1), 278–288. https://doi.org/10.1007/s00426-015-0719-0
- Seery, M. D. (2011). Challenge or threat? Cardiovascular indexes of resilience and vulnerability to potential stress in humans. Neuroscience & Biobehavioral Reviews, 35(7), 1603–1610. https://doi.org/10.1016/j.neubiorev.2011.03.003
- Seery, M. D. (2013). The biopsychosocial model of challenge and threat: Using the heart to measure the Mind. Social and Personality Psychology Compass, 7(9), 637–653. https://doi.org/10.1111/spc3.12052
- Seery, M. D., Blascovich, J., Weisbuch, M., & Vick, S. B. (2004). The relationship between self-esteem level, self-esteem stability, and cardiovascular reactions to performance feedback. Journal of Personality and Social Psychology, 87, 133. https://doi.org/10.1037/0022-3514.87.1.133
- Seery, M. D., & Quinton, W. J. (2016). Understanding resilience: From negative life events to everyday stressors. In Advances in Experimental Social Psychology, 54, 181–245. Academic Press. https://doi.org/10.1016/bs.aesp.2016.02.002
- Seery, M. D., Weisbuch, M., & Blascovich, J. (2009). Something to gain, something to lose: The cardiovascular consequences of outcome framing. International Journal of Psychophysiology, 73, 308–312. https://doi.org/10.1016/j.ijpsycho.2009.05.006
- Seery, M. D., West, T. V., Weisbuch, M., & Blascovich, J. (2008). The effects of negative reflection for defensive pessimists: Dissipation or harnessing of threat? Personality and Individual Differences, 45(6), 515–520. https://doi.org/10.1016/j.paid.2008.06.004
- Sherwood, A., Allen, M. T., Fahrenberg, J., Kelsey, R. M., Lovallo, W. R., & Van Doornen, L. J. (1990). Methodological guidelines for impedance cardiography. Psychophysiology, 27(6), 1–23. https://doi.org/10.1111/j.1469-8986.1990.tb03189.x
- Shimizu, M., Seery, M. D., Weisbuch, M., & Lupien, S. P. (2011). Trait social anxiety and physiological activation: Cardiovascular threat during social interaction. Personality and Social Psychology Bulletin, 37(1), 94–106. 10.1177/0146167210391674
- Tabachnick, B. G., & Fidell, L. S. (1996). Using multivariate statistics. HarperCollins.
- Tomaka, J., Blascovich, J., Kelsey, R. M., & Leitten, C. L. (1993). Subjective, physiological, and behavioral effects of threat and challenge appraisal. Journal of Personality and Social Psychology, 68, 616–624.
- Tzetzis, G., Votsis, E., & Kourtessis, T. (2008). The effect of different corrective feedback methods on the outcome and self confidence of young athletes. Journal of Sports Science & Medicine, 7, 371–378.
- Vick, S. B., Seery, M. D., Blascovich, J., & Weisbuch, M. (2008). The effect of gender stereotype activation on challenge and threat motivational states. Journal of Experimental Social Psychology, 44, 624–630. https://doi.org/10.1016/j.jesp.2007.02.007
- Woodman, T., Akehurst, S., Hardy, L., & Beattie, S. (2010). Self-confidence and performance: A little self-doubt helps. Psychology of Sport and Exercise, 11(6), 467–470. https://doi.org/10.1016/j.psychsport.2010.05.009