
ABSTRACT
Background and Objectives
Individuals with social anxiety disorder show pronounced perceptual biases in social contexts, such as being hypervigilant to threat and discounting positive social cues. Parasympathetic activity influences responses to the social environment and may underlie these biases. This study examined the associations among social anxiety symptoms, heart rate variability (HRV), and vocal emotion recognition.
Design and Method
Female undergraduate students (N = 124) self-reported their social anxiety symptoms using the Social Anxiety Disorder Dimensional Scale and completed a computerized vocal emotion recognition task using stimuli from the Ryerson Audio-Visual Database of Emotional Speech and Song stimulus set. HRV was measured at baseline and during the emotion recognition task.
Results
Women with more social anxiety symptoms had higher emotion recognition accuracy (p = .021) and rated positive stimuli as less intense (p = .032). Additionally, although those with greater social anxiety symptoms did not have lower resting HRV (p = .459), they did have lower task HRV (p = .026), which mediated their lower positivity bias and greater recognition accuracy.
Conclusions
A parasympathetically-mediated positivity bias may indicate or facilitate normal social functioning in women. Additionally, HRV during a symptom- or disorder-relevant task may predict task performance and reveal parasympathetic differences that are not found at baseline.
Accurate emotion identification is critical to healthy social functioning. People with social anxiety disorder (SAD) have specific perceptual biases that influence emotion recognition. For instance, many studies have shown that those with SAD have poorer emotion recognition accuracy (Demenescu et al., Citation2010), albeit with some null findings (Arrais et al., Citation2010). Individuals with SAD are more attentive to threat (Joormann & Gotlib, Citation2006; Mogg et al., Citation2004), and more likely to label neutral or ambiguous stimuli as negative (Maoz et al., Citation2016; Mohlman et al., Citation2007).
People with SAD also may exhibit unique biases when processing vocal (auditory) stimuli. Such biases are especially important in the context of non face-to-face communication (e.g., phone conversations). However, a 2001 literature review acknowledged the paucity of work in this domain (Heinrichs & Hofmann, Citation2001). Since then, three studies have attempted to address this gap (Peschard & Philippot, Citation2017; Quadflieg et al., Citation2007; Tseng et al., Citation2017). One study found that those who scored high on a social anxiety self-report measure were more likely to label neutral vocal stimuli with negative emotions, showing a negativity bias compared to their less-anxious peers (Peschard & Philippot, Citation2017). Another found that those with SAD took longer to classify fearful vocal stimuli (Tseng et al., Citation2017). In a paradigm most similar to the current study, Quadflieg et al. (Citation2007) found that those with SAD correctly recognized more sad and fearful voices and fewer happy voices than controls, yet there were no between-group differences in the identification of neutral, disgust, and angry prosody or in ratings of stimuli intensity in this small sample. Thus, prior research suggests that those with clinical levels of social anxiety may struggle to identify positive vocal stimuli and tend to negatively label neutral or ambiguous stimuli, an imbalance that could fuel social avoidance. However, due to methodological limitations of prior research (e.g., small samples, categorical rather than dimensional approach to measuring social anxiety, non-matching speaker/listener sex), further examination of the perceptual biases among individuals with SAD is needed, with a focus on mechanisms linking SAD with emotional recognition.
Parasympathetic activity positively tracks with emotion recognition ability (Park et al., Citation2012; Quintana et al., Citation2012). In fact, recent evidence suggests that the vagus nerve can causally influence emotion recognition ability; compared to sham stimulation, vagus nerve stimulation boosted emotion recognition (Colzato et al., Citation2017). The vagus nerve’s activity can be measured non-invasively by looking at the variation of time between each heartbeat, called heart rate variability (HRV), which indexes vagal control over the heart (Thayer & Sternberg, Citation2006). Higher resting HRV is associated with better regulation of emotions and responsivity to environmental demands, including and perhaps especially social threats (Porges, Citation2001), due to greater integration of cortical and subcortical (e.g., limbic) structures (Thayer & Lane, Citation2009). Conversely, lower resting HRV indicates poorer integration, and, consequently, less flexibility in responding to environmental demands. Important to the current study, lower resting HRV predicts poorer emotion recognition accuracy (Lischke et al., Citation2017; Quintana et al., Citation2012).
There is mixed evidence concerning the relationship of SAD to resting HRV, but meta-analytic evidence suggests that SAD is linked to lower HRV (Chalmers et al., Citation2014). Even so, SAD’s physiological impact may be most evident during disorder-relevant (i.e., social) tasks. For instance, compared to healthy controls, those with anxiety and depression had at least marginally lower HRV indices during a psychiatric interview but not during a general interview or continuous performance test (Hu et al., Citation2016). Similarly, compared to their less neurotic peers, those with high levels of neuroticism did not have lower HRV at rest, but did have lower HRV when actively regulating their emotions (Di Simplicio et al., Citation2012). Notably, HRV during an emotional image processing task was able to discriminate depressed individuals from non-depressed individuals with 90% accuracy (Xing et al., Citation2019). Further research is needed to investigate the concurrent and predictive validity of task HRV.
The current study
To further evaluate perceptual biases along the continuum of social anxiety symptoms, the current study assessed the relationships among social anxiety symptomatology, parasympathetic activity as indexed by HRV, and vocal emotional recognition in female undergraduate students. Both task and resting HRV were explored as physiological mediators of emotion recognition, and the non-clinical sample provided a continuum of social anxiety symptoms. Additionally, the study sample, the actors who recorded the vocal stimuli, and the experimenters were all women to eliminate the potential confound of sex (McKeown et al., Citation2015). To bolster external validity, content-neutral vocal stimuli were used, rather than the nonsensical vocalizations used in prior studies.
We hypothesized that women with greater social anxiety symptoms would less accurately identify positive stimuli, more accurately identify negative stimuli, label more neutral stimuli as negative (i.e., greater negativity bias), label fewer neutral stimuli as positive (i.e., lower positivity bias), rate negative stimuli as more intense (i.e., greater negativity bias), and rate positive stimuli as less intense (i.e., lower positivity bias) than their peers with fewer social anxiety symptoms. We made no hypothesis about overall emotion recognition accuracy due to prior conflicting findings (Arrais et al., Citation2010; Demenescu et al., Citation2010). Additionally, we hypothesized that higher social anxiety would relate to lower HRV during the emotion recognition task, which would mediate these outcomes (see for hypotheses).
Table 1 Hypotheses and findings
Method
The study was approved by the Institutional Review Board at Ohio State University. Prior to recruitment, hypotheses were pre-specified and an a priori power analysis was conducted with G-Power 3. Previous work among clinical samples demonstrated that social anxiety had a medium effect on negativity bias (Cohen’s d = 0.54; Peschard & Philippot, Citation2017), a small effect on positivity bias (r = −.39; Quadflieg et al., Citation2007), a small effect on intensity ratings for negative stimuli (r = .22; Schofield et al., Citation2007), a medium effect on intensity ratings for positive stimuli (η2 = 0.10; Yoon & Zinbarg, Citation2009), large effects on recognition accuracy for negative stimuli (Cohen’s d = 0.85) and positive stimuli (Cohen’s d = −0.90; Quadflieg et al., Citation2007), and a medium effect on resting HRV (Cohen’s d = −0.58; Alvares et al., Citation2013). Additionally, resting HRV had a large effect on positive stimuli recognition accuracy (q = 0.57; Lischke et al., Citation2017), but our other hypotheses were exploratory due to a lack of relevant prior data. Because our sample was non-clinical, we estimated that the effect sizes might be smaller (i.e., f2 = 0.08). Using linear regression with a two-tailed test of the hypothesis, at least 101 participants were needed to achieve 80% power for all hypotheses. However, in the mediation models, based on the expected effect sizes for the a and b paths, the power may not have reached the .80 level (Koopman et al., Citation2015). Participants were female undergraduate students participating in research for course credit at the Ohio State University. The study population was ideal, as the transition to college and pressure to make friends may worsen subclinical social anxiety symptoms; in one sample of first-year undergraduates, 42% had clinical levels of social anxiety (Stewart & Mandrusiak, Citation2007). Additionally, in non-clinical samples, women have higher 12-month (6.5%) and lifetime (10.3%) prevalence rates of SAD than men (4.8% and 8.7%, respectively) (McLean et al., Citation2011). To eliminate the potential confound of cultural differences on emotion recognition accuracy (Elfenbein & Ambady, Citation2002; Paulmann & Uskul, Citation2014), only students who spoke English as their first language were included. Additionally, students who were hearing impaired were excluded. Data were collected between October and December 2018. Each participant completed the experimental session in a private room.
After participants provided informed consent, they completed online surveys as well as the computerized vocal emotion recognition trial with eight stimuli – one from each emotional category. Following the trial, the participants completed the emotion recognition task, described in detail below, while HRV was measured simultaneously to explore a mediation pathway.
Self-report measures
Demographic information
Participants provided the following information: age, weight, height, mental health diagnoses, medication usage, and recent caffeine and alcohol consumption. Older age (Umetani et al., Citation1998), higher BMI (Molfino et al., Citation2009), and alcohol use are associated with lower HRV (Weise et al., Citation1986), while caffeine use may boost HRV (Koenig et al., Citation2013) and influence emotion recognition accuracy (Huck et al., Citation2008).
Social anxiety
The Social Anxiety Disorder Dimensional Scale (SAD-D); (Lebeau et al., Citation2012) takes a dimensional, rather than categorical, approach to symptom measurement, with the goal of capturing the full range of social anxiety symptomatology. As such, there is no cut-score or categorical labels. The measure consists of 10 questions, each rated on a 5-point Likert scale ranging from “never” to “always.” Raw scores range from 0 to 40, with higher scores indicating greater symptomatology. In the current study, the SAD-D’s internal consistency was Cronbach’s α = 0.86. The measure is clinically sensitive; in one study, those without SAD (M = 5.0, SD = 5.7) scored significantly lower on the SAD-D than those with subthreshold SAD (M = 15.4, SD = 8.3), who score lower than those with above-threshold SAD (M = 28.2, SD = 9.2) – with clinical status determined by the Munich-Composite International Diagnostic Interview (Knappe et al., Citation2013). Demonstrating discriminant validity, the scale distinguished social anxiety symptoms from those of specific phobia, panic disorder, and separation anxiety in females, but not those of generalized anxiety disorder (GAD) (Möller & Bögels, Citation2016) – likely due to high comorbidity and substantial symptom overlap between GAD and SAD.
Heart rate variability
HRV was collected with the Firstbeat BodyGuard 2 device (Firstbeat Technologies Ltd, Jyväskylä, Finland), which measures the interval between heart rates (i.e., R-R interval; the inverse of heart rate) with a sampling frequency of 1000 Hz. Its accuracy is comparable to a clinical electrocardiogram (Parak & Korhonen, Citation2013). HRV was measured during a five-minute seated rest period at the beginning of the study protocol. During resting period, participants were instructed to breathe normally and not use their phones or other devices. HRV was also collected during the first two minutes of the vocal emotion recognition task to capture initial task HRV before the first resting period of the task, while the task was still novel (see task protocol below). According to recently updated measurement standards, a two-minute recording provides a valid measurement of RMSSD (Laborde et al., Citation2017). Electrocardiogram (ECG) data from the Firstbeat monitor was extracted and transferred to KUBIOS software (Tarvainen et al., Citation2014). The software was used to remove artifacts and obtain the root mean square of the successive differences between heart beats (RMSSD), a time-domain metric that validly measures parasympathetic activity (Shaffer & Ginsberg, Citation2017). The raw Firstbeat data required little artifact correction; the average percentage of heart beats corrected was 0.0019% during the resting period and 0.032% during the vocal recognition task. Overall, 83% of resting measurements and 89% of task measurements did not require correction.
Vocal emotion recognition
The limited research on vocal emotional expression has often utilized pseudo-speech (i.e., nonsensical words) to assess emotion recognition ability, limiting its ecological validity. To isolate participants’ ability to recognize emotion based solely on emotional prosody (i.e., tone, pitch, inflection) rather than sentence content, the current study used semantically-neutral prosodic speech stimuli from the Ryerson Audio-Visual Database of Emotional Speech and Song (RAVDESS) (Livingstone & Russo, Citation2018). These pre-recorded vocal stimuli featured 12 female Canadian actors who spoke Standard North American English as their first language and had no discernable Canadian accent. Only the recordings of female actors were used in this study to eliminate the potential confound of mismatched speaker-listener sex (Lausen & Schacht, Citation2018).
Using two statements matched in word frequency and familiarity (e.g., “Kids are talking by the door” and “Dogs are sitting by the door”), actors expressed the following seven emotions by altering tone, pitch, and intonation: calm, happy, sad, angry, fearful, surprise, and disgust. Additionally, they recorded the sentences in a neutral tone. In the RAVDESS, each emotion is portrayed at two intensity levels: normal and strong. Only normal intensity stimuli were used for the current study to avoid potential ceiling effects. In a validation study with 247 North American raters, 60% of the audio-only stimuli were correctly identified (Livingstone & Russo, Citation2018). Testing with an additional 72 North American raters (each rating 102 stimuli twice) demonstrated a test-retest reliability of Cohen’s kappa = 0.73 (Livingstone & Russo, Citation2018).
Participants first completed an emotion recognition trial in which they had 10 s to label and rate each of 8 randomly selected stimuli, one from each emotional category. These stimuli were distinct from the stimuli presented during the primary task (detailed below), and the data were not used in analyses. Participants were invited to ask any questions about the instructions or completion of the trial prior to beginning the primary task.
During the emotion recognition task, vocal stimuli were presented in 4 blocks of 24with 1 min between each block. The block presentation order was randomized with the block randomization feature on Qualtrics (Provo, UT). The task took no longer than 19 min including rest time between blocks. Voice clips lasted 2–4 s, and the participant listened to the clip only once before labeling and rating the intensity of each stimulus. To capture initial impressions, participants were given 10 s to label and rate each stimulus before the survey auto-advanced to the next stimulus, in which case no answer was recorded (<1% of total possible responses). These missed trials were not counted as incorrect, but instead they were excluded from data analyses. Participants’ choices for labeling the emotion included the seven emotions listed above as well as “neutral” and the escape option of “none of the above.” The answer of “none of the above” was counted as incorrect. Of the 384 possible normal-intensity audio-only files (32 trials for each of the 12 female actors), all participants heard the same 96 files, stratified by emotional condition. These 96 files were randomly selected using a random number generator. Thus, there were 12 stimuli for each emotional category and 12 neutral stimuli, all presented in a random order.
Statistical analyses
Data management
To index negativity bias for each individual, all neutral and ambiguous (i.e., surprise) vocal stimuli classified as negative (i.e., fearful, sad, angry, disgusted) were totaled and divided by the total number of neutral and ambiguous stimuli answered. For positivity bias, all neutral and ambiguous vocal stimuli classified as positive were totaled and divided by the total number of neutral and ambiguous stimuli answered. As another measure of perceptual bias, mean intensity ratings for positive and negative vocal stimuli were calculated as two separate outcomes. To index recognition accuracy across the categories of interest (negative, positive, and overall), an individual’s number of stimuli correctly identified in each category was divided by the total number of stimuli answered in that category.
In all models, Cook’s distance was used to identify potentially influential cases. Such cases were not excluded from a model unless they appeared to violate the model’s assumption of residual homoscedasticity, which was determined through visual inspection of the residual plots. Residuals were skewed in models with HRV as the outcome, so HRV was natural-logarithmic transformed. Only one participant reported recent alcohol usage; thus, instead of adjusting for alcohol use, data from this participant were excluded from models.
Analytical plan
Zero-order correlations were used to examine relationships between the variables of interest. We then conducted paired t-tests to identity any differences between: a. Task and resting HRV, b. Percentage of positive and negative stimuli correctly identified, c. Percentage of neutral stimuli labeled as positive and percentage labeled as negative, d. Intensity ratings for positive stimuli and intensity ratings for negative stimuli. Beyond these preliminary analyses, four relationships were of primary interest: a. SAD-D scores predicting emotion recognition accuracy/perceptual biases; b. SAD-D scores predicting task and resting HRV; c. Task and resting HRV predicting emotion recognition accuracy/perceptual biases; d. The indirect effect of SAD-D scores on emotion recognition accuracy/perceptual biases through task and resting HRV (i.e., mediation). To examine the first three relationships, two-step linear regression models were constructed. In the first step, no covariates were included. In the second step, recent caffeine was included for models with emotion recognition variables as the outcome, and recent caffeine use and BMI were included as covariates in models with HRV as the independent or dependent variable. The PROCESS version 2 macro for SPSS (Hayes, Citation2012) was used to generate 5,000 bootstrapped samples to estimate a bias-corrected confidence interval around the indirect effects of social anxiety symptoms on response biases and recognition accuracy through HRV. One post-hoc double-mediation analysis utilizing PROCESS was performed with task HRV and positivity bias as the serial mediators linking SAD-D scores with overall emotion recognition accuracy. We report unstandardized betas for all analyses. All analyses were conducted in SPSS version 25 (IBM: Armonk, NY), and the alpha level was set at 0.05; 95% confidence intervals are reported.
Results
Demographic information
Female undergraduate students (N = 124) tended to be young (M = 18.6 years, SD = 1.2, Range = 18–29), non-Hispanic (95%), and White (77%). Overall, 12 participants reported taking a selective serotonin reuptake inhibitor, 1 reported taking a tricyclic antidepressant, and no participants reported taking beta blockers or benzodiazepines. In terms of self-reported anxiety and depression diagnoses, 7 indicated that they had an unspecified anxiety disorder, 8 had generalized anxiety disorder, 1 had SAD, and 11 reported an unspecified depression diagnosis. Although it was a non-clinical sample, the average SAD-D score was high, with considerable range (M = 15.7, SD = 6.7, range = 0–33). In fact, 50.4% of participants were at or above the mean score of adults with subthreshold SAD (M = 15.4) (Knappe et al., Citation2013). Other demographic information are presented in .
Table 2. Demographic information for the sample (N = 124).
Preliminary analyses
On average, participants were able to correctly identify more than two-thirds of the vocal stimuli and were better at identifying negative stimuli (M=0.8, SD = 0.1) than positive stimuli (M = 0.5, SD = 0.1; paired t(123) = −18.9, p < .001, Cohen’s d = 2.4). Women rated negative stimuli as more intense (M = 6.3, SD = 0.9) than positive stimuli (M = 4.8, SD = 1.3) (paired t(123) = 20.1, p < .001, Cohen’s d = 1.3). Women also labeled neutral and ambiguous (i.e., surprise) stimuli with positive emotions (M = 0.3, SD = 0.1) more so than negative emotions (M = 0.1, SD = 0.1) (t(123) = 15.5, p < .001, Cohen’s d = 2.0), suggestive of greater overall positivity bias than negativity bias. Resting HRV (M = 41.0, SD = 25.0) and task HRV (M = 48.0, SD = 27.3) were significantly different (paired t(123) = −5.6, p < .001, Cohen’s d = 0.3). Scatterplots of significant zero-order correlations are included in the supplementary material. For zero-order correlations among all study variables, see .
Table 3. Zero-order correlations between study variables.
Social anxiety symptoms and emotion recognition
Social anxiety symptoms and perceptual bias
As expected, those with higher social anxiety symptoms rated positive stimuli as less intense than their peers (B = −0.037, SE = 0.017, p = .032). The effect remained after controlling for recent caffeine use (B = −0.038, SE = 0.017, p = .032). Regardless of covariate inclusion, SAD-D was unrelated to negativity bias (unadjusted: B = 0.001, SE = 0.001, p = .303; adjusted: B = 0.001, SE = 0.001, p = .316), positivity bias (unadjusted: B = −0.002, SE = 0.002, p = .165; adjusted: B = −0.002, SE = 0.002, p = .165), or average intensity ratings for negative stimuli (unadjusted: B = −0.009, SE = 0.012, p = .455; adjusted: B = −0.010, SE = 0.013, p = .410).
Social anxiety symptoms and emotion recognition accuracy
There was no relationship between SAD-D scores and recognition of negative (B = 0.001, SE = 0.001, p = .358) or positive (B < 0.001, SE = 0.002, p = .836) emotions. Adding covariates did not change results (negative: B = 0.001, SE = 0.001, p = .293; positive: B < 0.001, SE = 0.002, p = .890). However, women with greater social anxiety symptomology had better overall recognition accuracy across all emotional stimuli (B = 0.002, SE = 0.001, p = .031). This effect remained significant after adding recent caffeine use (B = 0.002, SE = 0.001, p = .021).
Social anxiety and heart rate variability
Those with greater social anxiety symptomology had lower task HRV (B = −0.016, SE = 0.007, p = .023), and this relationship remained significant after adjusting for BMI and caffeine use (B = −0.016, SE = 0.007, p = .026). Social anxiety was unrelated to resting HRV before (B = −0.006, SE = 0.008, p = .446) and after (B = −0.006, SE = 0.008, p = .459) covariate inclusion.
Heart rate variability and emotion recognition
Heart rate variability and perceptual bias
In separate models, both task and resting HRV were related to the proportion of neutral/ambiguous stimuli identified as positive, a measure of positivity bias (B = 0.001, SE < 0.001, p = .040; B = 0.001, SE = 0.001, p = .013, respectively), and these relationships remained when all covariates were included (B = 0.001, SE < 0.001, p = .042; B = 0.001, SE = 0.001, p = .014, respectively). Task and resting HRV were unrelated to the proportion of neutral/ambiguous stimuli identified as negative (B < 0.001, SE < 0.001, p = .280; B < 0.001, SE < 0.001, p = .545, respectively), intensity ratings for negative stimuli (B = −0.002, SE = 0.003, p = .584; B = −0.002, SE = 0.004, p = .598, respectively), and intensity ratings for positive stimuli (B = −0.002, SE = 0.005, p = .725; B = −0.002, SE = 0.005, p = .716, respectively). When covariates were added, task and resting HRV remained unrelated to the proportion of neutral/ambiguous stimuli identified as negative (B < 0.001, SE < 0.001, p = .280; B < 0.001, SE < 0.001, p = .551, respectively), intensity ratings for negative stimuli (B = −0.002, SE = 0.003, p = .575; B = −0.002, SE = 0.004, p = .626, respectively), and intensity ratings for positive stimuli (B = −0.002, SE = 0.005, p = .716; B = −0.002, SE = 0.005, p = .715, respectively).
Heart rate variability and recognition accuracy
Task HRV was unrelated to the correct identification of negative (unadjusted: B < 0.001, SE < 0.001, p = .697; adjusted: B < 0.001, SE < 0.001, p = .638) or positive stimuli (unadjusted: B < 0.001, SE < 0.001, p = .773 adjusted: B < 0.001, SE < 0.001, p = .794). Similarly, resting HRV was not related to the correct identification of negative (unadjusted: B < 0.001, SE < 0.001, p = .536; adjusted: B < 0.001, SE < 0.001, p = .467) or positive stimuli (unadjusted: B < 0.001, SE < 0.001, p = .758; adjusted: B < 0.001, SE < 0.001, p = .776). However, those with higher task and resting HRV had lower overall recognition accuracy across all stimuli (B > −0.001, SE < 0.001, p = .041; B > 0.001, SE < 0.001, p = .031, respectively). These relationships remained significant after the addition of all covariates (B > −0.001, SE < 0.001, p = .036; B > −0.001, SE < 0.001, p = .025, respectively).
Mediation: social anxiety symptoms, HRV, and perceptual bias/recognition accuracy
After testing the previous hypotheses and finding that social anxiety symptoms uniquely predicted task HRV and not resting HRV, only task HRV was tested as a mediator of the relationship between social anxiety and emotion recognition/perceptual biases.
Social anxiety symptoms, task HRV, and perceptual bias
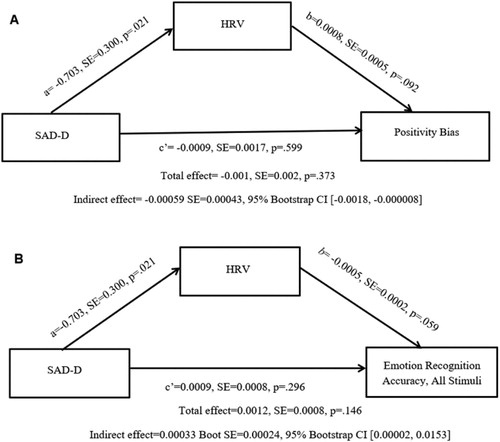
Although social anxiety symptoms were not directly associated with positivity or negativity bias, an indirect effect emerged such that through their lower HRV, women with greater social anxiety had a lower positivity bias (Indirect effect = −0.00059, SE = 0.00043, 95% bootstrap CI [−0.0018, −0.000008]) (see A). No indirect effect emerged when negativity bias (95% bootstrap CI: [−0.000078, 0.00059]) and intensity ratings for negative [−0.0033, 0.0062] or positive stimuli [−0.0034, 0.0121] were specified as outcomes.
Figure 1. Through their lower HRV during the emotion recognition task, women with more social anxiety symptoms had lower positivity bias (A) and greater emotion recognition accuracy (B) than their peers. Effects are unstandardized.
Social anxiety symptoms, task HRV, and recognition accuracy
Through their lower task HRV, women with more social anxiety symptoms had better overall recognition accuracy (Indirect effect = 0.00033 SE = 0.00024, 95% Bootstrap CI [0.00002, 0.0153]) (see B). Task HRV did not mediate the relationship between social anxiety and recognition of negative and positive stimuli (95% bootstrap CIs: [−0.00017, 0.00116]; [−0.0006, 0.0009], respectively).
Post-hoc double mediation model
To test whether lower parasympathetically-mediated positivity bias could explain why those with more social anxiety symptoms had better emotion recognition accuracy rates, a post-hoc serial double mediation model was conducted with SAD-D scores as the independent variable, task HRV as the first mediator, positivity bias as the second mediator, and accuracy rates for all stimuli as the outcome. Indeed, those with greater social anxiety were more accurate due to lower parasympathetically-mediated positivity bias (Indirect effect = 0.00010, SE = 0.00007, 95% bootstrap CI [0.00004, 0.00031]).
Alternative model
To test whether the difference between task HRV and resting HRV related to social anxiety symptoms or task performance, alternative linear regression models were run substituting the difference score for task HRV. Those with higher social anxiety symptoms had lower HRV difference scores, both with (B = −0.390, SE = 0.190, p = .042) and without (B = −0.038, SE = 0.186, p = .044) controlling for caffeine usage and BMI. The difference score was unrelated to negativity bias (unadjusted: B < 0.001, SE < 0.001, p = .393; adjusted: B < 0.001, SE < 0.001, p = .390) positivity bias (unadjusted: B = −0.001, SE = 0.001, p = .461; adjusted: B = −0.001, SE = 0.001, p = .452), intensity ratings for negative stimuli (unadjusted: B = −0.002, SE = 0.006, p = .700; adjusted: B = −0.003, SE = 0.006, p = .632), intensity rating for positive stimuli (unadjusted: B = −0.001, SE = 0.008, p = .921; adjusted: B = −0.001, SE = 0.008, p = .912), recognition accuracy for negative stimuli (unadjusted: B < 0.001, SE = 0.001, p = .530; adjusted: B < 0.001, SE = 0.001, p = .632), recognition accuracy for positive stimuli (unadjusted: B = −0.001, SE = 0.001, p = .173; adjusted: B = −0.001, SE = 0.001, p = .190) or overall recognition accuracy (unadjusted: B < 0.001, SE < 0.001, p = .426; adjusted: B < 0.001, SE < 0.001, p = .503). Therefore, we did not proceed in testing the full mediation model.
Discussion
In the current study, women with more social anxiety symptoms had lower parasympathetic activity while processing socially-relevant information, which was linked to their perception of vocal stimuli. Specifically, compared to their peers, those who reported more social anxiety symptoms had a lower positivity bias, and therefore, greater overall recognition accuracy. Prior evidence suggests that non-anxious people have a positivity bias (Huppert et al., Citation2007; Taylor & Brown, Citation1988; Young et al., Citation2017), and this may be especially prevalent in women (Proverbio, Citation2017; Winquist et al., Citation1998). Thus, a lack of positivity bias may typify social anxiety in women (Constans et al., Citation1999). Moreover, our finding that women with greater social anxiety rated positive stimuli as less intense supports the theory that those who are socially anxious minimize positive social cues (Silvia et al., Citation2006).
Another characteristic of social anxiety may be lower HRV in social contexts. While meta-analytic evidence suggests that those with SAD have lower resting HRV (Chalmers et al., Citation2014), we were unable to replicate this effect in our nonclinical sample. Instead, we found that those with greater social anxiety symptoms had lower task – but not resting – HRV. These results suggest that the effect of social anxiety symptomology on HRV may be most evident in contexts that are highly relevant to the disorder – such as an emotion recognition task. Similarly, a prior study found that compared to healthy controls, those with anxiety and depression had greater HRV reactivity to a disorder-relevant stressor (i.e., a psychiatric interview) but not a disorder-irrelevant continuous performance task (Hu et al., Citation2016). Unexpectedly, across our sample, task HRV was actually higher than resting HRV, suggesting that participants may have habituated to the novel study environment throughout the study protocol. Even so, those with higher social anxiety symptomology were less able to habituate, as evidenced by their lower HRV difference scores in our alternative model.
Interestingly, both resting and task HRV predicted emotion recognition accuracy and positivity bias. Women with higher HRV had a greater positivity bias, interpreting neutral and ambiguous stimuli as positive, but lower recognition accuracy. These results conflict with prior findings that those with higher resting HRV have better emotion recognition accuracy (Lischke et al., Citation2017; Quintana et al., Citation2012), but the current study is the first to associate resting HRV with vocal, rather than facial stimuli. Further investigation into why stimuli type (facial versus vocal) might moderate the relationship between resting HRV and emotion recognition accuracy is warranted. Moreover, the current findings suggest that task HRV, especially during a symptom- or disorder-relevant task, may also relate to task performance – another area for further inquiry.
The observed positivity bias among those with greater resting HRV may fuel pro-social behavior. For early humans, social affiliation was critical to survival, and this may have been especially true for women. Taylor et al. (Citation2000) hypothesized that because of this evolutionary necessity, modern women respond to stress by “tending and befriending” rather than fighting or fleeing, as is more common in men. Thus, a pro-social positivity bias may promote or indicate social well-being, at least in women. However, we did not measure social well-being or include men in our study, so more research is needed to test these hypotheses.
Unlike previous work (e.g., Maoz et al., Citation2016), social anxiety symptoms were unrelated to negativity bias. Additionally, the observed positive relationship between social anxiety symptoms and overall recognition accuracy contrasts with meta-analytic evidence of poorer overall recognition accuracy for facial stimuli among those with SAD (Demenescu et al., Citation2010). However, the forced two-choice paradigm (e.g., “happy” or “angry”) used in many prior studies is overly simplistic (Russell, Citation1993). This study utilized an assessment with nine response options, including an “escape option” (i.e., “none of the above”). This study also differed from past studies in that the vocal stimuli used did not directly address or refer to the participant but instead described a neutral circumstance (e.g., “The dog is sitting by the door”), and in the use of vocal recognition rather than facial recognition.
Many prior studies used vocal stimuli recorded by both men and women, but perceptions are influenced by a complex interaction between speaker and listener sex (McKeown et al., Citation2015). Many studies that utilized both male and female participants and both male and female stimuli were likely not powered to capture this interaction (e.g., Quadflieg et al., Citation2007). By only utilizing female participants and vocal stimuli recorded by female actors, the current study eliminated this confound, providing a clearer picture of social cognition as it relates to continuous social anxiety symptom scores.
Limitations, implications and future directions
Due to testing perceptual biases, intensity ratings, and accuracy, many statistical tests were conducted, and therefore, findings should be interpreted with caution. The choice to exclude men may limit generalizability of the study results. Also noteworthy is that the sample was primarily first-semester undergraduates who were likely experiencing high stress levels in their new environment, as supported by the elevated mean SAD-D score. Although the computerized task had high internal validity, the impersonal quality of the task may have muted the effects of social anxiety on the outcomes of interest. Indeed, social anxiety may exert a greater effect on emotion recognition in personally-relevant situations or with stimuli that reference the participant (Amir et al., Citation1998). Also, the cross-sectional design of the study limits the ability to tease out directionality. While the mediation models support the notion that social anxiety leads to lower task HRV which leads to positivity bias/recognition accuracy, future longitudinal studies are needed to determine directionality.
Effective social anxiety treatment may include increasing benign interpretations of neutral/ambiguous situations, which appears to be an effective cognitive–behavioral therapy intervention for SAD (Amir & Taylor, Citation2012; Murphy et al., Citation2007). Also, as low HRV is a facet of social anxiety, enhancing parasympathetic activity may be another therapeutic target among socially anxious women. Emerging evidence indicates that both cognitive–behavioral therapy (Jang et al., Citation2017), mindfulness meditation (Shearer et al., Citation2016), and exposure therapy (Busscher et al., Citation2013) can boost HRV, and this increase is related to better therapeutic outcomes (Jang et al., Citation2017).
Functional implications of these perceptual biases were not explored in the current study. However, it is plausible that a dampened positivity bias contributes to avoidance behaviors that characterize SAD. Thus, a muted positivity bias may be at the root of loneliness and social isolation that accompanies elevated social anxiety symptoms. Not only does loneliness mediate the relationship between greater social anxiety symptoms and diminished subjective wellbeing (Maričić & Štambuk, Citation2015), it can also predispose to many chronic health problems via alterations in neuroendocrine, autonomic, and immune function (Cacioppo & Cacioppo, Citation2014). Therefore, augmenting motivation to engage in neutral/ambiguous social situations may promote physical health through increased social engagement and integration.
Further exploration of HRV as a mechanism behind emotion recognition and perceptual biases in clinical samples with SAD is warranted. In particular, HRV during social situations may be an important mechanism underlying social cognition in SAD. The current study did not find evidence of poorer emotion recognition accuracy among those with greater social anxiety symptomology. In this study, women with more social anxiety symptoms exhibited enhanced recognition accuracy due to a lower positivity bias. These findings pave the way for further investigation of HRV during a symptom or disorder-relevant task as a physiological mechanism fueling task impairment.
Supplemental Material
Download MS Word (135.2 KB)Disclosure statement
No potential conflict of interest was reported by the author(s).
References
- Alvares, G. A., Quintana, D. S., Kemp, A. H., Van Zwieten, A., Balleine, B. W., Hickie, I. B., & Guastella, A. J. (2013). Reduced heart rate variability in social anxiety disorder: Associations with gender and symptom severity. PloS One, 8(7), e70468. https://doi.org/10.1371/journal.pone.0070468
- Amir, N., Foa, E. B., & Coles, M. E. (1998). Automatic activation and strategic avoidance of threat-relevant information in social phobia. Journal of Abnormal Psychology, 107(2), 285–290. https://doi.org/10.1037/0021-843X.107.2.285
- Amir, N., & Taylor, C. T. (2012). Interpretation training in individuals with generalized social anxiety disorder: A randomized controlled trial. Journal of Consulting and Clinical Psychology, 80(3), 497–511. https://doi.org/10.1037/a0026928
- Arrais, K. C., Machado-de-Sousa, J. P., Trzesniak, C., Santos Filho, A., Ferrari, M. C. F., Osório, F. L., Loureiro, S. R., Nardi, A. E., Hetem, L. A. B., & Zuardi, A. W. (2010). Social anxiety disorder women easily recognize fearfull, sad and happy faces: The influence of gender. Journal of Psychiatric Research, 44(8), 535–540. https://doi.org/10.1016/j.jpsychires.2009.11.003
- Busscher, B., Spinhoven, P., van Gerwen, L. J., & de Geus, E. J. (2013). Anxiety sensitivity moderates the relationship of changes in physiological arousal with flight anxiety during in vivo exposure therapy. Behaviour Research and Therapy, 51(2), 98–105. https://doi.org/10.1016/j.brat.2012.10.009
- Cacioppo, J. T., & Cacioppo, S. (2014). Social relationships and health: The toxic effects of perceived social isolation. Social and Personality Psychology Compass, 8(2), 58–72. https://doi.org/10.1111/spc3.12087
- Chalmers, J. A., Quintana, D. S., Abbott, M. J., & Kemp, A. H. (2014). Anxiety disorders are associated with reduced heart rate variability: A meta-analysis. Frontiers in Psychiatry, 5, 80. https://doi.org/10.3389/fpsyt.2014.00080
- Colzato, L. S., Sellaro, R., & Beste, C. (2017). Darwin revisited: The vagus nerve is a causal element in controlling recognition of other’s emotions. Cortex, 92, 95–102. https://doi.org/10.1016/j.cortex.2017.03.017
- Constans, J. I., Penn, D. L., Ihen, G. H., & Hope, D. A. (1999). Interpretive biases for ambiguous stimuli in social anxiety. Behaviour Research and Therapy, 37(7), 643–651. https://doi.org/10.1016/j.cortex.2017.03.017
- Demenescu, L. R., Kortekaas, R., den Boer, J. A., & Aleman, A. (2010). Impaired attribution of emotion to facial expressions in anxiety and major depression. PloS One, 5(12), e15058. https://doi.org/10.1371/journal.pone.0015058
- Di Simplicio, M., Costoloni, G., Western, D., Hanson, B., Taggart, P., & Harmer, C. (2012). Decreased heart rate variability during emotion regulation in subjects at risk for psychopathology. Psychological Medicine, 42(8), 1775–1783. https://doi.org/10.1017/S0033291711002479
- Elfenbein, H. A., & Ambady, N. (2002). On the universality and cultural specificity of emotion recognition: A meta-analysis. Psychological Bulletin, 128(2), 203–235. https://doi.org/10.1037/0033-2909.128.2.203
- Hayes, A. F. (2012). PROCESS: A versatile computational tool for observed variable mediation, moderation, and conditional process modeling. [White paper]. http://www.afhayes.com/ public/process2012.pdf.
- Heinrichs, N., & Hofmann, S. G. (2001). Information processing in social phobia: A critical review. Clinical Psychology Review, 21(5), 751–770. https://doi.org/10.1016/S0272-7358(00)00067-2
- Hu, M. X., Lamers, F., de Geus, E. J., & Penninx, B. W. (2016). Differential autonomic nervous system reactivity in depression and anxiety during stress depending on type of stressor. Psychosomatic Medicine, 78(5), 562–572. https://doi.org/10.1097/PSY.0000000000000313
- Huck, N. O., Mcbride, S. A., Kendall, A. P., Grugle, N. L., & Killgore, W. D. (2008). The effects of modafinil, caffeine, and dextroamphetamine on judgments of simple versus complex emotional expressions following sleep deprivation. International Journal of Neuroscience, 118(4), 487–502. https://doi.org/10.1080/00207450601125907
- Huppert, J. D., Pasupuleti, R. V., Foa, E. B., & Mathews, A. (2007). Interpretation biases in social anxiety: Response generation, response selection, and self-appraisals. Behaviour Research and Therapy, 45(7), 1505–1515. https://doi.org/10.1016/j.brat.2007.01.006
- Jang, A., Hwang, S.-K., Padhye, N. S., & Meininger, J. C. (2017). Effects of cognitive behavior therapy on heart rate variability in young females with constipation-predominant irritable bowel syndrome: A parallel-group trial. Journal of Neurogastroenterology and Motility, 23(3), 435–445. https://doi.org/10.5056/jnm17017
- Joormann, J., & Gotlib, I. H. (2006). Is this happiness I see? Biases in the identification of emotional facial expressions in depression and social phobia. Journal of Abnormal Psychology, 115(4), 705–714. https://doi.org/10.1037/0021-843X.115.4.705
- Knappe, S., Klotsche, J., Strobel, A., LeBeau, R., Craske, M., Wittchen, H.-U., & Beesdo-Baum, K. (2013). Dimensional anxiety scales for DSM-5: Sensitivity to clinical severity. European Psychiatry, 28(7), 448–456. https://doi.org/10.1016/j.eurpsy.2013.02.001
- Koenig, J., Jarczok, M. N., Kuhn, W., Morsch, K., Schäfer, A., Hillecke, T. K., & Thayer, J. F. (2013). Impact of caffeine on heart rate variability: A systematic review. Journal of Caffeine Research, 3(1), 22–37. https://doi.org/10.1089/jcr.2013.0009
- Koopman, J., Howe, M., Hollenbeck, J. R., & Sin, H.-P. (2015). Small sample mediation testing: Misplaced confidence in bootstrapped confidence intervals. Journal of Applied Psychology, 100(1), 194–202. https://doi.org/10.1037/a0036635
- Laborde, S., Mosley, E., & Thayer, J. F. (2017). Heart rate variability and cardiac vagal tone in psychophysiological research–recommendations for experiment planning, data analysis, and data reporting. Frontiers in Psychology, 8, 213. https://doi.org/10.3389/fpsyg.2017.00213
- Lausen, A., & Schacht, A. (2018). Gender differences in the recognition of vocal emotions. Frontiers in Psychology, 9. https://doi.org/10.3389/fpsyg.2018.00882
- Lebeau, R. T., Glenn, D. E., Hanover, L. N., Beesdo-Baum, K., Wittchen, H., & Craske, M. G. (2012). A dimensional approach to measuring anxiety for DSM-5. International Journal of Methods in Psychiatric Research, 21(4), 258–272. https://doi.org/10.1002/mpr.1369
- Lischke, A., Lemke, D., Neubert, J., Hamm, A. O., & Lotze, M. (2017). Inter-individual differences in heart rate variability are associated with inter-individual differences in mind-reading. Scientific Reports, 7(1), 11557. https://doi.org/10.3389/fpsyg.2018.00229
- Livingstone, S. R., & Russo, F. A. (2018). The Ryerson audio-Visual Database of emotional speech and Song (RAVDESS): A dynamic, multimodal set of facial and vocal expressions in North American English. PloS One, 13(5), e0196391. https://doi.org/10.1371/journal.pone.0196391
- Maoz, K., Eldar, S., Stoddard, J., Pine, D. S., Leibenluft, E., & Bar-Haim, Y. (2016). Angry-happy interpretations of ambiguous faces in social anxiety disorder. Psychiatry Research, 241, 122–127. https://doi.org/10.1016/j.psychres.2016.04.100
- Maričić, A., & Štambuk, M. (2015). The Role of loneliness in the relationship between social anxiety and subjective well-being: Using the social phobia Inventory (SPIN) as a measure. Društvena Istraživanja: Časopis Za Opća Društvena Pitanja, 24(3), 407–426. https://doi.org/10.5559/di.24.3.05.
- McKeown, G., Sneddon, I., & Curran, W. (2015). Gender differences in the perceptions of genuine and simulated laughter and amused facial expressions. Emotion Review, 7(1), 30–38. https://doi.org/10.1177/1754073914544475
- McLean, C. P., Asnaani, A., Litz, B. T., & Hofmann, S. G. (2011). Gender differences in anxiety disorders: Prevalence, course of illness, comorbidity and burden of illness. Journal of Psychiatric Research, 45(8), 1027–1035. https://doi.org/10.1016/j.jpsychires.2011.03.006
- Mogg, K., Philippot, P., & Bradley, B. P. (2004). Selective attention to angry faces in clinical social phobia. Journal of Abnormal Psychology, 113(1), 160. https://doi.org/10.1037/0021-843X.113.1.160
- Mohlman, J., Carmin, C. N., & Price, R. B. (2007). Jumping to interpretations: Social anxiety disorder and the identification of emotional facial expressions. Behaviour Research and Therapy, 45(3), 591–599. https://doi.org/10.1016/j.brat.2006.03.007
- Molfino, A., Fiorentini, A., Tubani, L., Martuscelli, M., Fanelli, F. R., & Laviano, A. (2009). Body mass index is related to autonomic nervous system activity as measured by heart rate variability. European Journal of Clinical Nutrition, 63(10), 1263–1265. https://doi.org/10.1038/ejcn.2009.35
- Möller, E. L., & Bögels, S. M. (2016). The DSM-5 dimensional anxiety Scales in a Dutch non-clinical sample: Psychometric properties including the adult separation anxiety disorder scale. International Journal of Methods in Psychiatric Research, 25(3), 232–239. https://doi.org/10.1002/mpr.1515
- Murphy, R., Hirsch, C. R., Mathews, A., Smith, K., & Clark, D. M. (2007). Facilitating a benign interpretation bias in a high socially anxious population. Behaviour Research and Therapy, 45(7), 1517–1529. https://doi.org/10.1016/j.brat.2007.01.007
- Parak, J., & Korhonen, I. (2013). Accuracy of Firstbeat Bodyguard 2 beat-to-beat heart rate monitor. White Paper by Firstbeat Technologies Ltd. https://assets.firstbeat.com/firstbeat/uploads/2015/11/white_paper_bodyguard2_final1.pdf.
- Park, G., Van Bavel, J. J., Vasey, M. W., Egan, E. J., & Thayer, J. F. (2012). From the heart to the mind’s eye: Cardiac vagal tone is related to visual perception of fearful faces at high spatial frequency. Biological Psychology, 90(2), 171–178. https://doi.org/10.1016/j.biopsycho.2012.02.012
- Paulmann, S., & Uskul, A. K. (2014). Cross-cultural emotional prosody recognition: Evidence from Chinese and British listeners. Cognition & Emotion, 28(2), 230–244. https://doi.org/10.1080/02699931.2013.812033
- Peschard, V., & Philippot, P. (2017). Overestimation of threat from neutral faces and voices in social anxiety. Journal of Behavior Therapy and Experimental Psychiatry, 57, 206–211. https://doi.org/10.1016/j.jbtep.2017.06.003
- Porges, S. W. (2001). The polyvagal theory: Phylogenetic substrates of a social nervous system. International Journal of Psychophysiology, 42(2), 123–146. https://doi.org/10.1016/S0167-8760(01)00162-3
- Proverbio, A. M. (2017). Sex differences in social cognition: The case of face processing. Journal of Neuroscience Research, 95(1–2), 222–234. https://doi.org/10.1002/jnr.23817
- Quadflieg, S., Wendt, B., Mohr, A., Miltner, W. H., & Straube, T. (2007). Recognition and evaluation of emotional prosody in individuals with generalized social phobia: A pilot study. Behaviour Research and Therapy, 45(12), 3096–3103. https://doi.org/10.1016/j.brat.2007.08.003
- Quintana, D. S., Guastella, A. J., Outhred, T., Hickie, I. B., & Kemp, A. H. (2012). Heart rate variability is associated with emotion recognition: Direct evidence for a relationship between the autonomic nervous system and social cognition. International Journal of Psychophysiology, 86(2), 168–172. https://doi.org/10.1016/j.ijpsycho.2012.08.012
- Russell, J. A. (1993). Forced-choice response format in the study of facial expression. Motivation and Emotion, 17(1), 41–51. https://doi.org/10.1007/BF00995206
- Schofield, C. A., Coles, M. E., & Gibb, B. E. (2007). Social anxiety and interpretation biases for facial displays of emotion: Emotion detection and ratings of social cost. Behaviour Research and Therapy, 45(12), 2950–2963. https://doi.org/10.1016/j.brat.2007.08.006
- Shaffer, F., & Ginsberg, J. (2017). An overview of heart rate variability metrics and norms. Frontiers in Public Health, 5, 258. https://doi.org/10.3389/fpubh.2017.00258
- Shearer, A., Hunt, M., Chowdhury, M., & Nicol, L. (2016). Effects of a brief mindfulness meditation intervention on student stress and heart rate variability. International Journal of Stress Management, 23(2), 232–254. https://doi.org/10.1037/a0039814
- Silvia, P. J., Allan, W. D., Beauchamp, D. L., Maschauer, E. L., & Workman, J. O. (2006). Biased recognition of happy facial expressions in social anxiety. Journal of Social and Clinical Psychology, 25(6), 585–602. https://doi.org/10.1521/jscp.2006.25.6.585
- Stewart, D. W., & Mandrusiak, M. (2007). Social phobia in college students: A developmental perspective. Journal of College Student Psychotherapy, 22(2), 65–76. https://doi.org/10.1300/J035v22n02_06
- Tarvainen, M. P., Niskanen, J.-P., Lipponen, J. A., Ranta-Aho, P. O., & Karjalainen, P. A. (2014). Kubios HRV: Heart rate variability analysis software. Computer Methods and Programs in Biomedicine, 113(1), 210–220. https://doi.org/10.1016/j.cmpb.2013.07.024
- Taylor, S. E., & Brown, J. D. (1988). Illusion and well-being: A social psychological perspective on mental health. Psychological Bulletin, 103(2), 193–210. https://doi.org/10.1037/0033-2909.103.2.193
- Taylor, S. E., Klein, L. C., Lewis, B. P., Gruenewald, T. L., Gurung, R. A., & Updegraff, J. A. (2000). Biobehavioral responses to stress in females: Tend-and-befriend, not fight-or-flight. Psychological Review, 107(3), 411–429. https://doi.org/10.1037/0033-295X.107.3.411
- Thayer, J. F., & Lane, R. D. (2009). Claude Bernard and the heart–brain connection: Further elaboration of a model of neurovisceral integration. Neuroscience & Biobehavioral Reviews, 33(2), 81–88. https://doi.org/10.1016/j.neubiorev.2008.08.004
- Thayer, J. F., & Sternberg, E. (2006). Beyond heart rate variability: Vagal regulation of allostatic systems. Annals of the New York Academy of Sciences, 1088(1), 361–372. https://doi.org/10.1196/annals.1366.014
- Tseng, H.-H., Huang, Y.-L., Chen, J.-T., Liang, K.-Y., Lin, C.-C., & Chen, S.-H. (2017). Facial and prosodic emotion recognition in social anxiety disorder. Cognitive Neuropsychiatry, 22(4), 331–345. https://doi.org/10.1080/13546805.2017.1330190
- Umetani, K., Singer, D. H., McCraty, R., & Atkinson, M. (1998). Twenty-four hour time domain heart rate variability and heart rate: Relations to age and gender over nine decades. Journal of the American College of Cardiology, 31(3), 593–601. https://doi.org/10.1016/S0735-1097(97)00554-8
- Weise, F., Krell, D., & Brinkhoff, N. (1986). Acute alcohol ingestion reduces heart rate variability. Drug and Alcohol Dependence, 17(1), 89–91. https://doi.org/10.1016/0376-8716(86)90040-2
- Winquist, L. A., Mohr, C. D., & Kenny, D. A. (1998). The female positivity effect in the perception of others. Journal of Research in Personality, 32(3), 370–388. https://doi.org/10.1006/jrpe.1998.2221
- Xing, Y., Rao, N., Miao, M., Li, Q., Li, Q., Chen, X., Zhang, Q., & Wu, J. (2019). Task-State heart rate variability Parameter-based depression Detection model and effect of therapy on the Parameters. IEEE Access, 7, 105701–105709. https://doi.org/10.1109/ACCESS.2019.2932393
- Yoon, K. L., & Zinbarg, R. E. (2007). Threat is in the eye of the beholder: Social anxiety and the interpretation of ambiguous facial expressions. Behaviour Research and Therapy, 45(4), 839–847. https://doi.org/10.1016/j.brat.2006.05.004
- Young, K. S., Parsons, C. E., LeBeau, R. T., Tabak, B. A., Sewart, A. R., Stein, A., Kringelbach, M. L., & Craske, M. G. (2017). Sensing emotion in voices: Negativity bias and gender differences in a validation study of the Oxford vocal (‘OxVoc’) sounds database. Psychological Assessment, 29(8), 967–977. https://doi.org/10.1037/pas0000382