
 ?Mathematical formulae have been encoded as MathML and are displayed in this HTML version using MathJax in order to improve their display. Uncheck the box to turn MathJax off. This feature requires Javascript. Click on a formula to zoom.
Abstract
Determining the relevant spatial covariates is one of the most important problems in the analysis of point patterns. Parametric methods may lead to incorrect conclusions, especially when the model of interactions between points is wrong. Therefore, we propose a fully nonparametric approach to testing significance of a covariate, taking into account the possible effects of nuisance covariates. Our tests match the nominal significance level, and their powers are comparable with the powers of parametric tests in cases where both the model for intensity function and the model for interactions are correct. When the parametric model for the intensity function is wrong, our tests achieve higher powers. The proposed methods rely on Monte Carlo testing and take advantage of the newly introduced concepts: the covariate-weighted residual measure and nonparametric residuals. We also define a correlation coefficient between a point process and a covariate and a partial correlation coefficient quantifying the dependence between a point process and a covariate of interest while removing the influence of nuisance covariates. Supplementary materials for this article are available online.
1 Introduction
1.1 Motivation and Overview
Spatial point patterns are often accompanied by spatial covariates. Determining the relevant covariates that influence the positions of points is certainly one of the most important questions of point pattern analysis. Applications include spatial epidemiology, spatial ecology, exploration geology, seismology, and many other fields.
In this article, we mainly focus on this question. Our proposed methods use nonparametric tools. The second question that we are interested in is nonparametric quantification of the spatial dependence between a point process and a covariate, both without and with the presence of nuisance covariates. Nuisance covariates are those which potentially affect the distribution of the point process but which are not of particular interest in the analysis. We define a correlation coefficient and a partial correlation coefficient (removing the influence of the nuisance covariates) between a point process and a covariate. The second problem has not been studied before, to our knowledge.
The first problem is usually solved by parametric methods (Kutoyants Citation1998; Schoenberg Citation2005; Waagepetersen and Guan Citation2009; Coeurjolly and Lavancier Citation2013), see Section 2.1 for details. However, we show in our simulation study that even when the parametric model is selected correctly, these tests of covariate significance may lead to liberality. The parametric methods have even bigger problems when: (a) the parametric model for the intensity function is incorrect, or (b) the form of interactions between points is specified incorrectly. We propose here two tests of covariate significance, a fully nonparametric one which avoids both selecting the intensity function model and the interaction model, and a semiparametric one which does not assume an interaction model but uses the log-linear intensity function model as the one predominantly used in practice. These two proposed tests do not exhibit liberality, and their powers are comparable with the powers of parametric methods in cases with correctly specified models for the intensity function and the interactions. The proposed tests also have a higher power than the parametric ones when either the intensity function model or the interaction model is misspecified.
Since the proposed nonparametric tests do not need to choose a specific model and exhibit better properties than their parametric counterparts, their use should become a standard practice in the analysis of point patterns.
For determining relevant covariates one can also use the lurking variable plots (Baddeley and Turner Citation2005) or appropriate information criteria (Choiruddin, Coeurjolly, and Waagepetersen Citation2021) but these do not provide formal tests. The only nonparametric method studying the dependence of a point process and a covariate without nuisance covariates was introduced in Dvořák et al. (Citation2022).
We assume here that the spatial covariates are continuous. The methodology is up to a certain extent also applicable for categorical covariates, as discussed in Section 6.
1.2 Motivational Example
To illustrate the relevance of the questions posed above, we consider a part of the tropical tree dataset from the Barro Colorado Island plot (Condit Citation1998). We focus on the positions of 3604 trees of the Beilschmiedia pendula species in a rectangular 1000 × 500 meter sampling plot (see the top left panel of ). This part of the dataset is available in the R package spatstat (Baddeley, Rubak, and Turner Citation2015). Below, we call it the BCI dataset.
Fig. 1 The Barro Colorado Island dataset. From left to right, top to bottom: locations of trees, terrain elevation, terrain gradient, the soil contents of nitrogen, phosphorus, and potassium.
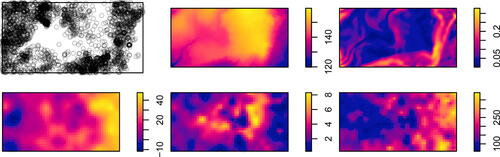
The intensity of point occurrence in the observation window is clearly nonconstant as the trees tend to prefer specific environmental conditions. The variation in the intensity of point occurrence may possibly be explained by the accompanying covariate information. The available covariates include the terrain elevation and gradient (available in the spatstat package) and the soil contents of mineralized nitrogen, phosphorus and potassium (Dalling et al. Citation2022), see . Maybe all the covariates bring important information and should be used for inference. However, it is equally possible that some of the covariates bring redundant information (as could be expected from the nitrogen and potassium content in this dataset, see the bottom left and bottom right panel of ) or that some of the covariates, in fact, do not influence the point process. It is important to determine with high degree of confidence which covariates influence the point process and should be included in the further steps of the inference.
In certain cases, a relevant parametric model can be specified based on the available expert knowledge. However, often no such parametric model is available, or we do not want to take the risk of model misspecification. Then nonparametric methods for covariate selection need to be used. For example, the nonparametric tools proposed in this article can be used to create a backward covariate selection scheme, as described in Section 5.
1.3 Outline of the Work
In order to achieve our objectives, we propose to employ the residual analysis (Baddeley et al. Citation2005) with respect to the model built from the nuisance covariates. The sample (Kendall’s) correlation coefficient between the smoothed residual field and the covariate of interest then quantifies their dependence, either without or with the effect of nuisance covariates. The latter defines the partial correlation coefficient.
The testing of covariate significance is proposed to be performed via a new test statistic, the covariate-weighted residual measure, and a Monte Carlo test. The residual analysis can be performed in a parametric way, which defines our semiparametric approach, or it can be performed nonparametrically using the nonparametric estimate of the point process intensity function (Baddeley et al. Citation2012), which leads to our completely nonparametric approach. The nonparametric residuals are used for the first time in this work.
The replications in the Monte Carlo test are obtained through random shifts both with torus correction (Lotwick and Silverman Citation1982) and variance correction (Mrkvička et al. Citation2021). The torus correction is a standard method whereas the variance correction was recently defined, and it allows to use nonrectangular windows and better controls the significance level of the test than the torus correction.
The article is organized as follows. Section 2 recalls the concepts we need to define our procedures. Section 3 describes all new methods we are introducing in this work. That is, nonparametric residuals, spatial (partial) correlation coefficient, covariate-weighted residual measure, and tests of covariate significance with nuisance covariates. Section 4 contains a simulation study in which the exactness and power of our nonparametric methods is compared with parametric methods. Section 5 contains an example of the usage of our methods for nonparametric selection of relevant covariates. Finally, Section 6 is left for conclusions and discussion. The supplementary material contains further simulation results, discussion on the choice of the variance correction factors in the random shift tests, and a data example illustrating the use of the (partial) correlation coefficients between a point process and a covariate. The R codes providing an implementation of the proposed methods are available in the package NTSS for R.
2 Notation and Background
Let X be a point process on with the intensity function
. Throughout this article, we assume that the intensity function of X exists. Let
be the covariates in
. These will later represent the nuisance covariates whose influence on the point process is to be removed. The covariate of interest will be denoted
in the following. Denote by
a compact observation window with area
and
the number of points of the process X observed in the set B. We assume that the values of the covariates are available in all points of W, at least on a fine pixel grid. This can be achieved from a finite set of observations for example by kriging techniques.
2.1 Covariate Selection in Parametric Point Process Models
The dependence of the intensity function of a point process on the covariates is often modeled parametrically, for example using the log-linear model
(1)
(1)
The standard approach to estimating the model parameters βi is to maximize the Poisson likelihood (Schoenberg Citation2005; Waagepetersen and Guan Citation2009). This corresponds to the maximum likelihood approach for Poisson models, while for non-Poisson models, this constitutes a first-order composite likelihood approach. For the log-linear model (1) the estimation is implemented in the ppm function from the popular spatstat package.
For Poisson or Gibbs processes, the ppm function also provides confidence intervals for the regression parameters βi and the p-values of the tests of the null hypothesis that for a given i, based on the asymptotic variance matrix (Kutoyants Citation1998; Coeurjolly and Rubak Citation2013). For cluster processes, the kppm function from the spatstat package provides means of model fitting. The regression parameters βi from (1) are again estimated using the ppm function, but the asymptotic variance matrix is determined according to Waagepetersen (Citation2008), taking into account the attractive interactions between points.
The methods discussed above provide means for formal testing of the hypothesis that for a given
, allowing one to select the set of relevant covariates to be included in the model.
2.2 Parametric Residuals for Point Processes
Residuals can be used to check whether the fitted model for the intensity function is appropriate, see Baddeley et al. (Citation2005) or Baddeley, Rubak, and Turner (Citation2015, sec. 11.3). In the following we employ the version of residuals based on the intensity function, as suggested by R. Waagepetersen in the discussion to the paper Baddeley et al. (Citation2005), rather than based on the conditional intensity function as discussed in the paper itself. Let be the vector of the estimated regression parameters. The residual measure is defined as
(2)
(2) where
is a Borel set. The smoothed residual field is obtained as
(3)
(3)
where
is the edge-correction factor and k is a probability density function in
. In fact, the first term in (3) gives the nonparametric kernel estimate of the intensity function, the covariates not being taken into account, while the second term gives the smoothed parametric estimate which incorporates the covariates. If the estimated model
describes the point process X well, the smoothed residual field s(u) is expected to fluctuate around 0 (the heuristics behind this is described in more detail in Section 3.4). Its deviations from 0 indicate a disagreement between
and the true intensity function in the corresponding parts of the observation window. We remark that the residuals described above are the raw residuals of Baddeley et al. (Citation2005), where scaled versions of the residuals are also considered.
2.3 Nonparametric Estimation of the Intensity Function Depending on Covariates
As opposed to fitting a parametric model such as (1), the dependence of the intensity function on a set of covariates can be captured nonparametrically. Baddeley et al. (Citation2012) assume that there is an unknown function such that
Assuming absolute continuity of the distribution of the vector of covariates
on
, the function ρ can be estimated using kernel smoothing in the space of covariate values, see Baddeley et al. (Citation2012) or Baddeley, Rubak, and Turner (Citation2015, sec. 6.6.3). This opens up the possibility to define the nonparametric residuals in Section 3.1.
The estimation of ρ is implemented in the rhohat function from the spatstat package for m = 1 and in the rho2hat function for m = 2. We note that in these two cases, visualization of is straightforward while it is not as easy for m > 2. In our simulation experiments in Section 4 we use the spatstat implementation, while in the analysis of the real dataset with higher number of covariates we use our implementation based on the ks package (Duong Citation2007).
2.4 Monte Carlo Tests
When the distribution of a test statistic is too complicated to be derived analytically but there is a way of obtaining replications (simulations, permutations, …) of the data under the null hypothesis, it is possible to perform a formal test of the null hypothesis using the Monte Carlo approach (Davison and Hinkley Citation1997). This approach relies on the exchangeability of the vector , where T0 is the test statistic value computed from the observed data, and
are obtained from the replications.
The test is performed by determining how typical or extreme the value T0 is in the whole sample . For univariate test statistics, this means determining the rank of T0, however, using functional test statistics is also possible if a suitable ranking of the functions from the most typical to the most extreme is available, as for example in Myllymäki et al. (Citation2017). Exchangeability (invariance of the distribution with respect to permutations of the components) ensures that the Monte Carlo test matches the required significance level.
2.5 Random Shift Permutation Strategy
Random shifts provide means of nonparametric testing of independence between a pair of spatial objects, such as a pair of random fields (Upton and Fingleton Citation1985; Dale and Fortin Citation2002) or a pair of point processes (Lotwick and Silverman Citation1982). By randomly shifting one of the objects while keeping the other one fixed, any possible cross-correlation between them is broken while keeping the distribution of the marginals intact. Usually, at least one of the spatial objects is assumed to be stationary (see Cronie and van Lieshout (Citation2016) for a specific example of a random shift test where both spatial objects may be nonstationary). By performing a certain amount of shifts along randomly generated vectors, one obtains replications for performing a Monte Carlo test of independence.
Assume that the spatial objects are denoted by and
and we observe them in the window W. We denote the value of the test statistic computed directly from the observed data by
. After producing N random shift vectors
we compute the value of the test statistic Ti from
and
shifted by vi, that is
. Clearly, some part of
will be shifted outside of the observation window W and part of
will not overlap with
anymore. Hence, some form of correction is needed.
2.5.1 Torus Correction
For a rectangular window W, one may identify its opposing edges, creating a toroidal geometry on W (Lotwick and Silverman Citation1982; Upton and Fingleton Citation1985). We denote by the version of
shifted with respect to the toroidal geometry, as opposed to
which denotes
shifted with respect to the Euclidean geometry. The replications Ti are then obtained as
.
As a result, all parts of the data are used for computing Ti. On the other hand, artificial cracks appear in the autocorrelation structure of the shifted marginal, as parts of the data originally far away are now “glued together”. This means that exchangeability is violated, which in turn introduces liberality of the random shift tests (Fortin and Payette Citation2002; Mrkvička et al. Citation2021). However, simulation studies show that when the spatial autocorrelations in the data are not very strong, the tests match the nominal significance level quite closely (Mrkvička et al. Citation2021; Dvořák et al. Citation2022). Traditionally, the distribution of the random shift vectors is taken to be the uniform distribution on W, but other choices are also possible.
2.5.2 Variance Correction
To remove the liberality of the torus correction, Mrkvička et al. (Citation2021) proposed the variance correction. It uses shifts respecting the Euclidean geometry and discards those parts of the data that are shifted outside of W. No artificial cracks are introduced to the correlation structure of the data, removing the liberality of the random shift tests. Also, irregular observation windows can be considered. On the other hand, different amounts of data are dropped for different shift vectors vi and for typical choices of the test statistic the variance of Ti varies greatly, making it impossible to perform the Monte Carlo test directly. Therefore, the variance of Ti needs to be standardized before performing the test.
Formally, we denote by Wi the smaller observation window where and
overlap, that is
. The value Ti is computed from
and
restricted to Wi, specifically as
. The values
are then standardized to have zero mean and unit variance. This is achieved by subtracting the mean
and dividing by the square root of the variance:
The standardized values
are closer to exchangeability than
because their first two moments are the same. The standardized values are used to perform the Monte Carlo test. When a formula describing
as a function of the size of Wi is known, at least asymptotically, it can be directly used in the standardization. If such a formula is not available, Mrkvička et al. (Citation2021) suggest a kernel regression approach to estimating
.
Simulation studies in Mrkvička et al. (Citation2021) and Dvořák et al. (Citation2022) show that the random shift tests with variance correction match the nominal significance level even in the case of strong autocorrelation. In those papers, the shift vectors followed the uniform distribution on a disk with radius R centered at the origin. The choice of R is a compromise between two goals: longer shifts are more relevant for breaking the possible dependence between and
while shorter shifts mean that a larger amount of available data is used to compute Ti. Choosing R so that
for all i turned out to provide satisfactory results.
2.6 Nonparametric Testing of Dependence between Point Process and a Covariate
For nonparametric testing of the null hypothesis of independence between a point process X and a covariate C1 the paper Dvořák et al. (Citation2022) suggests to use the random shift test with the test statistic , that is the mean covariate value observed at the points of the process. This test showed liberality (with torus correction) or slight conservativeness (with variance correction) in the simulation studies in Dvořák et al. (Citation2022), with both versions having much higher power than the other tests considered there.
3 New Methods
3.1 Nonparametric Residuals for Point Processes
As discussed in Section 2.3, a nonparametric estimate of the intensity function can be used to describe its dependence on the set of covariates. Using
, the nonparametric version of the residual measure (2) can be defined as
(4)
(4)
The corresponding nonparametric smoothed residual field is then
(5)
(5)
Again, scaled versions of these residuals can be constructed as in Baddeley et al. (Citation2005). If describes the intensity function of X well, meaning for example that no relevant covariate was left out,
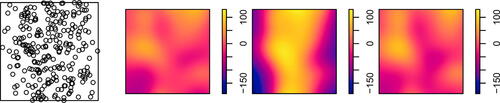
is expected to fluctuate around 0 (the heuristics behind this is described in more detail in Section 3.4). illustrates that
is capable of capturing the correct form of dependence even without specifying a parametric model. It shows a realization of the Poisson process on
with intensity function
, the nonparametric smoothed residual field
from (5) depending on the covariate x, the parametric smoothed residual field s from (3) with log-linear model depending on x, and the parametric smoothed residual field s from (3) with log-linear model depending on x and x2.
Fig. 2 Left to right: realization of a Poisson process with a quadratic intensity function, the nonparametric smoothed residual field, the parametric smoothed residual field with a log-linear model of the intensity function, the parametric smoothed residual field with a log-quadratic model of the intensity function.
3.2 Correlation Coefficient between a Point Process and a Covariate
Assume now that no nuisance covariates are given (m = 0) and we want to investigate the strength of dependence between the intensity function of X and a given covariate C1. Without incorporating a possible effect of C1, the natural estimate of the intensity function is constant, , and the smoothed residual field becomes
(6)
(6)
If the covariate C1 does not influence X, we expect C1 and to be independent. On the other hand, if C1 influences the intensity function of X,
should capture the dependence structure and exhibit correlations with C1. This motivates us to quantify the strength of dependence between X and C1 by some measure of dependence between the two random fields C1 and
.
To this end, we consider Kendall’s correlation coefficient (Nelsen Citation2006, p.158) and let U1, U2 be independent random vectors with uniform distribution in W. Denoting and
, we define
(7)
(7)
The empirical estimate of τ can be easily obtained if we consider a set of sampling points , independently and uniformly distributed in W, independent of X and C1:
(8)
(8) where
is the sign function. Naturally, the values of the correlation coefficient are restricted to the interval
and allow direct comparison of the strength of dependence between different datasets.
To illustrate the use of this correlation coefficient in quantifying the strength of dependence between a point process and a covariate, we perform the following experiment. We consider the Poisson process with the intensity function proportional to in the observation window
, for a given value of
, and with the expected number of points in W fixed at 200. The fixed expected number of points is achieved by adjusting the constant of proportionality in the intensity function. The covariate of interest is
. The smoothed residual field
from (6) is obtained with a large bandwidth bw = 0.5 which reflects the fact that the true intensity function of the point process is very smooth. The value of
is then computed according to (8). This is repeated for 500 independent realizations of the point process for each value of a from a fine grid, and the means of
are plotted as a function of a in the left panel of . The plot shows that
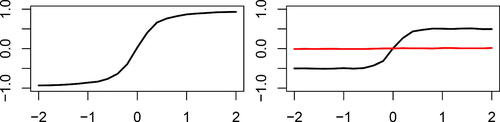
increases in the absolute value with increasing strength of dependence, from 0 in case of independence (a = 0) to almost 1 or –1 in case of very strong dependence. It also correctly captures the form of dependence (positive or negative association).
Fig. 3 Left: plot of the correlation coefficient as a function of the parameter a for the example in Section 3.2. Right: plot of the correlation coefficient
(black curve) and the partial correlation coefficient
(red curve) as functions of the parameter a for the example in Section 3.3.
3.2.1 Choice of Sampling Points
We stress that independent sampling points need to be used in this case instead of simply using the observed points of . In the latter case, the preferential sampling issues could arise, resulting in biased estimates of the properties of the two random fields (Diggle, Menezes, and Su Citation2010; Dvořák et al. Citation2022). Loosely speaking, if, for example, the sampling points
are more likely to be chosen in locations with high values of C1, the sample mean and sample variance of
do not reflect well the true properties of C1. This negatively affects all subsequent steps of the analysis.
Choosing the sampling points independently and uniformly distributed in the observation window is the simplest option. Under such assumption, the variance correction factors for the random shift test can be determined, see the discussion in Appendix C in the supplementary material. On the other hand, if only quantification of the dependence is desired and testing is not intended, using a regular grid of sampling points placed randomly in the observation window may result in a slightly smaller variance of compared to independent sampling points. This was confirmed by simulation experiments not reported here.
3.2.2 Choice of Measure of Dependence
Although different measures of dependence such as Pearson’s or Spearman’s correlation coefficients can be used, we suggest Kendall’s correlation coefficient. It aligns well with the nonparametric spirit of this article and has shown better performance in preliminary experiments not reported here and in previous studies on related topics (Dvořák et al. Citation2022).
3.2.3 Choice of Bandwidth
For the construction of the smoothed residual field in (6) one has to select a specific kernel function k (a probability density function). The type of the kernel does not play an important role, and we use the Gaussian kernel. On the other hand, the choice of bandwidth (standard deviation of the kernel function) affects the properties of the estimates to a great extent. Traditional rules of thumb or more involved methods may be used for bandwidth selection in this case, see Baddeley, Rubak, and Turner (Citation2015, sec. 6.5.1.2) or Cronie and Van Lieshout (Citation2018). However, whenever available, expert knowledge about the specific problem at hand should guide the choice of bandwidth.
3.3 Partial Correlation Coefficient between a Point Process and a Covariate
When several possibly correlated covariates are available, one might be interested in assessing the strength of dependence between the point process X and the covariate of interest after removing the possible influence of the remaining (nuisance) covariates
, in the spirit of the partial correlation coefficient.
The strength of dependence can be quantified by some measure of dependence between the covariate of interest and the smoothed residual field
from (5) where the possible influence of the nuisance covariates
on X has been removed. When a parametric model for the intensity function of X is available, parametric residuals (3) may be used instead.
We suggest using Kendall’s correlation coefficient to quantify the dependence. Again, we consider a set of sampling points , independently and uniformly distributed in W, independent of X and
, and define the sample version of the partial correlation coefficient as
(9)
(9)
The population version can be defined in a similar way as in (7). Concerning the choice of the sampling points and the choice of the measure of dependence, comments from the previous section apply here, too.
To illustrate the use of the partial correlation coefficient in quantifying the strength of dependence between a point process and a covariate of interest, after removing the influence of nuisance covariates, we performed the following experiment. The point process model is the Poisson process from Section 3.2. Its intensity function depends in a log-linear way on the covariate , now treated as a nuisance covariate. Specifically, the intensity function is proportional to
. The covariate of interest is
. We consider 500 independent realizations of the point process for each value of a and compute the means of
and
. The correlation coefficient
, again computed with bw = 0.5, correctly indicates that the point process depends on the covariate C2 through the x-coordinate (black curve in the right panel of ). On the other hand, the partial correlation coefficient
, computed with the adaptive choice of bandwidth described below, attains approx. zero values in this case (red curve in the right panel of ), implying that the influence of the nuisance covariate C1 was successfully removed.
3.3.1 Choice of Bandwidth
Construction of the smoothed residual field requires choosing a bandwidth for the smoothing kernel. Again, standard recommendations may be employed, or the available expert knowledge may be used. However, in our pilot experiments with a single nuisance covariate C1, we observed that the influence of C1 was usually not completely removed from X during the construction of the smoothed residual field , in the sense that the empirical Kendall’s correlation coefficient of
was nonzero. Its value was strongly influenced by the value of bandwidth.
To remove this effect, we suggest selecting the bandwidth value (from a given finite set of candidate values) that minimizes the absolute value of the empirical Kendall’s coefficient of , denoted
in the following. In this way, we select the bandwidth value that removes the influence of C1 on X the most successfully and it can be seen as a conservative version of the correlation coefficient. This is important mostly in cases where the nuisance covariate is correlated with the covariate of interest. For independent covariates, this procedure has very little effect on the performance of the random shift tests. We apply this approach to bandwidth selection in our simulation experiments below. When more than one nuisance covariate is available, this adaptive bandwidth procedure can be generalized by minimizing
.
3.4 Covariate-Weighted Residual Measure
While is useful for quantifying the strength of dependence between X and the covariate of interest
after removing the influence of nuisance covariates
, the random shift test using
as the test statistic turned out to have a rather low power in our simulation studies. The reason lies in the applied smoothing and the deliberate removal of the preferential sampling effects—the association between the points of X and the covariate
brings important information.
To overcome these issues, we define the following characteristic that we call the covariate-weighted residual measure of W:
(10)
(10)
This can be viewed as a generalization of the test statistic T from Section 2.6 which also includes the sum of covariate values, but does not take into account possible nuisance covariates. By sampling the values of at the points of X we take advantage of any possible preferential sampling effects, and no smoothing is performed when computing the value of CWR, hence, we avoid the problem of bandwidth selection.
The expectation of CWR is close to 0 if the covariates capture all variation in
. The heuristic reasoning behind this is the following. Assume that the covariate
is deterministic, then the expectation of the sum in (10) is
according to Campbell’s theorem, where
is the true intensity function of X. The integral
is close to
if
is close to
. Thus, if
is close to
, CWR is expected to be close to 0, and to differ from 0 otherwise. This enables testing the significance of
after removing the influence of
.
3.5 Testing the Covariate Significance Under the Presence of Nuisance Covariates
Now we focus on the null hypothesis that X and are independent, conditionally on
. We employ the random shift test described in Section 2.5, either with torus or variance correction. The test statistic can be
in which case the two spatial objects to be shifted against each other are the two random fields
and
. Alternatively, one can use the covariate-weighted residual measure of W as the test statistic. In this case
is a measure and
is a random field. If vi is a shift vector, the shift of the random field
should be interpreted in both cases as
. The choice of the correction factors for the variance correction is discussed in Appendix C in the supplementary material, including Proposition 1 which studies the variance of CWR for Poisson processes and an empirical study for log-Gaussian Cox processes. The assumption of stationarity of one of the spatial objects is discussed in detail in Section 6.
4 Simulation Study
To assess the performance of the proposed tests, we present below a set of simulation experiments, both under the null hypothesis and under various alternatives. The models range from clustering through complete spatial randomness to regularity, even combining clustering and inhibition on different scales. The null hypothesis states that X and are independent, conditionally on the nuisance covariates. For simplicity, we focus on the situation with a single nuisance covariate. The proposed nonparametric tests are compared with the parametric methods available in standard software represented by the spatstat package.
4.1 Simulation Study Design
The following notation and choices are used in all simulation experiments. are independent, identically distributed Gaussian random fields, centered, unit variance, with exponential covariance function with scale 0.1. The observation window is
. The expected number of points in W is equal to
for Poisson and clustered models and approximately equal to
for models exhibiting regularity.
For each model, we simulate 5000 independent realizations, and for each realization, we perform a set of tests on the 5% nominal significance level. In the tables of results we report the fractions of rejections for the individual tests, rounded to three decimals. To assess the liberality or conservativeness of the tests, one can compare the reported rejection rates (in experiments performed under the null hypothesis) with the interval based on the 2.5% and 97.5% quantiles of the binomial distribution with parameters n = 5000 and p = 0.05, that is, with the interval .
We investigate the performance of the random shift tests with either or CWR as the test statistic, with either parametric or nonparametric version of residuals (denoted by the symbol “p” or “n” in the tables of results) and with either torus or variance correction (denoted by “tor” or “var” in the tables of results). The tests are based on 999 independent random shift vectors with uniform distribution on a disk with radius 0.5. The values of
are computed with the bandwidth selected by the adaptive procedure from Section 3.3.1 and with 100 sampling points chosen uniformly and independently in W. The random shift tests are compared with the parametric tests provided by the functions ppm (for Poisson, Strauss, and hardcore Strauss processes) and kppm (for log-Gaussian Cox processes, denoted LGCP in the following) from the spatstat package, see Section 2.1. The test assuming Poisson interactions is denoted “ppm, Poisson” in the tables of results below. Similarly, “ppm, Strauss(R)” denotes the test assuming the Strauss interactions with interaction distance R, “ppm, HC Strauss(R)” denotes the test assuming the hardcore Strauss model with interaction distance R and the true hardcore distance, and “kppm, LGCP” denotes the test assuming the LGCP model.
To mimic the practical issues with model specification, we consider these parametric tests both with the correct interaction model and with an incorrect interaction model of a similar type. Specifically, in addition to fitting the correct model to the LGCPs we also fit a Matérn cluster process (the test is denoted “kppm, MC” in the tables of results); for the Strauss and hardcore Strauss processes we fit the models with the interaction distance fixed to either the correct or incorrect value, specified in the tables of results in the column “Variant”. For the hardcore Strauss processes the correct hardcore distance is always assumed in the model fitting. We also fit an inhomogeneous Poisson process to all datasets to investigate the effect of ignoring the interaction structure. On the other hand, we do not try fitting clustered models to clearly regular datasets and vice versa.
All the parametric tests assume the log-linear model for the intensity function (1), even though for some point process models we consider below this does not hold. This also illustrates possible issues with model misspecification in practice.
4.2 Significance Level Under Independent Covariates
In the following, we let the nuisance covariate influencing the intensity function of the point process be and the covariate of interest be
, which means that the covariate of interest C2 is independent of the nuisance covariate C1 and the point process X (we study the significance level under dependent covariates in the Appendix A in the supplementary material). For the construction of the LGCP models we also use the random field Z2, which is responsible for interactions in the point process rather than variation in its intensity function. For the Poisson and LGCP models, the covariate C1 influences the intensity function directly. For the Strauss and hardcore Strauss models, it directly influences the trend function
. This influence is transformed to the intensity function in a nontrivial way. We consider the following models:
(P1) Poisson process with intensity function
(P2) Poisson process with intensity function
(L1) LGCP with driving intensity function
(L2) LGCP with driving intensity function
(S1) Strauss process with interaction parameter
, interaction range R = 0.05 and trend
(S2) Strauss process with
(H1) Strauss process with hardcore distance hc = 0.01, interaction parameter γ = 4, interaction distance R = 0.02 and trend
(H2) Strauss process with hardcore distance hc = 0.01, γ = 4, R = 0.02 and
Note that in the notation for the models the letter represents the type of interaction in the point process while the subscript specifies whether the covariate C1 influences the intensity function in a log-linear way (denoted by 1) or in a quadratic way (denoted by 2).
Since the covariate of interest C2 is independent of X, the tests should reject in 5% of cases. shows the fractions of rejection. We make the following observations:
Table 1 Estimated sizes of the tests for experiments with independent covariates.
The nonparametric tests match the nominal significance level correctly for all models, the tests based on CWR match it slightly more precisely than those based on
Parametric tests assuming correct interaction structure and correct model for the intensity function (denoted by 1) match the nominal significance level correctly for the Poisson model P1 (the estimated size of the test 0.048) while being liberal for the LGCP model L1 (0.080) or the hardcore Strauss model H1 (0.095). The parametric test is conservative for the Strauss model S1 (0.038).
Parametric tests assuming correct interaction structure and incorrect model for the intensity function (denoted by 2) may exhibit very strong liberality (P2 – 0.166, H2 – 0.079) or conservativeness (L2 – 0.027).
Parametric tests assuming incorrect interaction structure, even with the correct model for the intensity function, may exhibit very strong liberality, for example assuming Poisson interactions for an LGCP (L1 – 0.268) or for a hardcore Strauss process (H1 – 0.198). Also, they may exhibit conservatives, for example assuming attractive interactions for a Poisson process (P1 – 0.020, 0.041).
These observations illustrate that parametric tests are prone to perform poorly under model misspecification either in terms of the interaction structure or the intensity function. However, even when both of these model components are specified correctly, there is a risk of strong liberality of the parametric tests with the sample sizes considered here. From this point of view, the nonparametric tests are preferable as they match the nominal significance level correctly for all models in this study.
4.3 Power under Dependent Covariates
In this section, we study the power of the tests in situations where the covariate of interest C2 influences the intensity function of X even after removing the effect of the nuisance covariate C1. We consider models similar to those in the previous sections and let and
. We focus on the case with dependent covariates, which is more challenging for our proposed tests as they show conservativeness in this case, see Appendix A in the supplementary material. The models depend on a parameter a > 0 that controls the strength of dependence between X and the covariate of interest C2. The value of a is chosen so that all the tests exhibit nontrivial powers, that is not close to 0.05 and not close to 1.00. The models are given as follows:
(
(
(
(
(
(
(
(
shows the fractions of rejections for the individual tests for the eight models specified above. We make the following observations:
Table 2 Estimated powers of the tests for experiments with correlated covariates.
For both
The tests based on
The tests based on CWR exhibit very high power comparable to the parametric tests with correct interaction model and correct model for the intensity function (for P, L, and H models) or even higher power (S).
When the parametric tests are used with the correct interaction model and incorrect model for the intensity function, the nonparametric tests based on CWR have much higher power (L, S), slightly higher power (H), or direct comparison is not possible due to severe liberality of the parametric test (P).
The torus correction and the variance correction perform nearly equivalently for tests based on CWR, while for tests based on
These observations indicate that the random shift tests based on CWR with nonparametric residuals and either torus or variance correction can be preferred in practice to parametric tests since the possible issues with model misspecification are avoided without compromising the power of the test.
5 Nonparametric Covariate Selection for the BCI Dataset
To illustrate the possibility to use the proposed random shift tests for covariate selection, we consider now the BCI dataset described in Section 1.2. Five covariates are available that possibly influence the intensity function of the point process. A possible way to select the set of covariates that have a significant effect on the intensity function is the backward selection procedure described in the following. The numerical results are given in .
Table 3 Backward selection of covariates for the BCI dataset.
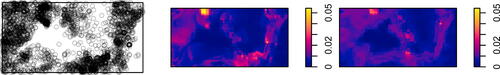
We start in stage 1 with all five covariates, and for each of those we perform the random shift test where the given covariate is the covariate of interest and the remaining four covariates are considered to be the nuisance covariates. We use the test based on CWR with nonparametric residuals and torus correction, with 999 random shifts where the shift vectors have uniform distribution on a disk with radius 250 meters. The covariate with the highest p-value (potassium in this case, printed in italics in ) is removed, and the procedure is repeated in stage 2 with the four covariates. In this stage, the nitrogen covariate is removed, then the gradient covariate, and finally in stage 4 where only two covariates are considered (elevation, phosphorus), both covariates are found significant on the 5% significance level, see . We conclude that these two covariates significantly affect the intensity function of the point process and should be included in the further steps of the inference. Other covariates can be disregarded without losing important information. shows the locations of the trees together with the nonparametric estimate of the intensity function depending on all five available covariates (see Section 2.3 for details about the estimator) and the nonparametric estimate depending on the two covariates selected above (elevation, phosphorus). We observe that the two-covariate model describes the data quite similarly to the full, five-covariate model, and we are not losing important information by disregarding the three covariates identified as redundant by the selection procedure above.
Fig. 4 The Barro Colorado Island dataset. Left to right: locations of trees, nonparametric estimate of the intensity function in the full model, nonparametric estimate in the final model with two covariates.
Concerning computational times, performing the five tests in stage 1 took approx. 66 sec on a regular laptop. For the consequent stages, the total computational time for performing all the required tests in the given stage was 13.7, 9.50, and 6.6 sec, respectively. Up to three nuisance covariates, computing the test statistic values for the randomly shifted data takes the most time. With higher number of nuisance covariates, computing the nonparametric estimate of the intensity function depending on the nuisance covariates (see Section 2.3) becomes the bottleneck. For example, computing the intensity function estimate in the full model with five covariates in took approx. 73 sec.
For comparison, we have also fitted the log-linear model (1) with the five covariates considered here, using the kppm function from the spatstat package as described in Section 2.1. We assume the Thomas type of interactions as suggested in Baddeley, Rubak, and Turner (Citation2015, sec. 12.4.4). With this approach, three covariates are found significant on the 5% significance level: elevation, gradient and phosphorus, with p-values 0.019, 0.044 and , respectively. Two of these covariates were also found significant by the nonparametric procedure described above (elevation and phosphorus, see ). On the other hand, the gradient covariate was found borderline significant by the parametric approach and not significant by the nonparametric procedure.
6 Conclusions and Discussion
Parametric methods for testing the covariate significance may be severely liberal in cases where the interaction structure is misspecified. This is confirmed by the simulation experiments presented here. The same holds in cases where the assumed model for the intensity function is incorrect. Furthermore, the simulation study indicated that even when both the interaction model and the intensity function model are correctly specified, the parametric methods may be liberal due to the limited data size and asymptotic nature of the parametric methods.
The methods proposed in this article allow quantification and testing of the significance of the correlations between a point process and a covariate of interest, possibly after removing the influence of nuisance covariates. We stress that the proposed methods can be used without specifying any model for the data. The simulation experiments reported in Section 4 show that the random shift tests based on or CWR match the nominal significance level correctly in all situations.
Concerning power, the nonparametric tests based on CWR exhibit comparable or even higher power than parametric tests under the correct model, while showing higher power than parametric tests under incorrect models (where either the interaction or the intensity function is misspecified). This indicates the superiority of the CWR tests over parametric tests in practical applications where the true model is not known. Hence, using the proposed nonparametric CWR tests for covariate selection, for example as discussed in Section 5, provides more reliable results than the available parametric tests are able to provide, and the selected covariates can be used in the further steps of inference with greater confidence.
The only assumption of the proposed random shift tests is that at least one of the objects is stationary under the null hypothesis so that its distribution is not affected by the shifts. Either the covariate of interest can be assumed to be stationary or the covariate-weighted residual measure or the smoothed residual field can be assumed to be close to stationarity if all the relevant covariates are used in the construction of the residuals.
In practice, the true process generating the data is not known. Parametric methods rely on model assumptions which may or may not be appropriate. Even when an appropriate model is determined, the corresponding parametric test may not be available or even may not be developed yet. The nonparametric tools proposed in this article do not suffer from this issue and can be used for any type of process.
A natural question is whether the proposed methods are applicable to categorical covariates. If one of the nuisance covariates is categorical, nonparametric estimation of the intensity function may be performed separately on the individual subregions of W determined by the categorical covariate, allowing all the proposed methods to be used as described above. If the categorical covariate is the covariate of interest, computing or
is not relevant due to the ties in the data. However, the observation window W can be separated into subregions
determined by the values of the covariate of interest. The values
can be used to form a vector test statistic
and the random shift test can be performed for example by means of the global envelope test (Myllymäki et al. Citation2017). This approach corresponds to the determination of differences between point process intensities in subregions
.
Supplementary Materials
Supplementary text: This supplementary material contains several appendices to the above manuscript. (pdf file)
R-code for the example:R-code to compute the BCI data example. The data are available in the R-package spatstat. (r file)
Supplemental Material
Download R Objects File (24.9 KB)Supplemental Material
Download R Objects File (4 KB)Partial_correlation___JCGS___supplement.pdf
Download PDF (294.2 KB)Disclosure Statement
The authors declare there are no competing interests, financial or otherwise.
Additional information
Funding
References
- Baddeley, A., Chang, Y.-M., Song, Y., and Turner, R. (2012), “Nonparametric Estimation of the Dependence of a Spatial Point Process on Spatial Covariates,” Statistics and Its Interface, 5, 221–236. DOI: 10.4310/SII.2012.v5.n2.a7.
- Baddeley, A., Rubak, E., and Turner, R. (2015), Spatial Point Patterns: Methodology and Applications with R. Chapman & Hall Interdisciplinary Statistics Series, Boca Raton, FL: CRC Press.
- Baddeley, A., and Turner, R. (2005), “spatstat: An R Package for Analyzing Spatial Point Patterns,” Journal of Statistical Software, 12, 1–42. DOI: 10.18637/jss.v012.i06.
- Baddeley, A., Turner, R., Møller, J., and Hazelton, M. (2005), “Residual Analysis for Spatial Point Processes,” (with Discussion), Journal of the Royal Statistical Society, Series B, 67, 617–666.
- Choiruddin, A., Coeurjolly, J.-F., and Waagepetersen, R. (2021), “Information Criteria for Inhomogeneous Spatial Point Processes,” Australian & New Zealand Journal of Statistics, 63, 119–143. DOI: 10.1111/anzs.12327.
- Coeurjolly, J.-F., and Lavancier, F. (2013), “Residuals and Goodness-of-Fit Tests for Stationary Marked Gibbs Point Processes,” Journal of the Royal Statistical Society, Series B, 75, 247–276. DOI: 10.1111/j.1467-9868.2012.01043.x.
- Coeurjolly, J.-F., and Rubak, E. (2013), “Fast Covariance Estimation for Innovations Computed from a Spatial Gibbs Point Process,” Scandinavian Journal of Statistics, 40, 669–684. DOI: 10.1111/sjos.12017.
- Condit, R. (1998), Tropical Forest Census Plots, Berlin: Springer-Verlag and R. G. Landes Company.
- Cronie, O., and van Lieshout, M. (2016), “Summary Statistics for Inhomogeneous Marked Point Processes,” Annals of the Institute of Statistical Mathematics, 68, 905–928. DOI: 10.1007/s10463-015-0515-z.
- Cronie, O., and Van Lieshout, M. N. M. (2018), “A Non-Model-based Approach to Bandwidth Selection for Kernel Estimators of Spatial Intensity Functions,” Biometrika, 105, 455–462. DOI: 10.1093/biomet/asy001.
- Dale, M. R. T., and Fortin, M.-J. (2002), “Spatial Autocorrelation and Statistical Tests in Ecology,” Ecoscience, 9, 162–167. DOI: 10.1080/11956860.2002.11682702.
- Dalling, J., John, R., Harms, K., Stallard, R., and Yavitt, J. (2022), “Soil Maps of Barro Colorado Island 50 ha Plot,” accessed: 9 September 2022.
- Davison, A. C., and Hinkley, D. V. (1997), Bootstrap Methods and their Application, Cambridge: Cambridge University Press.
- Diggle, P. J., Menezes, R., and Su, T.-L. (2010), “Geostatistical Inference under Preferential Sampling,” Journal of the Royal Statistical Society (Series C), 59, 191–232. DOI: 10.1111/j.1467-9876.2009.00701.x.
- Duong, T. (2007), “ks: Kernel Density Estimation and Kernel Discriminant Analysis for Multivariate Data in R,” Journal of Statistical Software, 21, 1–16. DOI: 10.18637/jss.v021.i07.
- Dvořák, J., Mrkvička, T., Mateu, J., and González, J. A. (2022), “Nonparametric Testing of the Dependence Structure Among Points–Marks–Covariates in Spatial Point Patterns,” International Statistical Review, 90, 592–621. DOI: 10.1111/insr.12503.
- Fortin, M.-J., and Payette, S. (2002), “How to Test the Significance of the Relation between Spatially Autocorrelated Data at the Landscape Scale: A Case Study Using Fire and Forest Maps,” Ecoscience, 9, 213–218. DOI: 10.1080/11956860.2002.11682707.
- Kutoyants, Y. (1998), Statistical Inference for Spatial Poisson Processes. Number 134 in Lecture Notes in Statistics, New York: Springer.
- Lotwick, H. W., and Silverman, B. W. (1982), “Methods for Analysing Spatial Processes of Several Types of Points,” Journal of the Royal Statistical Society, Series B, 44, 406–413. DOI: 10.1111/j.2517-6161.1982.tb01221.x.
- Mrkvička, T., Dvořák, J., González, J. A., and Mateu, J. (2021), “Revisiting the Random Shift Approach for Testing in Spatial Statistics,” Spatial Statistics, 42, 100430. DOI: 10.1016/j.spasta.2020.100430.
- Myllymäki, M., Mrkvička, T., Grabarnik, P., Seijo, H., and Hahn, U. (2017), “Global Envelope Tests for Spatial Processes,” Journal of the Royal Statistical Society, Series B, 79, 381–404. DOI: 10.1111/rssb.12172.
- Nelsen, R. (2006), An Introduction to Copulas (2nd ed.), New York: Springer.
- Schoenberg, F. P. (2005), “Consistent Parametric Estimation of the Intensity of a Spatial–Temporal Point Process,” Journal of Statistical Planning and Inference, 128, 79–93. DOI: 10.1016/j.jspi.2003.09.027.
- Upton, G. J. G., and Fingleton, B. (1985), Spatial Data Analysis by Examples, Vol. I. Point Pattern and Quantitative Data, New York: Wiley.
- Waagepetersen, R., and Guan, Y. (2009), “Two-Step Estimation for Inhomogeneous Spatial Point Processes,” Journal of the Royal Statistical Society, Series B, 71, 685–702. DOI: 10.1111/j.1467-9868.2008.00702.x.
- Waagepetersen, R. (2008), “Estimating Functions for Inhomogeneous Spatial Point Processes with Incomplete Covariate Data,” Biometrika, 95, 351–363. DOI: 10.1093/biomet/asn020.