
ABSTRACT
Quantitative structure−activity relationship (QSAR) models are powerful in silico tools for predicting the mutagenicity of unstable compounds, impurities and metabolites that are difficult to examine using the Ames test. Ideally, Ames/QSAR models for regulatory use should demonstrate high sensitivity, low false-negative rate and wide coverage of chemical space. To promote superior model development, the Division of Genetics and Mutagenesis, National Institute of Health Sciences, Japan (DGM/NIHS), conducted the Second Ames/QSAR International Challenge Project (2020–2022) as a successor to the First Project (2014–2017), with 21 teams from 11 countries participating. The DGM/NIHS provided a curated training dataset of approximately 12,000 chemicals and a trial dataset of approximately 1,600 chemicals, and each participating team predicted the Ames mutagenicity of each trial chemical using various Ames/QSAR models. The DGM/NIHS then provided the Ames test results for trial chemicals to assist in model improvement. Although overall model performance on the Second Project was not superior to that on the First, models from the eight teams participating in both projects achieved higher sensitivity than models from teams participating in only the Second Project. Thus, these evaluations have facilitated the development of QSAR models.
Introduction
Regulatory bodies are interested in using in silico methods to address animal welfare issues, reduce costs, and obtain information regarding chemicals that are difficult to purify for in vivo and in vitro tests. In silico models, such as quantitative structure−activity relationships (QSARs), can be used to predict the biological activities of chemicals from their structure. A type of QSARs is Ames/QSAR, which is based on the Ames test data and can predict the mutagenicity of a chemical. Ames/QSAR models are currently used to predict the mutagenicity of impurities in pharmaceuticals [Citation1] and other chemicals, such as pesticides and their metabolites [Citation2].
Many of the currently available Ames/QSAR models were developed using publicly available Ames datasets, such as that of Hansen et al. [Citation3], which includes data on more than 5,000 chemicals, the EURL ECVAM Genotoxicity and Carcinogenicity Consolidated Database of Ames-Positive Chemicals [Citation4,Citation5] and Ames-Negative Chemicals [Citation6], European Food Safety Authority Genotoxicity Database [Citation7]; other various other genotoxicity datasets [Citation8–10]. Although these Ames/QSAR models have high accuracy for predicting the mutagenicity of existing chemicals (in the public domain), they have lower accuracy [Citation11], and particularly sensitivity, for detecting new Ames-positive compounds. The use of imbalanced datasets with unequal numbers of Ames-positive and -negative chemicals [Citation12] has contributed to this lack of model performance; balanced accuracy ((sensitivity + specificity)/2) may be a better measure of performance against unbalanced proprietary datasets [Citation13]. However, the primary factor limiting model performance is insufficient coverage of the chemical space and mutagenic mechanisms in the training sets or mutagenicity expert rules. Thus, improved Ames/QSAR models with high sensitivity, low false-negative rate and wide coverage of chemical space are needed in the regulatory setting.
To improve the predictivity of Ames/QSAR models, especially model sensitivity, the Division of Genetics and Mutagenesis, National Institute of Health Sciences, Japan (DGM/NIHS), conducted the First Ames/QSAR International Challenge Project (hereafter ‘the First Project’) from 2014 to 2017 [Citation14]. The project involved 12 teams, mainly QSAR model vendors, from seven countries who were asked to use their Ames/QSAR models to predict the mutagenicity of approximately 12,000 new chemicals, after which the DGM/NIHS compared predicted results with the results of the actual Ames test data to derive various model performance metrics. While the ability of these QSAR models to predict the mutagenicity of new chemicals was improved by this project [Citation14], the extent was limited because the participants were not provided adequate Ames test information by the DGM/NIHS.
From 2020 to 2022, the DGM/NIHS conducted the Second Ames/QSAR International Challenge Project (hereafter ‘the Second Project’), again with the aim of evaluating and improving the performance of Ames/QSAR models. This time several changes were made. More academic and other non-commercial entities took part, and deep-learning models, as well as conventional QSAR models, were examined. The training dataset included the approximately 12,000 chemicals used in the First Project, and a trial dataset comprised of 1,589 new chemicals. The training dataset were curated and was also provided in addition to mutagenicity results for multiple test strains without and with metabolic activation, the solvents used and the test chemical purity. By making these changes, we expect the Second Project to facilitate further improvements in the predictive ability of currently available Ames/QSAR models.
Here we summarize the results from the Second Project and describe the outstanding issues to be solved for the successful use of Ames/QSAR models in the regulatory setting.
Materials and methods
Overview of the First and Second Project
The essential characteristics of the First and Second Projects are summarized in . The First Project was conducted from 2014 to 2017 and involved 12 teams from seven countries. The study comprised three phases, an initial trial phase (Phase I) and two training and trial phases (Phase II and Phase III). A dataset of approximately 12,000 new chemicals was used, of which 4,000 were used in each phase. Most Ames/QSAR models were categorized as statistical or rule-based. The Second Project was conducted from 2020 to 2022, with 19 teams participating in 2020 and two additional teams joining in 2021. The teams were from academia and non-commercial institutions in addition to QSAR vendors. Nine teams that participated in the First Project also participated in the Second Project. All teams participating in the Second Project are listed in . The Second Project involved one phase using both a training dataset comprised of the approximately 12,000 chemicals from the First Project and a trial dataset of 1,589 new chemicals.
Table 1. Overview of the First and Second Ames/QSAR International Challenge Projects.
Table 2. Teams participating in the Second Project.
Training and trial datasets
Data source
Since 1979, the Ministry of Health, Labour and Welfare (MHLW) in Japan has stipulated under the Industrial Safety and Health Act (ANEI-HOU) that producers of new chemical substances and importers of chemicals in amounts greater than 100 kg per year must conduct hazard investigations prior to manufacture or import as part of these investigations, and therefore Ames tests must be conducted and reported [Citation15]. The Ames data used in both the First Project and the Second Project were obtained from the MHLW and comprised Ames class (A, B or C), chemical name and molecular structure. In the First Project, no other information was provided, such as bacterial strain, solvent or cytotoxicity. Class A or ‘strong positive’ indicates that the chemical induces more than 1,000 revertant colonies per milligram of at least one Ames test strain in the presence or absence of metabolic activation. Class B indicates that the tested chemical induces at least a 2-fold increase in revertant colonies but fewer than induced by class A compounds compared to the negative control in at least one Ames strain with or without metabolic activation. Finally, class C or ‘negative’ indicates a < 2-fold increase in revertant colonies (non-mutagenic). In Japan, Ames test data are confidential for chemicals in class B or C, while a list of class A chemicals is publicly available [Citation16] All participants agreed in writing to uphold the confidentiality of the results. Additional details are provided in the report from the First Project [Citation14].
Training dataset originated from the First Project
The training dataset used in the Second Project was created by combining the three subsets used in the three phases of the First Project. This combined dataset contained chemical structure information on approximately 12,000 new chemicals as SDF files with a corresponding list of SMILES notations [Citation17]. The chemical structures in the training dataset included salts (e.g. [Na+]). The list was curated and additional information related to the Ames test was introduced to improve QSAR models (See section ‘Data curation’). If the mutagenicity (class A, B or C) of duplicated chemicals in the training set was the same, only the older Ames data was listed as a part of the training set. If the mutagenicity (class A, B or C) of duplicated chemicals in the training set was different, we did not use the results of such a chemical as part of the training set. Stereoisomers were treated as different chemicals in the training set as, on some occasions, the mutagenicity is not always same in the stereoisomers. Similarly, if the mutagenicity (class A, B or C) of matching pairs of parent compounds and their salt in the training set was the same, only the older Ames test data was listed as a part of the training set. If the mutagenicity (class A, B or C) of such matching pairs in the training set was different, we did not use these chemicals as part of the training set.
Trial dataset generated from new chemicals
By the onset of the Second Project, 5,303 additional compounds were registered as ANEI-HOU new chemicals by the MHLW as a result of Ames class and chemical structure information being available. This list was curated to exclude chemicals unsuitable for evaluating Ames mutagenicity by chemical structure-based QSAR predictions. After structural curation, chemicals with undefined SMILES notations (e.g. oils, extracts, polymers), duplicate chemicals, metal ions and mixtures with undefined components were also removed. Finally, 1,589 ANEI-HOU new chemicals were included as the trial dataset for the Second Project. In addition, minor components (e.g. salts, counterions and solvent molecules) were removed from the 1,589 chemical structures.
shows the proportions of trial dataset chemicals in each Ames class. Like the training dataset, the majority of chemical (about 85%) were class C (non-mutagenic). The training dataset including Ames class was sent to each participating team for the development of their QSAR models. Simultaneously the trial dataset was sent to each participating teams without the Ames class results. The results of all predictions (for trial chemicals) were then reported to the DGM/NIHS. The DGM/NIHS calculated the performance metrics of each QSAR model and disclosed the actual Ames test data of the trial chemicals to the participating teams.
Table 3. Number of chemicals in the Ames classes in the trial set for the Second Project.
Ames/QSAR performance evaluations
As in the First Project [Citation14], the prediction from the QSAR models were compared to the actual Ames test data, generating the prediction performance metrics defined in . Hereafter, the predicted results are classified as ‘true positive’ or TP when the measured Ames result is either class A or B (positive) and the model prediction is positive,‘true negative’ or TN when the measured Ames result is class C (negative) and the model prediction is negative, ‘false positive’ or FP when the measured Ames result is class C (negative) and the model prediction is positive and ‘false-negative’ (FN) when the measured Ames result is either class A or B (positive) and the model prediction is negative. For the evaluation, Ames classes A and B were combined into a single ‘positive’ class to calculate all performance metrics except for sensitivity, which was divided into A-sensitivity, the ability to detect strong Ames-positive (class A) compounds, and sensitivity, the ability to detect Ames-positive (class A or B) compounds.
Table 4. Performance metrics used to evaluate Ames/QSAR model performance.
Results and discussion
Data curation
In the First Project, we only provided the Ames test results (class A, B or C) for the chemicals. In the Second Project, teams were also provided with the molecular weight, purity and solvent used as well as the Ames test results for five bacterial strains with and without metabolic activation () to aid in the development of QSAR models. As in the First Project, cytotoxicity and dose – response data were not provided.
Table 5. Sample of training data provided to the participants of the Second Project*.
listed the curation of the training dataset (see also [Citation18] for an overview). First, the DGM/NIHS confirmed all class A and B chemicals, including those with FN predictions as well as class C chemicals with FP predictions by most teams in the First Project. Of the 10,694 test reports available to the DGM/NIHS for the First Project, 1,565 (about 15%) were included for the Second Project. Of these, 60 changed (these were chemical reassigned to other classes) according to expert reviews by the DGM/NIHS. Thus, the final training dataset for the Second Project comprised 12,134 chemicals, including 649 class A chemicals, 1,100 class B chemicals and 10,385 class C chemicals. It is important to note that this curation did not change the class determination under ANEI-HOU, and the decision to use the curated data for model development was left to each participating team. The DGM/NIHS also provided the teams with the list of class changes and the underlying reasons.
Table 6. Curation of the training dataset used in the Second Project.
Model diversity
The 21 participating teams submitted from one to five sets of predicted results for each of the 1,589 chemicals in the trial dataset (positive, negative, equivocal, out-of-domain or no call, etc). Basically, DGM/NIHS did not make any restriction to the models which the 21 teams developed and used to predict the mutagenicity of the 1,598 chemicals. Only a positive versus negative classification was requested (A/B versus C rather than A versus B versus C) because teams were able to use other training data containing only positive versus negative information as well as training data provided by the DGM/NIHS. In addition to the predicted results, the teams were asked to enter details of their models on a model information sheet with the following fields: Date, QSAR Builder name, QSAR model name, QSAR model version, training data (required), training data description, explicit model algorithm and Notes (optional). The response in the ‘Training data’ field was selected from (1) release model (training data provided in the Second Project were not used for model development), (2) release model + all NIHS data (all training data were used for model development) and (3) release model + selected NIHS data (only some of the NIHS training data were used for model development). Additionally, in Appendix I (Supplementary material), each model is fully described, in addition providing more details of the training data as well as model algorithms. Furthermore, each team was asked to select the model with the best performance metrics. Hereafter, this model is referred to as that selected before access to the Ames test results. Once the teams were informed of the Ames test results, they were again asked to select the most predictive model. Hereafter, this model is referred to as that selected after access to the Ames test results.
The 21 teams submitted predicted Ames results using a total of 50 Ames/QSAR models (the summarized model information sheets are available in Appendix I). One of the 21 teams (Laboratory of Mathematical Chemistry, Bourgas University) submitted positive versus negative and in-domain versus out-of-domain data separately, thus generating two sets of performance metrics (one with in-domain versus out-of-domain data, and one including only in-domain data). Therefore, 51 sets of predicted results were considered in the analyses. The performance metrics of these 51 datasets are presented in Appendix II (Supplementary material).
The models were categorized as expert rule-based or statistical. Some teams provided the predicted results for statistical models and/or rule-based models that are currently used under the ICH M7 guideline. Machine-learning (ML) models, including deep-learning artificial neural networks (ANNs), were categorized as statistical models and considered they are not based in conventional statistical methods but considered a family of statistical learning algorithms that emulates the learning pattern in the human brain with trained neurons by statistical algorithms [Citation19].
ANNs and other ML algorithms (K-Nearest Neighbours, Genetic algorithms-Gas etc.) are cited in Chapter 3 - Unambiguous Algorithms in the guideline ‘OECD principles for the Validation for Regulatory Purposes of (Q)SAR Models’ [Citation20]. Although a neural network is one example of a larger class of ML algorithms [Citation21], ‘deep-learning’ was a keyword frequently used in the model information sheets completed by the participating teams. This subject will not be discussed further here, as the intention is only to provide an overview of the Second Project. In addition, some teams developed more than one model using the same algorithm but different training data or introduced additional techniques for managing unbalanced genotoxicity data (see model information sheets).
The models selected by each team before and after access to the Ames test results () were evaluated in this article because the 51 models (as shown in Appendices I and II) were too diverse for analysis of overall performance. As explained in the footnotes of and Appendix II, three teams (Altox Ltd., Simulations Plus Inc. and NCTR/FDA) did not select a single model before access to the Ames test results. Rather, Altox Ltd. selected models only after access to the results, while Simulations Plus Inc. selected three models (S+MUT_NIHS_ABC, S+MUT_NIHS_AC and S+MUT_NIHS) and used two (S+MUT_NIHS_ABC and S+MUT_NIHS_AC) to generate a single set of performance metrics by averaging. Finally, NCTR/FDA selected two models developed by two independent groups. Thus, only 21 ( = 21 − 1 + 1) models selected before accessing the Ames test results were evaluated. The names of the 21 models and corresponding performance metrics are summarized in . As explained in the footnotes of and Appendix II, NCTR/FDA selected two models after access to the Ames test results, while all other teams selected only one, so 22 models ( = 21 + 1) were evaluated after Ames tests results were made available. The names of the 22 models and corresponding performance metrics are summarized in . The model evaluations included comparisons of those selected before or after access to the Ames test results as well as comparisons with models reported in the First Project (listed in ).
Table 7. Models selected by each team BEFORE access to Ames test results for the trial chemicals.
Table 8. Models selected by each team AFTER access to Ames test results for the trial chemicals.
Table 9. Performance metrics for the models selected BEFORE access to the Ames test results*1.
Table 10. Performance metrics for the models selected AFTER access to the Ames test results*1.
Table 11. Averages (and ranges) of performance metrics for all models in the Second Project versus the First Project*1.
Performance of the selected models
In addition to the performance metrics derived in the First Project, the harmonic mean of recall (sensitivity) and precision (positive prediction value, PPV), or F1-score, was introduced in the Second Project (see ). For a high F1-score, both FN and FP must be low [Citation12]. The ratio of class A and B positives to class C negatives was around 15:85 for both the training dataset (1749:10385) and trial dataset (238:1353), comparable to the First Project (1757:10383) [Citation14]. Due to this imbalance in Ames test results, however, accuracy alone ([TP + TN]/all classifications) cannot be used as a measure of model performance; therefore, additional metrics are needed. Compared to TN and FP, the counts and ratios of TP and FN are always smaller in a dataset containing predominantly negative results. In such cases, changing TP has little effect on accuracy. Balanced accuracy also remains stable when the number of FN results is much higher than the number of TP results [Citation12], although balanced accuracy does not depend on the balance of the dataset. Thus, the introduction of the F1-score allowed us to focus on TP when evaluating the models. The F1-score can also be calculated using sensitivity and PPV, so F1-scores were also calculated for the First Project using the values from in Honma et al. [Citation14] and compared to those obtained for the Second Project.
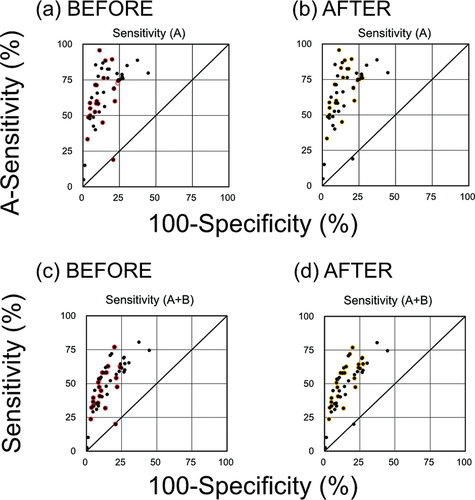
Together with the performance metrics in , receiver operating characteristic (ROC) graphs () indicated that sensitivity and specificity were correlated, except for the values obtained using Model no. 17–1 (), for which sensitivity was high when specificity was low and vice versa. In addition, the A-sensitivity was higher than the general sensitivity for all models except Model no.17–1. Greater A-sensitivity is expected because strong positive mutagenicity (class A) can be predicted with greater sensitivity and lower error than positive mutagenicity (class A + B). However, A-sensitivity and sensitivity were still highly correlated for the selected models. The F1-score was also strongly correlated with Matthew’s correlation coefficient (MCC), which assesses overall model performance. Thus, we concluded that the F1-score could be used as an alternative to MCC for assessing the performance of Ames/QSAR models. In addition, specificity and accuracy were strongly correlated, which is expected given the high proportion of FN results generated from the negative data-dominant trial dataset.
Figure 1. Receiver operating characteristic graphs of Ames mutagenicity prediction for the QSAR models. (a, b) Sensitivity to class A chemicals (A-sensitivity) versus specificity to class C chemicals. (c, d) Sensitivity to class A + B chemicals versus specificity to class C chemicals. Each black dot represents a single QSAR model from one of the participating teams. Red and yellow circles indicate the models selected before and after access to the Ames test data, respectively.
Performance evaluations of the models selected before access to the Ames test results () were used for external validation. The three well-adjusted models were Model no. 7 (F1-score of 49.7%, A-sensitivity of 71.4%, sensitivity of 50.8% and specificity of 91.5%), 14 (51.1%, 95.7%, 58.0% and 88.6%, respectively) and 16–1 (51.6%, 71.3%, 53.4% and 90.7%, respectively). In this article, the well-adjusted models are defined as the F1-scores, A-sensitivities, sensitivities and specificities of these three models were substantially higher than the averages of all 21 models (F-score = 42.2%, A-sensitivity = 62.2%, sensitivity = 46.3%, specificity = 87.5%) but not including MCC at this stage. Further, these three models yielded higher accuracy and balanced accuracy, although not always greater coverage (). Equivocal predictions are not treated here. The coverage of QSAR models should be discussed if we plan further Projects.
The three teams reported using different training sets (Model no. 7, release model + selected NIHS data; Model no. 14, release model only; Model no. 16–1, release model + selected NIHS data) and methodologies for developing the models (Model no. 7 and 16–1, statistical; Model no. 14, rule-based).
Among the 21 models selected before access to the Ames test results, Model no. 3, 4, 8, and 12–1 demonstrated > 70% A-sensitivity (89.3, 88.5, 74.3, and 72.7%, respectively) and > 60% sensitivity (76.9, 62.7, 62.0, and 62.8%, respectively). Model no. 3 and 4 used release model + all NIHS data for training, while Model no. 8 and 12–1 used release model + selected NIHS data for training. Model no. 3 was categorized as a rule-based + deep-learning model, Model no. 4 and 8 as statistical models and Model no. 12–1 as a deep-learning model. It should be noted that the four teams (Team no. 3, 4, 8, 12) as well as Team no. 7 and 14 also participated in the First Project, suggesting that participation in the both projects facilitated the development of models with improved sensitivity.
Examination of the sensitivity of the 22 models selected after access to the results of the Ames test results () is an evaluation positioned somewhere between an internal and an external validation because the model is assigned after access to the Ames test results but developed before access to the Ames test results. Models no. 3, 4, 5–2, 8, 12–2, 15–2, 16–2 and 17–2 yielded > 70% A-sensitivity (89.3, 88.5, 75.0, 74.3, 77.3, 75.0, 82.5, and 75.9%, respectively) and > 60% sensitivity (76.9, 62.7, 61.4, 62.0, 69.3, 64.4, 72.0, and 64.7%, respectively). Three of the eight teams (Team no. 15, 16 and 17) that developed these models did not participate in the First Project. Nonetheless, the DGM/NIHS expects that the experience will help all teams improve model performance, particularly to reduce the FN rate.
From the complete set of models () selected before and after access to the results of the actual Ames test data, those with the highest MCC values and F1-scores were Model no. 2–2, 3, 14, 16–1, and 16–2. All five demonstrated MCC values ≥ 0.4 (0.40, 0.45, 0.42, 0.43, and 0.44%), F1-scores ≥50.0% (50.0 53.8, 51.1, 51.6, and 52.4%) and A-sensitivity ≥70% (ranging from 71.3% and 95.7%). These groups included both rule-based and statistical models, and all were developed using different training datasets. These model performances were unrelated to the rough categories of the training dataset or development methodology. Thus, careful selection of training data and development methodology may partially help to provide improved Ames/QSAR models. In addition, given that the chemical space of the dataset used in the First Project was not the same as that used in the Second Project, expert knowledge of both mutagenicity and the chemical spaces of new chemicals may be necessary for developing improved models.
Range of performances
The ranges of performance metrics (minimum – maximum) and averages for the selected models tested in the Second Project are listed in together with corresponding values from the First Project. The ranges and averages of performance metrics for models from the nine teams who also participated in the First Project are presented separately to assess the potential cumulative benefits of participation. Indeed, average A-sensitivity, sensitivity, balanced accuracy, negative prediction value, MCC and F1-score for the models developed by these nine teams (selected before access to the Ames test results) were higher than the averages of all 21 models before access to the Ames test results. These findings indicate that model performance for predicting positives was enhanced by participating in both the First and Second Projects. Similarly, average specificity, accuracy, positive prediction value and coverage for the 21 models before access to the Ames test results were higher than for the 22 models selected after access to the Ames test results, while average A-sensitivity, sensitivity, balanced accuracy, negative prediction value, MCC and F1-score were higher for the 22 models selected after access to the Ames test results. The ROC graphs () revealed that some low sensitivity models were replaced by models with higher sensitivity after the Ames test results were available. Thus, participating teams tended to select models with superior performance for predicting positives (class A or B versus C) during the Second Project.
The 51 models examined in the Second Project demonstrated relatively high specificity but low sensitivity (see Appendices I and II) compared to the First Project. The average sensitivity values in all three phases of the First Project exceeded 55% (), whereas that for the 21 models selected before accessing the Ames test results in the Second Project was only 46.3% and the average for the 22 models selected after accessing the Ames test results was 52.0%. For these 21 and 22 models, respectively, selected before and after access to the Ames test results in the Second Project, average A-sensitivity was lower than in the First Project. In addition, the ranges (minimum – maximum) of A-sensitivity, sensitivity, and specificity for the 51 Ames/QSAR models in the Second Project were much wider than in the First Project (see Appendix II), which likely reflected the greater diversity of model types and training datasets ().
Nonetheless, the ability to detect positives was higher for the models from teams participating in both First and Second Projects. Also, the average sensitivity (56.2%), MCC (0.35) and F1-score (45.1%) of all models were higher compared to Phases I and III of the First Project, while the average A-sensitivity (74.5%) of the models from teams participating in both was higher than the overall average in the First Project. These comparisons further suggest that participation in both projects improved model performance for predicting positives.
Conclusion
To improve QSAR models for predicting Ames mutagenicity, the Second Ames/QSAR International Challenge Project was conducted from 2020 to 2022. Overall, 21 teams from 11 countries participated in the project, with the DGM/NIHS providing the teams with curated training and trial datasets comprising data on 12,134 and 1,589 chemicals, respectively. After training, the teams were asked to use their models to predict the Ames mutagenicity of the trial chemicals and to report their predicted results to the DGM/NIHS. The DGM/NIHS then provided the teams with the results of the actual Ames test data for the trial chemicals to help the teams improve their models. To analyse the performance metrics of the models, each team was asked to select their best model before and after access to the results of the Ames test data. This aspect is only related to the spontaneous selection of models by the teams after the challenge results, however, all models cited at this work were developed, validated and challenged without previous access to the Ames data. Generally, the models included in the Second Project demonstrated high specificity but low sensitivity. Although the model performances were not as high as those reported from the First Project in this series, we expect that the experience of participating in the study will help the teams in their future model building. Actually, the nine teams who attended both the First and Second Projects showed improved sensitivity. We would like to emphasize again that the purpose of these projects is not to promote competition but to improve the model development skills of the participating teams.
Supplemental Material
Download MS Excel (46.4 KB)Acknowledgments
The authors report there are no competing interests to declare. The authors express their gratitude to the Chemical Hazards Control Division, Industrial Safety and Health Department, MHLW, for allowing us to use ANEI-HOU Ames data in these projects. The authors express their acknowledgement to Dr. Toshio Kasamatsu for Ames data curation. This article reflects the views of the authors and does not necessarily reflect those of the U.S. Food and Drug Administration.
Disclosure statement
No potential conflict of interest was reported by the author(s).
Supplementary material
Supplemental data for this article can be accessed at: https://doi.org/10.1080/1062936X.2023.2284902.
Additional information
Funding
References
- ICH-M7 (R1), ICH Harmonized Guideline, Assessment and control Of DNA reactive (Mutagenic) impurities in pharmaceuticals to limit potential carcinogenic risk Current step 4 version dated 31 March 2017, 2017. Available at https://database.ich.org/sites/default/files/M7_R1_Guideline.pdf.
- R. Benigni, C. Laura Battistelli, C. Bossa, A. Giuliani, E. Fioravanzo, A. Bassan, M. Fuart Gatnik, J. Rathman, C. Yang, and O. Tcheremenskaia, Evaluation of the applicability of existing (Q)SAR models for predicting the genotoxicity of pesticides and similarity analysis related with genotoxicity of pesticides for facilitating of grouping and read across, EFSA Support. Publ. 16 (2019), pp. 1598E. doi:10.2903/sp.efsa.2019.EN-1598.
- K. Hansen, S. Mika, T. Schroeter, A. Sutter, A. Ter Laak, T. Steger-Hartmann, N. Heinrich, and K.-R. Müller, Benchmark data set for in silico prediction of Ames mutagenicity, J. Chem. Inf. Model. 49 (2009), pp. 2077–2081. doi:10.1021/ci900161g.
- D. Kirkland, E. Zeiger, F. Madia, N. Gooderham, P. Kasper, A. Lynch, T. Morita, G. Ouedraogo, J.M. Parra Morte, S. Pfuhler, V. Rogiers, M. Schulz, V. Thybaud, J. van Benthem, P. Vanparys, A. Worth, and R. Corvi, Can in vitro mammalian cell genotoxicity test results be used to complement positive results in the Ames test and help predict caCan in vitro mammalian cell genotoxicity test results be used to complement positive results in the Ames test and help predict carcinogenic or in vivo genotoxic activity? I. Reports of individual databases presented at an EURL ECVAM Workshop, Mutat. Res. Genet. Toxicol. Environ. Mutag. 775-776 (2014), pp. 55–68.
- D. Kirkland, E. Zeiger, F. Madia, and R. Corvi, Can in vitro mammalian cell genotoxicity test results be used to complement positive results in the Ames test and help predict carcinogenic or in vivo genotoxic activity? II. Construction and analysis of a consolidated database, Mutat. Res. Genet. Toxicol. Environ. Mutag. 775-776 (2014), pp. 69–80. doi:10.1016/j.mrgentox.2014.10.006.
- F. Madia, D. Kirkland, T. Morita, P. White, D. Asturiol, and R. Corvi, EURL ECVAM genotoxicity and carcinogenicity database of substances eliciting negative results in the Ames test: Construction of the database, Mutat. Res. Genet. Toxicol. Environ. Mutag. 854-855 (2020), pp. 503199. doi:10.1016/j.mrgentox.2020.503199.
- F. Metruccio, I. Castelli, C. Civitella, C. Galbusera, F. Galimberti, L. Tosti, and A. Moretto, Compilation of a database, specific for the pesticide active substance and their metabolites, comprising the main genotoxicity endpoints, EFSA Support. Publ. 14 (2017), pp. 1229E. doi:10.2903/sp.efsa.2017.EN-1229.
- P. Pradeep, R. Judson, D.M. DeMarini, N. Keshava, T.M. Martin, J. Dean, C.F. Gibbons, A. Simha, S.H. Warren, M.R. Gwinn, and G. Patlewicz, An evaluation of existing QSAR models and structural alerts and development of new ensemble models for genotoxicity using a newly compiled experimental dataset, Comput. Toxicol. 18 (2021), pp. 100167. doi:10.1016/j.comtox.2021.100167.
- P. Pradeep, R. Judson, D.M. DeMarini, N. Keshava, M. Todd, J. Dean, C. Gibbons, A. Simha, S. Warren, M. Gwinn, and G. Patlewicz, Evaluation of existing QSAR models and structural alerts and development of new ensemble models for genotoxicity using a newly compiled experimental dataset, The United States Environmental Protection Agency’s Center for Computational Toxicology and Exposure, 2021. Available at https://gaftp.epa.gov/COMPTOX/CCTE_Publication_Data/CCED_Publication_Data/PatlewiczGrace/CompTox-genetox/.
- R. Benigni, C.L. Battistelli, C. Bossa, O. Tcheremenskaia, and P. Crettaz, New perspectives in toxicological information management, and the role of ISSTOX databases in assessing chemical mutagenicity and carcinogenicity, Mutagenesis 28 (2013), pp. 401–409. doi:10.1093/mutage/get016.
- A. Hillebrecht, W. Muster, A. Brigo, M. Kansy, T. Weiser, and T. Singer, Comparative evaluation of in silico systems for Ames test mutagenicity prediction: Scope and limitations, Chem. Res. Toxicol. 24 (2011), pp. 843–854. doi:10.1021/tx2000398.
- S.-Y. Bae, J. Lee, J. Jeong, C. Lim, and J. Choi, Effective data-balancing methods for class-imbalanced genotoxicity datasets using machine learning algorithms and molecular fingerprints, Comput. Toxicol. 20 (2021), pp. 100178. doi:10.1016/j.comtox.2021.100178.
- C. Barber, A. Cayley, T. Hanser, A. Harding, C. Heghes, J.D. Vessey, S. Werner, S.K. Weiner, J. Wichard, A. Giddings, S. Glowienke, A. Parenty, A. Brigo, H.-P. Spirkl, A. Amberg, R. Kemper, and N. Greene, Evaluation of a statistics-based Ames mutagenicity QSAR model and interpretation of the results obtained, Regul. Toxicol. Pharmacol. 76 (2016), pp. 7–20. doi:10.1016/j.yrtph.2015.12.006.
- M. Honma, A. Kitazawa, A. Cayley, R.V. Williams, C. Barber, T. Hanser, R. Saiakhov, S. Chakravarti, G.J. Myatt, K.P. Cross, E. Benfenati, G. Raitano, O. Mekenyan, P. Petkov, C. Bossa, R. Benigni, C.L. Battistelli, A. Giuliani, O. Tcheremenskaia, C. DeMeo, U. Norinder, H. Koga, C. Jose, N. Jeliazkova, N. Kochev, V. Paskaleva, C. Yang, P.R. Daga, R.D. Clark, and J. Rathman, Improvement of quantitative structure–activity relationship (QSAR) tools for predicting Ames mutagenicity: Outcomes of the Ames/QSAR International Challenge Project, Mutagenesis 34 (2019), pp. 3–16. doi:10.1093/mutage/gey031.
- Japan Ministry of Health Labour and Welfare (MHLW), Industrial Safety and Health Act of Japan, Japan Ministry of Health Labour and Welfare (MHLW), ed., 1972.
- The Division of Genetics and Mutagenesis/National Institute of Health Sciences (DGM/NIHS), AMES/QSAR international collaborative study, 2019. Available at https://www.nihs.go.jp/dgm/amesqsar.html.
- D. Weininger, SMILES, a chemical language and information-system. 1. Introduction to methodology and encoding rules, J. Chem. Inf. Comput. Model. 28 (1988), pp. 31–36. doi:10.1021/ci00057a005.
- A. Furuhama, T. Kasamatsu, K. Sugiyama, and M. Honma, Curation of more than 10,000 Ames test data used in the Ames/QSAR international challenge projects, in QSAR in Safety Evaluation and Risk Assessment, H. Hong, ed., Academic Press, 2023, pp. 365–372. doi:10.1016/B978-0-443-15339-6.00022-9.
- H.H. Gul, E. Egrioglu, and E. Bas, Statistical learning algorithms for dendritic neuron model artificial neural network based on sine cosine algorithm, Inf. Sci. 629 (2023), pp. 398–412. doi:10.1016/j.ins.2023.02.008.
- OECD, OECD Series on Testing and Assessment No. 69, Guidance Document on the Validation of (Quantitative) Structure-Activity Relationships [(Q)SAR] Models, OECD, Paris, 2007. Available at http://www.oecd.org/dataoecd/55/35/38130292.pdf.
- W.F. Schneider and H. Guo, Machine learning, J. Phys. Chem A 122 (2018), pp. 879–879. doi:10.1021/acs.jpca.8b00034.