
ABSTRACT
The first mile/last mile (FM/LM) problem in public transport refers to the spatial accessibility of public transport and is the most important factor determining whether an individual will choose public transport. The FM/LM problem in Stockholm County, Sweden, was evaluated using a Geographic Information System estimating distances to public transport for the years 2019 and 2035. Overall, the population in Stockholm County, have good access to public transport. However, access varies with abilities, with elderly having 50 percent and elderly impaired 15 percent of their area within walking distance to public transport compared with the average citizen. Planned developments can provide good access to public transport, with extensive improvements for the elderly. However, inadequate planning for population increase will likely decrease the perceived public transport accessibility. Apartments and commercial buildings in the study area have high access to public transport. Elderly people have good access within city and regional centers, while access could be improved in other areas. Inclusion of FM/LM in the planning support system used in Stockholm could help mitigate FM/LM problems and extend access to public transport to all people of different abilities. This is vital in creating sustainable mobility networks and achieving sustainable development in smart cities.
Introduction
With rapid urbanization worldwide, relevant actors are increasingly recognizing the need for actively designing smart and sustainable cities as they grow, since sustainable urban development is an essential part of creating a sustainable future (Albino et al., Citation2015; Deal and Pan, Citation2016; Pan et al., Citation2019). Development without active planning can take the form of urban sprawl and land-use changes, resulting in increased travel demand, loss of carbon sinks, urban heat islands, and higher per-capita emissions (Louiza et al., Citation2015; Mosconi et al., Citation2020; Pan et al., Citation2019; Senciales-González et al., Citation2020). Transportation is a significant contributor to total emissions from urban areas, to soil and water contamination (Kumar et al., Citation2019), and to degraded air quality (Schumacher and Shandas, Citation2019). Therefore, the creation of sustainable mobility networks is a major part of achieving a sustainable city, as demonstrated by the Sustainable Development Goals (UN General Assembly, Citation2015). Although definitions vary, a smart and sustainable city is often said to be a city that addresses urban issues using information and communication technology-(ICT) based solutions (Zheng et al., Citation2020), where planning support systems (PSS) can help inform the urban planning process (Deal et al., Citation2017). The smart city can be evaluated using six dimensions: smart mobility, smart environment, smart people, smart living, smart governance, and smart economy (Zheng et al., Citation2020). This means that in a smart city, ICT solutions are used to evaluate and improve urban performance in all aspects, such as health, quality of life, economic development, transport networks, and environmental impact (Albino et al., Citation2015). The future can then be modeled and the results used in planning support with detailed information about the past and the present to better estimate and plan for the smart and sustainable city. One such PSS has been developed and is continuously updated for Stockholm, giving important information to city and regional planners (available at http://portal.leam.illinois.edu/stockholm2017). However, that PSS currently lacks information on access to public transport. An increased modal share of public transport can help lower emissions, use existing areas effectively to limit land-use conflicts and loss of carbon sinks, and improve the mobility of individuals.
Public transport has a vital role in creating smart mobility networks with, for example, lower emissions per passenger-km and higher passenger capacity per unit surface area (Benevolo et al., Citation2016; Bok and Kwon, Citation2016). With an aging population, it is also increasingly important to include the elderly in mobility network plans. Many studies on accessibility of public transport have previously been conducted in countries such as Sweden (including case studies in Stockholm) (Asplund et al., Citation2012; Kalantari et al., Citation2017; Ryan et al., Citation2015), Thailand (Peungnumsai et al., Citation2020), Colombia (Bocarejo and Oviedo, Citation2012), the United States (Bok and Kwon, Citation2016; Chandra et al., Citation2017), Canada, Korea (Bok and Kwon, Citation2016), Poland (Kaszczyszyn and Sypion-Dutkowska, Citation2019), and New Zealand (Mavoa et al., Citation2012).
The first/last mile (FM/LM) problem in passenger transport refers to the disconnect between public transport and an individual’s origin or destination (Tight et al., Citation2016). It is directly linked to whether public transport is considered accessible and thus whether individuals choose to use it (Zellner et al., Citation2016). The most commonly used definition is that the first mile is the distance between public transport and the end-destination, and the last mile is the distance between the residence and public transport (See ). Overall, FM/LM problems occur when buildings lie outside the distance an individual is typically willing to walk to/from public transport.
Figure 1. Definition of first and last mile relating to different stages of trips
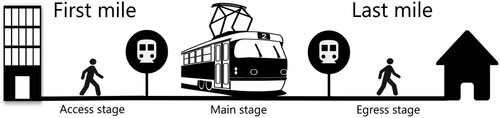
Individuals living within a public transport network service area, defined here as the area within the willingness to walk threshold distance, following a road network, from a public transport stop or station, can be considered to have access to public transport. Willingness to walk threshold distance varies by country and may vary between cities. Implementing definitions of thresholds on a case-by-case basis improves accuracy.
A lack of connectivity within the transportation system has been shown to lead to increased private car use and less use of other transportation modes, such as public transport and walking. This is especially true for the elderly, who experience more constraints to using public transport and whose mobility in general declines with age (Alsnih and Hensher, Citation2003; Asplund et al., Citation2012; Banister and Bowling, Citation2004; Daniels and Mulley, Citation2013; Ryan et al., Citation2015). High connectivity leads to a decrease in FM/LM problems and increased use of public transport, walking, and cycling, creating a more sustainable mobility network (Quadrifoglio and Chandra, Citation2011). Research has found that the most important factor determining whether an individual will choose to use public transport is spatial accessibility, with other factors such as cost, comfort, travel time, and security considered when access to public transport is within a certain threshold (Biba et al., Citation2010; Hagenauer and Helbich, Citation2017; Krygsman et al., Citation2004). Access to public transport is often said to be a way to decrease alienation, bring positive health effects, and ensure that all individuals, including the elderly and people with disabilities, can be part of society and the services provided (Banister and Bowling, Citation2004; Böcker et al., Citation2017; Ståhl et al., Citation2008). In general, the elderly and people with disabilities have slower walking speeds, and the threshold distances they are willing to walk differ from those of the average individual (Alsnih and Hensher, Citation2003; Ståhl et al., Citation2008).
Previous studies on FM/LM problems in passenger transport have mainly been solution-based, involving studies on automated vehicles (Scheltes and de Almeida Correia, Citation2017; Yap et al., Citation2016), vehicle (car or bike) sharing systems (Liu et al., Citation2012; Stiglic et al., Citation2018), feeder bus services (Charisis et al., Citation2018) or other feeder systems (Chen and Wang, Citation2018; Quadrifoglio and Chandra, Citation2011), and public transport planning using big data analysis (Poonawala et al., Citation2016). To identify areas with few or no FM/LM problems, network service areas, defined using willingness to walk threshold distances, are commonly used in accessibility studies.
The purpose of this study was to develop a planning support modeling approach, based on willingness to walk, to define FM/LM problems in public transport in Stockholm County, Sweden, and, using this approach, to evaluate FM/LM problems in public transport for 2019 and 2035 for three different population subgroups: the average population, the elderly (age 65 or older), and the elderly impaired. The work was done in collaboration with regional planners, where the long-term goal was to develop an accessible public transport network in Stockholm. This study aims at providing knowledge to improve the PSS for the Stockholm case and gain information about areas without access to public transportation within walking distance. The modeling approach ultimately aims to support the smart and sustainable development of cities in general and smart mobility networks in particular.
Willingness to Walk
Walking is the most common mode of travel to public transport in Western countries (Daniels and Mulley, Citation2013) and the dominant mode of travel for distances up to 2 km in Sweden (Wallberg et al., Citation2010). Using surveys, studies have consistently shown that individuals worldwide walk farther than the established rule of thumb of 400 m to a bus stop and 800 m to a train station, and also walk longer distances to train stations than bus stops (Daniels and Mulley, Citation2013; Durand et al., Citation2016; El-Geneidy et al., Citation2014). Studies have also shown that willingness to walk varies between countries and demographics, trip characteristics, the built environment, and numerous other factors. Thus, it is unlikely that a new standard can be established, which could explain why 400 m and 800 m are still commonly used as rules of thumb. Research has shown that an increase in distance (or travel time) to a stop or station causes a reduction in individuals using public transport (Keijer and Rietveld, Citation2000; Krygsman et al., Citation2004). The most important factor is the mode of the public transport trip, with other factors not significant in explaining walking distance (Daniels and Mulley, Citation2013). This is supported by results from studies examining willingness to walk to public transport for bus, metro, and train transport (See ). The 85th percentile is commonly used to define the threshold distance that individuals are willing to walk.
Table 1. Reported values for willingness to walk to public transport (in meters and for the average individual)
Willingness to Walk in Stockholm
A travel habits survey conducted in Stockholm County in 2016 found that Stockholmers on average walk 3,100 m per trip, and the population on average (including car users) walks 1,100 m per day (Stockholms läns landsting, 2016). Stockholm planning guidelines include the longest accepted walking distances to public transport in the current public transport network for specific bus lines for elderly people (Region Stockholm, Citation2018a) and future development (Tillväxt- och regionplaneförvaltningen, Citation2018). These distances vary between 200 and 2,000 m, depending on the type of building and age group, but do not apply to low population density areas.
Differences between Population Subgroups
The majority of studies looking at willingness to walk and walking to public transport show that distances traveled and usage rate of public transport decrease with age after retirement (Alsnih and Hensher, Citation2003; Banister and Bowling, Citation2004; Daniels and Mulley, Citation2013). In Stockholm, use of public transport is most common in individuals aged 25–64 years (69 percent) and least likely in individuals aged 65 years or over (9 percent) (Stockholms läns landsting, Citation2016). A decreasing tendency to use public transport with age has also been shown in several other countries (Fiedler, Citation2007), with differences of 15 to 23 percent in how far individuals are willing to walk depending on age group and mode of transport (Daniels and Mulley, Citation2013). The ability to walk and the average speed generally decrease with age. In a survey performed in three different cities in Sweden (Wretstrand et al., Citation2009), 56 percent of respondents aged 75 years or older reported being able to walk 300 m or more without taking a break, while 12 percent could not walk 50 m. Among individuals with a physical disability or using walking aids, 55–80 percent were able to reach their nearest bus stop (on average between 150 and 335 m walking distance) (Wretstrand et al., Citation2009). For the more mobile elderly, studies show that a 10 to 15 minute walk is considered acceptable (Ariza-Álvarez et al., Citation2019; Daniels and Mulley, Citation2013; Hess, Citation2009; Zhang et al., Citation2014), resulting in distances of 600–900 m assuming an average speed of 3.6 km/h (Reneland, Citation2004). However, this group is more sensitive to distance and is more likely to use a car instead, if one is accessible (Alsnih and Hensher, Citation2003; Hess, Citation2009). Research suggests that the ability to drive or access to a car as a passenger has major significance for mobility, the number of activities and trips performed (Marottoli et al., Citation1997), and can affect the quality of life of elderly people (Banister and Bowling, Citation2004).
Walking speed in Sweden is on average 5.0 km/h, with a speed of 3.6 km/h for the elderly or physically impaired (Reneland, Citation2004). Younger elderly individuals (62–76) in general have a faster walking speed, around 4.0 km/h (Shoval et al., Citation2010). Barriers such as footpath design, obstacles in getting onto public transport, weather features such as snow and ice (Asplund et al., Citation2012; Böcker et al., Citation2017), car ownership (Böcker et al., Citation2017; Ryan et al., Citation2015; Schwanen et al., Citation2001), and walking distance (Ariza-Álvarez et al., Citation2019; Daniels and Mulley, Citation2013; Hess, Citation2009; Zhang et al., Citation2014) have a great impact on the transport modal choice of the elderly.
Materials and Method
Study Area
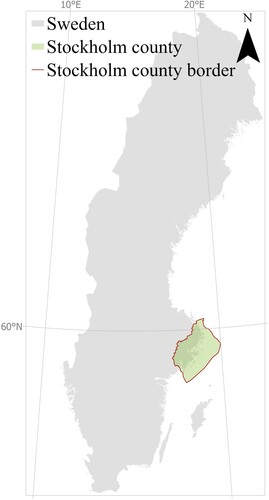
The study area was Stockholm County and the public transportation network part of Stockholm Public Transport (SL) (See ). Modes of transportation not provided by SL and islands connected to the mainland by boat services were excluded from the analysis. The results were likely not significantly affected by this, as it excluded, for example, long-distance bus services run by others, a mode of transport not commonly used for commuting. A total of almost 20,000 buildings in the Stockholm archipelago was also excluded, of which more than half are in holiday home areas with no or few permanent residents. Stockholm County is one of the pioneers in employing scientific findings in official climate planning. The county has committed to a climate-neutral greenhouse gas (GHG) emissions goal, with the City of Stockholm committed to being fossil-free by 2040 (Stockholms stad, Citation2016; Tillväxt- och regionplaneförvaltningen, Citation2018). Emissions from road traffic are the most significant contributor to GHG emissions within the transportation system, comprising just over 80 percent of all transport emissions in Stockholm County (Statistics Sweden, Citation2017; Stockholms stad, Citation2018), with cars being responsible for 62 percent of these emissions (RUS, Citation2018).
Figure 2. Stockholm County in Sweden
Stockholm County is experiencing major population growth, with projected growth of nearly 50 percent from 2015 to 2050. County and city planning authorities have established regional development plans (RUFS) guiding both short-term and long-term development to provide the infrastructure needed to support this growth. The current plan focuses on development up until the year 2050, focusing on densification close to existing public transportation and creating mixed-used areas where active modes of transport areused to decrease dependency on private vehicles.
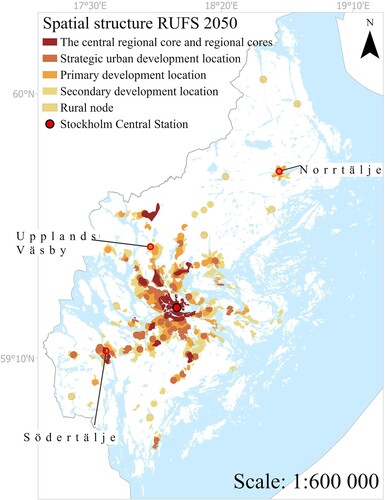
The RUFS regional spatial structure (See ) is divided into five areas: (1) The central regional core and regional cores, (2) strategic urban development locations, (3) primary development locations, (4) secondary development locations, and (5) rural nodes. The central regional core and regional cores are mainly already developed. Strategic urban development locations are areas prioritized for urban development, with mixed-used areas, densification, and access to fast public transportation and active modes of transport being considered. Primary and secondary development locations are currently less dense and are given lower priority in planning. Rural nodes are areas with the potential to connect surrounding rural areas with services such as food stores, schools, and healthcare and serve as transfer points to public transport lines operating in rural areas. These areas are the priority for development in rural areas. Planned developments in public transport include extensions to existing lines, developing new lines, and providing more bus lines with fewer stops, leading to faster services for areas outside the city center (Tillväxt- och regionplaneförvaltningen, Citation2018).
Figure 3. The spatial structure map of development areas established in RUFS 2050 (Region Stockholm Citation2018d)
Stockholm’s public transportation network comprises five modes of transport: bus, light rail, metro, commuter train, and boat. In the present analysis, stops and stations were merged into two categories: bus services and train services. The average distance between stations and average speed were considered when comparing light rail services. Bus services included buses and light rail services with similar characteristics to buses, while train services included metro, commuter trains, and light rail with features similar to metro or commuter trains.
Spatial Analysis of Pedestrian Distance to Public Transport
A framework for identifying FM/LM problems in public transport was developed based on previous FM/LM studies and willingness to walk to public transport studies. A spatial analysis model based on Stockholm-specific data and willingness to walk threshold distances relevant for Stockholm was created in ArcGIS Desktop 10.7.0 (ESRI, USA) using the framework. The threshold distances were used to define the boundaries of the public transport network service areas following walkable roads to public transport stops and stations. The service areas were used to indicate areas with access to public transport. In modeling future scenarios, urban development areas established by regional development planners (Tillväxt- och regionplaneförvaltningen, Citation2018) were used for the assessment, as the development of new buildings is most likely to take place there. Euclidean service areas were used in future scenarios to complement the network service areas to account for the uncertainty of future road development. An index of around 1.2 from Euclidean to network distance is commonly reported (Levinson and El-Geneidy, Citation2009), and therefore the Euclidean distance used was network service area distance divided by 1.2. Water areas were excluded from the resulting Euclidean service areas.
Scenarios
Two scenarios were modeled, one for the year 2019 using current public transport networks, roads, and buildings, and one for the year 2035 using development plans. In the assessment of the 2035 scenario, the spatial structure map presented in RUFS (Tillväxt- och regionplaneförvaltningen, Citation2018) was used for analysis. For both scenarios, an assessment was made of access to public transport for the average population and the elderly and elderly impaired subgroups. All population subgroups are assumed to live evenly across the county, as no data are available on where individuals of specific age groups live. Individuals aged 60 years old or older make up 21 percent of the total population in Stockholm County (Statistics Sweden, Citation2020).
Threshold Distance of Network Service Area in the Case Study
The threshold distances in were used to establish network service areas within walking distance of public transport. As the average Stockholmer is willing to walk farther than those in many other countries, the higher end of the range of willingness to walk thresholds reported in the literature () was chosen to define the problem area.
Table 2. First mile/last mile (FM/LM) threshold distances (meters) for the average population and the elderly and elderly impaired subgroups
This is in line with findings in a Stockholm study (Stockholms läns landsting, Citation2016) for when walking is the dominant mode of transport (1,200–2,000 m). The threshold for the elderly is in line with studies showing that the more mobile elderly find it acceptable to walk 10–15 minutes to access public transport. The threshold for the elderly impaired is in line with Stockholm planning guidelines for this group of individuals (Region Stockholm, Citation2018a) and with the 15 percent of respondents (elderly) who reported difficulty walking farther than 200 m in a Swedish study (Ståhl et al., Citation2008).
Data Acquisition
Data on public transport and future development were collected in collaboration with regional development planners at Region Stockholm (Tillväxt- och regionplaneförvaltningen). Buildings and road data were obtained from Lantmäteriet (the Swedish mapping, cadastral, and land registration authority) and population data concerning building types and locations from Statistics Sweden. An overview of the data collected is given in . Line data for planned bus, train, and tram lines were available, but very few stops and stations have been planned. Therefore, missing stops and stations were created along the planned lines using available information on distances between stops or, when no information was available, using average distances between stops of current lines along planned lines. Available roads were extracted and split so that highways were excluded, as these are not traversable. Road types defined by Lantmäteriet were used to identify the type of road. The number of individuals lacking access to public transport was estimated by multiplying the number of residential buildings per type by the average number of individuals living in that type of building, using national statistics (Statistics |Sweden, Citation2015, Citation2019a, Citation2019b).
Table 3. Data used for modeling in Geographic Information System (GIS)
Validation and Calibration
Model validation was performed using randomly selected buildings that were outside network service areas after running the model. The chosen buildings were compared with Google maps satellite images (Google Maps, accessed April 14, 2019), revealing two model errors. The first error arose where buildings were clearly within a willingness to walk threshold to a public transport stop or station, but there was no pathway available to pedestrians in the dataset. An informal road was assumed to exist in those cases, as most appeared to have some type of road or walkable area (such as a dirt road, field, or forest) in Google maps, which indicates a lack of data in the current dataset. The other error arose when buildings completely lacked a connection to a road, which occurs when a building is part of, or enclosed by, another building. Both these problems led to overestimation of the number of buildings within problem areas. A search radius was applied using a Euclidean buffer (network service area distance divided by 1.2) to limit the impacts of these errors. The Euclidean buffer threshold distance was chosen based on the median values for each mode of transport shown in for the average population, and Euclidean buffers of the network service area distance were used for the elderly and elderly impaired subgroups. All buildings within the Euclidean buffer area were assumed to have a connection to public transport and were removed from the problem areas.
Results
The FM/LM Problem in the 2019 Scenario
Areas identified as having FM/LM problems in Stockholm County in 2019 were mostly outside the city center and regional centers. The problem areas were almost all rural areas, with around one-third being holiday home areas. The buildings without access to public transport comprised 12 percent of all buildings in Stockholm County. The vast majority (97.3 percent) of these problem buildings were residences, and almost all were small one to two family households, with less than 1 percent being apartments. Approximately 98,500 individuals lived in problem areas in 2019, which is equal to 4 percent of the population of Stockholm County. However, the established guidelines for public transport do not apply to rural areas, and most (97 percent) of the problem buildings were in rural areas.
Population Subgroups
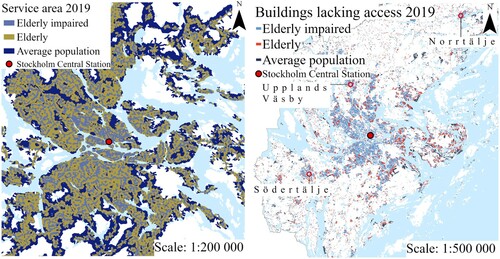
Comparing population subgroups revealed significant differences in access to public transport in the 2019 scenario, as can be seen from the network service areas indicated in and . The service area with access to public transport for the elderly was about 50 percent of that for the average population, while that of the elderly impaired was 15 percent of that for the average population. Access to rail-bound transport was low, with the elderly impaired almost completely lacking access to this mode of transportation. The fact that the elderly impaired lack adequate access to public transport is further highlighted in (right) and 5 (bottom), which show buildings lacking access within willingness to walk threshold distances. The different groups in the figures are superimposed so that service areas and problem areas for all groups are shown on top of each other.
Figure 4. Service areas with access to public transport (left) and buildings lacking access to public transport (right) in the 2019 scenario shown on top of each other in each population group
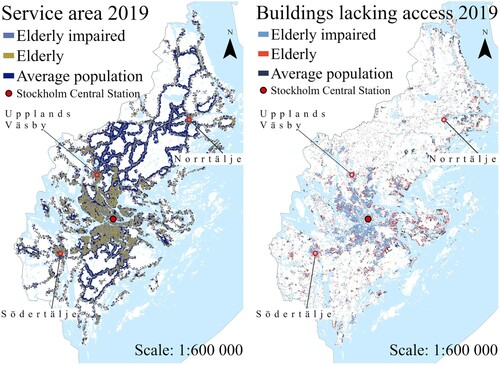
Figure 5. Services areas with access to public transport (left) and buildings lacking access to public transport (right) in the 2019 scenario, showing central areas of Stockholm City
The FM/LM Problem in the 2035 Scenario
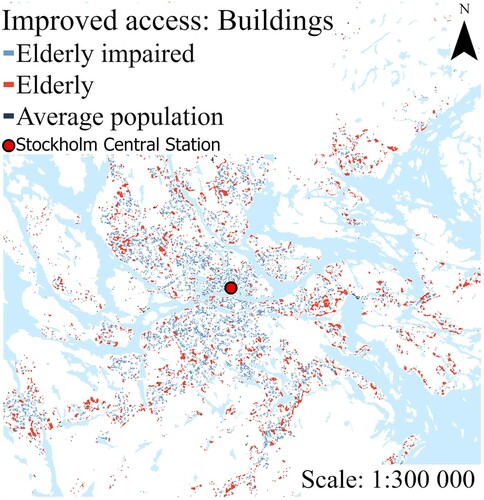
Assumed future development and planned public transport expansions resulted in increased access to public transport for all individuals from the 2019 level, with the most significant changes for the elderly and elderly impaired. The number of problem buildings decreased by 31.4 percent for the elderly and 14.8 percent for the elderly impaired, with a slight decrease in the average population. and show the areas and buildings that gain access to public transport between the 2019 and the 2035 scenarios, given current plans.
Figure 6. Areas lacking access in 2019 that will have gained access to public transport by 2035
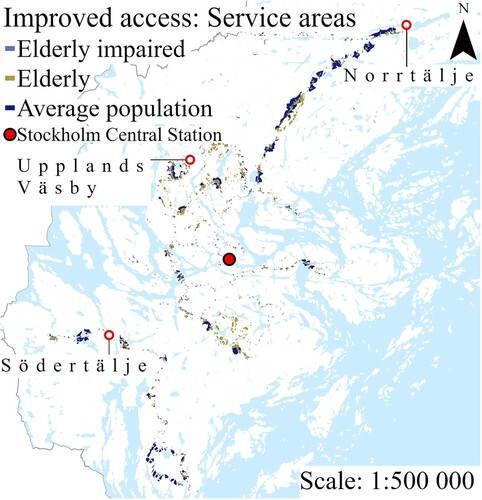
Figure 7. Buildings lacking access in 2019 that will have gained access to public transport by 2035. The figure shows central areas in Stockholm City
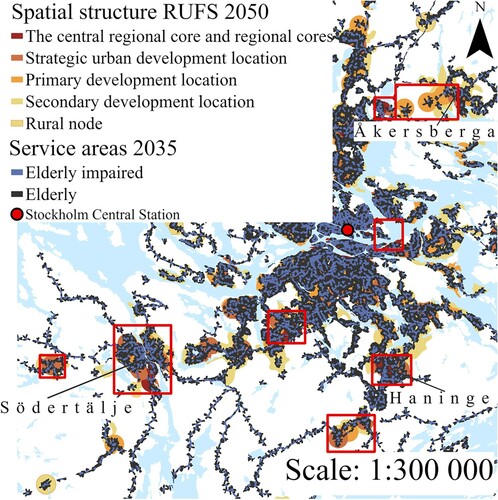
Spatial structure development areas in the RUFS plans (See ) for the average population were largely covered by service areas, meaning that they have access to public transport (See ). Secondary development locations were not considered a problem, as little focus is given to development in these areas. Primary development locations and rural nodes were given less weight as problem areas than regional cores and strategic development locations. As the different spatial structures steering future developments are shown underneath the service area layers, the spatial structures shown in red squares in and are not part of the service areas and, therefore, lack a connection to public transportation given current plans. Using the Euclidean service area resulted in a 30 percent larger service area and fewer areas lacking access to public transport. Six specific areas with potential future problems were identified: Arlanda/Märsta, Södertälje, Åkersberga, Bromma airport, and two close to the city center: one container terminal in Frihamnen and one oil port in Nacka. All these areas are within a regional core or strategic urban development location, areas that, according to RUFS plans, should have good access to public transportation. These areas were mostly or entirely covered by the Euclidean service area, indicating a lack of road network for pedestrians. After erasing the Euclidean buffer from the problem areas, only a few small areas remained for the average population, and of these, only one was significant. Its entire “central regional core and regional cores” were made up of Arlanda/Märsta.
Figure 8. Network service area for the average population (left) and for population subgroups (right) as an overlay on the planned development areas. Areas in red rectangles are areas lacking access to public transport. For the elderly and elderly impaired, areas highlighted reflect problem areas that remain in the Euclidean service area
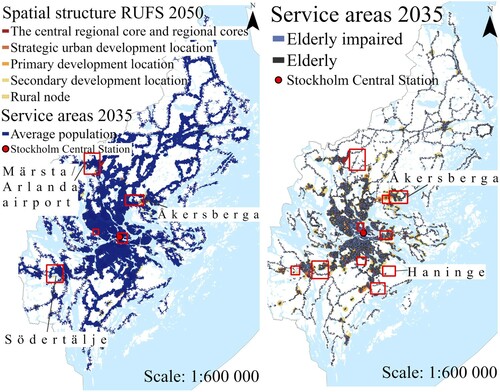
Figure 9. Close-up of potential problem areas south of Stockholm city center, shown in red rectangles for the population subgroups in the 2035 scenario
Population Subgroups
The improvements in public transport access with future development in the 2035 scenario were much more significant for the elderly and elderly impaired population subgroups than for the average population, with the most significant improvement for the elderly (See ). However, 66.6 percent of buildings were still too far away from public transport to be considered accessible for the elderly impaired, compared with 78.2 percent in the 2019 scenario. Approximately 90 percent of the elderly will have access to public transport from their residence, and they will be able to reach 80 percent of all destinations by 2035.
Table 4. Changes with future development in public transport access up until 2035 for the average population and the elderly and elderly impaired subgroups
Around 70 percent of the elderly impaired will have access to public transport from their residence, and they will be able to reach 33 percent of all destinations by 2035. The number of potential problem areas in the RUFS spatial structure areas increased for the elderly and elderly impaired subgroups, as seen in and . Most of the added areas for the population subgroups were in southern parts of the county: Huddinge, Haninge, Västerhaninge, Nykvarn, and Arninge. In contrast with the results for the average population, using Euclidean service areas instead of following the road network did not change the results significantly, and the problem areas remained. However, most smaller areas in the central regional core or strategic development locations were not a problem with the Euclidean service areas.
Discussion
Defining the FM/LM Problem
The proposed framework to assess FM/LM problems uses willingness to walk threshold distances, revealing areas and buildings with no access to public transport. As many variables affect willingness to walk on a specific trip, an equation-based threshold could be used (Chandra et al., Citation2017). More data could be included, such as travel time and timetable data known to affect the rate at which individuals use public transport. However, the model proposed in this study can be easier to use when data or time available is limited. For a larger study area, such as the case used in this paper, the model still yielded important insights into areas lacking access to public transport access.
Using willingness to walk as a threshold distance has limitations. Willingness to walk distances are often based on distances individuals report having walked, and individuals using other means of transportation are excluded. If the goal is to increase the use of public transportation, information on the willingness to walk of individuals currently not using public transportation could be of interest, together with travel time data and population density. Despite this, it can be said that distances individuals are willing to walk are longer than the established rule of thumb as found in other studies, for example (Daniels and Mulley, Citation2013; Durand et al., Citation2016; El-Geneidy et al., Citation2014), vary between modes of transport (Daniels and Mulley, Citation2013; El-Geneidy et al., Citation2014), and need to be adapted on a country-specific or preferably city-specific basis, as can be seen from the variations between cities and countries in .
Walking distance calculations to produce public transport network service areas are based on the available road network. However, there is likely a lack of data on informal roads, e.g., through forests, and individuals could choose to walk other routes to avoid areas or elements perceived as negative or because they find another path more attractive to use.
The FM/LM Problem in Stockholm County
Regional planning in Stockholm County is long-term planning for sustainable development. The Stockholm region’s regional development plan (RUFS 2050) extends to 2050 (Tillväxt- och regionplaneförvaltningen, Citation2018). With a projected population growth of approximately 50 percent, totaling 1.1 million people, there is a need for PSS for land-use development and development of the mobility network. Region Stockholm currently uses a PSS that supports transport, including public transport and private vehicles, but the PSS do not include the FM/LM problem. One of the most important factors for sustainable development and the Stockholm region’s possibility of reaching the climate goal is to decrease travel by car and increase public transport use. As the FM/LM problem in public transport is the most important factor determining whether an individual will choose public transport, the method and results in this study can support the PSS that Region Stockholm uses today and could help inform other regions on how to design a system to identify and mitigate FM/LM problems to create infrastructure that supports smart mobility and ultimately a smart and sustainable city.
Overall, the analysis revealed that the elderly have good access to public transport within the city center and regional cores but limited access in many other areas, while the elderly impaired have limited access to public transport. Ryan et al. (Citation2015) found that high residential density and possibility to use public transport were strongly correlated for elderly individuals in Stockholm, which is supported by our findings. Asplund et al. (Citation2012) also found that living in rural and suburban areas was a general disadvantage for the elderly and that the majority of disabled people included in the study had not used public transport in the past year. For most of Stockholm County, public transport cannot currently be considered competitive when travel time quotas are considered (AB Storstockholms Lokaltrafik, Citation2017), making individuals more inclined to use other modes of transport. To increase usage rates of public transport, door-to-door travel time needs improvement. Another potentially less costly option for municipalities in rural areas would be to ensure that nodes have available parking and easy access to public transport to continue the trip. For holiday home areas with more frequent travel during the summer, seasonal public transport lines could be considered.
Changes with Future Development
The network service area in the scenario for 2035 was larger than for 2019, indicating that more areas will have access to public transport in the future. However, changes with future development need to be considered in the context of a large population increase. As travel time, population density, and the extent of overcrowding on public transport are not included in FM/LM analysis, having access to public transport does not necessarily equate to public transport being perceived as accessible. If the number of individuals using a specific service increases without an increase in the number of departures or passenger capacity of the vehicle, or the travel time increases because of additional stops, the perceived accessibility can be negatively affected. Inclusion of travel time, an approximate number of individuals currently using a service, and predictions on how that number will increase in certain areas in the future could yield better estimates of areas with potential future problems with public transport. Having access to public transport and actively planning transport development can have a major impact on the resulting greenhouse gas emissions. For example, transport emissions were reduced by 6.7 percent and there was an overall reduction in emissions of 5.3 percent in an urban development scenario focusing on minimizing travel time and losses of carbon sinks studied by Pan et al. (Citation2019). To sustainably develop Stockholm and limit increases in transport demand, avoiding the removal of forest areas and urban sprawl, and instead focusing on development close to public transport is preferred to minimize impacts that would negatively affect air, soil, and water quality, carbon sinks, urban heat island, and access to green areas.
Most of the elderly and elderly impaired in Stockholm County will have access to public transport from their residence by 2035, assuming they live evenly spread across the county. In reality, the elderly in Sweden tend to move from houses to apartments or special accommodation as they grow older. As apartments have higher access to public transport in general, the situation for older people is likely better than described in this study, both in the current and future scenarios. However, many elderly people in Stockholm county still live in single-household houses (37 percent for the age groups 60–67 and 70–79, 29 percent of those aged 80 years or older) and are more likely to do so than individuals aged less than 40 years old (Statistics Sweden, Citation2020). As the elderly make up roughly 20 percent of the population in Stockholm (Statistics Sweden SCB, 2020), a significant proportion of the elderly in the city are likely to experience FM/LM problems.
Planners can use service area maps such as those made in this study to identify areas with FM/LM problems and remedy problems through addition of public transport stops, improving access for all population groups. An additional approach to consider when planning the region could be to increase availability of special accommodation for the elderly and make this an attractive alternative to living in single-households, with close proximity to public transport and other services such as health care, as most elderly people move from their house to some form of special accommodation (Statistics Sweden, Citation2020).
The difference in results obtained for network service area and Euclidean service area indicates that access to public transport will improve if pedestrian paths are built. However, the difference can also be due to a lack of data on informal roads. As development areas only approximate future development, parts of problem areas might not be developed, especially those close to the boundary of a development area. With that in mind, only one area in Stockholm County, Arlanda/Märsta, is likely to remain a problem for the average population. As this area is near the main airport, the type of development possible in this area is limited. For the elderly and elderly impaired population subgroups, most problem areas are close to the boundary of a development area. However, the problem areas are more extensive than for the average population, and it could be valuable for planners to review these areas to avoid future access problems.
Conclusions
Modeling of FM/LM problem areas can help reveal accessibility problems within the transport system and support the planning of smart and sustainable mobility networks. In the Stockholm case, the developments required to support the rapid population increase need to account for FM/LM problems when planning roads and public transport to avoid future accessibility issues. There are currently almost no problems relating to access to public transport within walking distance for apartments and commercial buildings in Stockholm County. However, access varies with the age and ability of individuals, with the elderly having good access within the city center and regional cores, while the elderly impaired have limited access in general. Stockholm planning guidelines for existing buildings exclude areas with low population density, which can explain why rural and holiday home areas have the least access.
Development plans for Stockholm County show great ambitions for providing high access to public transport to the average population and improved access to the elderly and elderly impaired. However, if public transport planning fails to account for population increases, there is a strong probability that the perceived accessibility of public transport will decrease. Therefore, a planning support modeling approach conducted in consultation with regional planners can be a fruitful way to explore planning options for alternative future scenarios to increase access to public transport and mitigate FM/LM problems while simultaneously fulfilling other sustainability goals. Planning for access to public transport for all people in society is key to creating sustainable mobility networks and achieving sustainable development in smart cities.
Disclosure Statement
No potential conflict of interest was reported by the authors.
Additional information
Notes on contributors
Elisie Kåresdotter
Elisie Kåresdotter is a PhD student in the Department of Physical Geography, Stockholm University, Sweden. Her research interests include sustainable urban and rural development, climate change adaptation and mitigation, and water-related conflicts due to climate change.
Jessica Page
Jessica Page is a PhD student at the Department of Physical Geography, Stockholm University, Sweden. Her research interests include sustainable urban and regional planning, in particular the use and development of planning support systems, as well as using technology to better understand the interactions between urban systems and the environment.
Ulla Mörtberg
Ulla Mörtberg is an associate professor in spatial and environmental systems analysis at KTH Royal Institute of Technology, Stockholm. Her research interests include spatial sustainability assessment and development of decision support models and tools for sustainable development of urban-to-rural landscapes and systems.
Helena Näsström
Helena Näsström is a regional planner at Tillväxt- och regionplaneförvaltningen, Region Stockholm, Sweden. Her research interests include regional planning, sustainable urban and rural development, planning support tools, models for land-use planning, and scenario analyses.
Zahra Kalantari
Zahra Kalantari is an associate professor at Stockholm University, Director of the Navarino Environmental Observatory (NEO) in Greece, and Research Area Co-leader of the Bolin Centre for Climate Research. Her research interests include sustainable urban and rural development, sustainable cities, and adaptive land-use planning for decision support.
References
- AB Storstockholms Lokaltrafik,: Trafikplan 2020 (Stockholm: 2009) <http://www1.sl.se/pdf/trafikplan%202020_klickbar.pdf > Accessed April 23, 2019.
- AB Storstockholms Lokaltrafik, Fakta om SL och länet 2016 (Stockholm: Trafikförvaltningen Stockholms läns landsting, 2017) <https://sl.se/contentassets/9314f2e3ea1a4890b5e25d8fa5092c9a/sl_och_lanet_2016.compressed.pdf > Accessed October 11, 2019.
- V. Albino, V. U. Berardi, and R. M. Dangelico, 2015 “Smart Cities: Definitions,: Dimensions, Performance, and Initiatives,” Journal of Urban Technology 22: 1 (2015) 3–21.
- R. Alsnih and D. Hensher, “The Mobility and Accessibility Expectations of Seniors in an Aging Population,” Transportation Research Part A: Policy and Practice 37: 10 (2003) 903–916 <https://doi.org/https://doi.org/10.1016/S0965-8564(03)00073-9 > .
- A. Ariza-Álvarez, A. Arranz-López, and J. A. Soria-Lara, “Comparing Walking Accessibility Variations between Groceries and Other Retail Activities for Seniors,” Research in Transportation Economics 100745 (2019) <https://doi.org/https://doi.org/10.1016/j.retrec.2019.100745 > .
- K. Asplund, S. Wallin, and F. Jonsson, “Use of Public Transport by Stroke Survivors with Persistent Disability,” Scandinavian Journal of Disability Research 14: 4 (2012) 289–299.
- D. Banister and A. Bowling, “Quality of Life for the Elderly: The Transport Dimension,” Transport Policy 11: 2 (2004) 105–115.
- C. Benevolo, R. P. Dameri and B. D’Auria, “Smart Mobility in Smart City,” in T. Torre, A. M. Braccini, and R. Spinelli, eds., Empowering Organizations (Cham: Springer International, 2016) 13–28.
- S. Biba, K. M. Curtin, and G. Manca, “A New Method for Determining the Population with Walking Access to Transit,” International Journal of Geographical Information Science 24: 3 (2010) 347–364 <https://doi.org/https://doi.org/10.1080/13658810802646679 > .
- J. P. Bocarejo and D. R. Oviedo, “Transport Accessibility and Social Inequities: A Tool for Identification of Mobility Needs and Evaluation of Transport Investments,” Journal of Transport Geography 24 (2012) 142–154.
- L. Böcker, P. van Amen, and M. Helbich, “Elderly Travel Frequencies and Transport Mode Choices in Greater Rotterdam, the Netherlands,” Transportation 44: 4 (2017) 831–852.
- J. Bok and Y. Kwon, “Comparable Measures of Accessibility to Public Transport Using the General Transit Feed Specification,” Sustainability 8: 3 (2016) 224 <https://doi.org/https://doi.org/10.3390/su8030224 > .
- J. Brand, S. Hoogendoorn, N. van Oort, and B. Schalkwijk, “Modelling Multimodal Transit Networks Integration of Bus Networks with Walking and Cycling,” presented at the 2017 5th IEEE International Conference on Models and Technologies for Intelligent Transportation Systems (MT-ITS) (Naples, Italy: IEEE, 2017) 750–755.
- S. Chandra, J. Jimenez, and R. Radhakrishnan, “Accessibility Evaluations for Nighttime Walking and Bicycling for Low-Income Shift Workers,” Journal of Transport Geography 64 (2017) 97–108 <https://doi.org/https://doi.org/10.1016/j.jtrangeo.2017.08.010>
- A. Charisis, C. Iliopoulou, and K. Kepaptsoglou, “DRT Route Design for the First/Last Mile Problem: Model and Application to Athens, Greece,” Public Transport 10:3 (2018) 499–527, <https://doi.org/https://doi.org/10.1007/s12469-018-0188-0>
- Y. Chen and H. Wang, “Pricing for a Last-Mile Transportation System,” Transportation Research Part B: Methodological 107 (2018) 57–69.
- R. Daniels and C. Mulley, “Explaining Walking Distance to Public Transport: The Dominance of Public Transport Supply,” Journal of Transport and Land Use 6: 2 (2013) 5–20.
- B. Deal and H. Pan, “Discerning and Addressing Environmental Failures in Policy Scenarios Using Planning Support System (PSS) Technologies” Sustainability 9: 1 (2016) <https://doi.org/https://doi.org/10.3390/su9010013 > .
- B. Deal, H. Pan, V. Pallathucheril, and F. Fulton, “Urban Resilience and Planning Support Systems: The Need for Sentience,” Journal of Urban Technology 24: 1 (2017) 29–45.
- C. P. Durand, X. Tang, K. P. Gabriel, I. N. Sener, A. O. Oluyomi, G. Knell, A. K Porter, D. M. Hoelscher, and H. W. Kohl, “The Association of Trip Distance with Walking to Reach Public Transit: Data from the California Household Travel Survey,” Journal of Transport & Health 3: 2 (2016) 154–160.
- A. El-Geneidy, M. Grimsrud, R. Wasfi, P. Tétreault, and J. Surprenant-Legault, “New Evidence on Walking Distances to Transit Stops: Identifying Redundancies and Gaps Using Variable Service Areas,” Transportation 41: 1 (2014) 193–210.
- M. Fiedler, Older People & Public Transport: Challenges and Chances of an Ageing Society (Köln: European Metropolitan Transport Authorities, 2007) <https://www.emta.com/IMG/pdf/Final_Report_Older_People_protec.pdf > Accessed November 4, 2019.
- J. Hagenauer and M. Helbich, “A Comparative Study of Machine Learning Classifiers for Modeling Travel Mode Choice,” Expert Systems with Applications 78 (2017) 273–282.
- P. Hartoft-Nielsen, Stationsnærhedspolitikken i hovedstadsområdet – baggrund og effekter, By- og Landsplanserien (Copenhagen: Skov and Landskab, 2002) <https://videntjenesten.ku.dk/filer/rapporter/planlaegning-og-friluftsliv/bogl18.pdf > Accessed February 28, 2019.
- D. B. Hess, “Access to Public Transit and Its Influence on Ridership for Older Adults in Two U.S. Cities,” Journal of Transport and Land Use 2: 1 (2009) <https://doi.org/https://doi.org/10.5198/jtlu.v2i1.11 > .
- Z. Kalantari, S. Khoshkar, H. Falk, V. Cvetkovic, and U. Mörtberg, “Accessibility of Water-Related Cultural Ecosystem Services through Public Transport: A Model for Planning Support in the Stockholm Region,” Sustainability 9: 3 (2017) 346 <https://doi.org/https://doi.org/10.3390/su9030346 > .
- P. Kaszczyszyn and N. Sypion-Dutkowska, “Walking Access to Public Transportation Stops for City Residents. A Comparison of Methods,” Sustainability 11: 14 (2019) 3758 <https://doi.org/https://doi.org/10.3390/su11143758 > .
- M. J. N. Keijer and P. Rietveld, “How Do People Get to the Railway Station? The Dutch Experience,” Transportation Planning and Technology 23: 3 (2000) 215–235.
- I. Ker and S. Ginn, “Myths and Realities in Walking Catchments: The Case of Walking and Transit,” Road and Transport Research 12: 2 (2003) 69–80.
- S. Krygsman, M. Dijst, and T. Arentze, “Multimodal Public Transport: An Analysis of Travel Time Elements and the Interconnectivity Ratio,” Transport Policy 11: 3 (2004) 265–275.
- R. Kumar, V. Kumar, A. Sharma, N. Singh, R. Kumar, J. K. Katnoria, R. Bhardwaj, A. K. Thukral, and J. Rodrigo-Comino, “Assessment of Pollution in Roadside Soils by Using Multivariate Statistical Techniques and Contamination Indices,” SN Applied Sciences 1: 8 (2019) 842 <https://doi.org/https://doi.org/10.1007/s42452-019-0888-3 > .
- Lantmäteriet, “GSD-Fastighetskartan”, 2017.
- D. Levinson and A. El-Geneidy, “The Minimum Circuity Frontier and the Journey to Work,” Regional Science and Urban Economics 39: 6 (2009) 732–738.
- Z. Liu, X. Jia, and W. Cheng, “Solving the Last Mile Problem: Ensure the Success of Public Bicycle System in Beijing,” Procedia: Social and Behavioral Sciences 43 (2012) 73–78.
- H. Louiza, A. Zéroual, and H. Djamel, “Impact of the Transport on the Urban Heat Island,” International Journal for Traffic and Transport Engineering 5: 3 (2015) 252–263.
- R. A. Marottoli, C. F. Mendes de Leon, T. A. Glass, C. S. Williams, L. M. Cooney, L. F. Berkman, and M. E. Tinetti, “Driving Cessation and Increased Depressive Symptoms: Prospective Evidence from the New Haven EPESE,” Journal of the American Geriatrics Society 45: 2 (1997) 202–206.
- S. Mavoa, K. Witten, T. McCreanor, and D. O’Sullivan, “GIS Based Destination Accessibility via Public Transit and Walking in Auckland, New Zealand,” Journal of Transport Geography 20: 1 (2012) 15–22.
- E. M. Mosconi, A. Colantoni, F. Gambella, E. Cudlinová, L. Salvati, and J. Rodrigo-Comino, “Revisiting the Environmental Kuznets Curve: The Spatial Interaction between Economy and Territory,” Economies 8: 3 (2020) 74 <https://doi.org/https://doi.org/10.3390/economies8030074 > .
- H. Pan, J. Page, L. Zhang, C. Cong, C. Ferreira, E. Jonsson, H. Näsström, G. Destouni, B. Deal, and Z. Kalantari, “Understanding Interactions between Urban Development Policies and GHG Emissions: A Case Study in Stockholm Region,” Ambio 49: 7 (2019) 1313–1327.
- A. Peungnumsai, H. Miyazaki, A. Witayangkurn, and S. M. Kim, “A Grid-Based Spatial Analysis for Detecting Supply–Demand Gaps of Public Transports: A Case Study of the Bangkok Metropolitan Region,” Sustainability 12 (2020) 10382 <https://doi.org/https://doi.org/10.3390/su122410382 > .
- H. Poonawala, V. Kolar, S. Blandin, L. Wynter, and S. Sahu, “Singapore in Motion: Insights on Public Transport Service Level Through Farecard and Mobile Data Analytics,” in Proceedings of the 22nd ACM SIGKDD International Conference on Knowledge Discovery and Data Mining - KDD ‘16, presented at the 22nd ACM SIGKDD International Conference (San Francisco, CA: ACM Press, 2016) 589–598.
- L. Quadrifoglio and S. Chandra, Evaluating the Effect of Street Network Connectivity on First/Last Mile Transit Performance (College Station: National Technical Information Service The Texas A&M University System, 2011).
- Region Stockholm, Riktlinjer Planering av kollektivtrafiken i Stockholms län (Stockholm: Trafikförvaltningen 2018a) <https://www.sll.se/globalassets/2.-kollektivtrafik/kollektivtrafik-for-alla/riktlinjer-planering-av-kollektivtrafiken-i-stockholms-lansl-s-419761.pdf > Accessed March 18, 2019.
- Region Stockholm, Beslutade investeringsåtgärder transportinfrastrukturen (Stockholm: Region Stockholm, 2018b) <http://rufs.se/kartor/rufs-2050> Accessed February 14, 2019.
- Region Stockholm,: Plankarta Stockholms län 2050 (Stockholm: Region Stockholm, 2018c) <http://rufs.se/kartor/rufs-2050> Accessed April 1, 2019.
- Region Stockholm, SL Spårstationer (Stockholm, Growth and Regional Planning Administration, 2018d).
- Region Stockholm, “Nya tunnelbanan – Region Stockholm”, Nya tunnelbanan < https://nyatunnelbanan.sll.se/> Accessed May 6, 2019.
- M. Reneland, Tillgänglighetsvillkor i svenska städer TVISS (Vägverket, 2004) <https://trafikverket.ineko.se/Files/sv-SE/11550/RelatedFiles/2004_005_tillganglighetsvillkor_i_svenska_stader.pdf>.
- P. Rietveld, “The Accessibility of Railway Stations: The Role of the Bicycle in The Netherlands,” Transportation Research Part D: Transport and Environment 5: 1 (2000) 71–75.
- RUS, Länsrapport Stockholm, Nationella emissionsdatabasen (RUS, 2018) <http://extra.lansstyrelsen.se/rus/Sv/statistik-och-data/nationell-emissionsdatabas/Pages/default.aspx > Accessed January 25, 2019.
- J. Ryan, A. Wretstrand, and S. M. Schmidt, “Exploring Public Transport as an Element of Older Persons’ Mobility: A Capability Approach Perspective,” Journal of Transport Geography 48 (2015) 105–114.
- A. Scheltes and G. Homem de Almeida Correia, “Exploring the Use of Automated Vehicles as Last Mile Connection of Train Trips through an Agent-Based Simulation Model: An Application to Delft, Netherlands,” International Journal of Transportation Science and Technology 6: 1 (2017) 28–41.
- K. A. Schumacher and V. Shandas, “Rescaling Air Quality Management: An Assessment of Local Air Quality Authorities in the United States,” Air, Soil and Water Research 12 (2019) 1–13.
- T. Schwanen, M. Dijst, and F. M. Dieleman, “Leisure Trips of Senior Citizens: Determinants of Modal Choice,” Tijdschrift Voor Economische En Sociale Geografie 92: 3 (2001) 347–360.
- J. M. Senciales-González, J. Rodrigo-Comino, and P. Smith, “Surveying Topographical Changes and Climate Variations to Detect the Urban Heat Island in the City of Málaga (Spain),” Cuadernos de Investigación Geográfica 46: 2 (2020) 521–543.
- N. Shoval, G. Auslander, K. Cohen-Shalom, M. Isaacson, R. Landau, and J. Heinik, “What Can We Learn about the Mobility of the Elderly in the GPS Era?” Journal of Transport Geography 18: 5 (2010) 603–612.
- A. Ståhl, G. Carlsson, P. Hovbrandt, and S. Iwarsson, “‘Let’s Go for a Walk!’: Identification and Prioritization of Accessibility and Safety Measures Involving Elderly People in a Residential Area,” European Journal of Aging 5: 3 (2008) 265–273.
- Statistics Sweden, Fritidshusområden 2015 (Statistics Sweden: 2015) <https://www.scb.se/hitta-statistik/regional-statistik-och-kartor/geodata/oppna-geodata/fritidshusomraden/> Accessed May 11, 2019.
- Statistics Sweden, Befolkningen I Stockholms län 2016 (Statistics Sweden: 2017) <http://rufs.se/globalassets/f.-demografiska-prognoser/demografiska-prognoser/befolkningsutveckling/befolkningsokning_2016.pdf > Accessed January 29, 2019.
- Statistics Sweden, Antal hushåll och genomsnittligt antal personer per hushåll efter region, boendeform och lägenhetstyp (exklusive småhus). År 2012–2018 (Statistics Sweden: 2019a) <http://www.statistikdatabasen.scb.se/pxweb/sv/ssd/START__HE__HE0111/HushallT30/?rxid=9a5d5c6b-0ab1-4a15-9849-220ba60d6d06> Accessed May 6, 2019.
- Statistics Sweden, Antal och andel hushåll efter region, boendeform och hushållstyp. År 2012–2018 (Statistics Sweden: 2019b) <http://www.statistikdatabasen.scb.se/pxweb/sv/ssd/START__HE__HE0111/HushallT22> Accessed May 11, 2019.
- Statistics Sweden, Antal och andel hushåll efter region, boendeform, ålder och kön (Statistics Sweden, 2020) <http://www.statistikdatabasen.scb.se/pxweb/sv/ssd/START__HE__HE0111/HushallT21B/> Accessed February 18, 2021.
- M. Stiglic, N. Agatz, M. Savelsbergh, and M. Gradisar, “Enhancing Urban Mobility: Integrating Ride-Sharing and Public Transit,” Computers and Operations Research 90 (2018) 12–21.
- Stockholms läns landsting, Resvanor i Stockholms län 2015 (Stockholm: Trafikförvaltningen, 2016) <https://www.sll.se/globalassets/2.-kollektivtrafik/kollektivtrafiken-vaxer-med-stockholm/su/resvaneundersokningen/resvanor-i-stockholms-lan-2015-version-20160817.pdf > Accessed April 1, 2019.
- Stockholms stad, Strategy for a Fossil Fuel Free Stockholm by 2040 (Stockholm: Stockholms stad, 2016) <https://international.stockholm.se/globalassets/rapporter/strategy-for-a-fossil-fuel-free-stockholm-by-2040.pdf > Accessed January 29, 2019.
- Stockholms stad, “Växthusgasutsläpp från transporter – Stockholms miljöbarometer,” Miljöbarometern, 2018 <http://miljobarometern.stockholm.se/klimat/utslapp-av-vaxthusgaser/vaxthusgasutslapp-fran-transporter/vagtrafik > Accessed January 29, 2019.
- M. Tight, F. Rajé, and P. Timms, “Car-Free Urban Areas: A Radical Solution to the Last Mile Problem or a Step Too Far?” Built Environment 42: 4 (2016) 603–616.
- Tillväxt- och regionplaneförvaltningen, Regional utvecklingsplan för Stockholmsregionen RUFS 2050 (Stockholm: Stockholms läns landsting, 2018) <http://rufs.se/globalassets/e.-rufs-2050/rufs_regional_utvecklingsplan_for_stockholmsregionen_2050_tillganglig.pdf > Accessed January 29, 2019.
- UN General Assembly, Transforming Our World: The 2030 Agenda for Sustainable Development (New York: UN General Assembly, 2015) <https://sustainabledevelopment.un.org/content/documents/21252030%20Agenda%20for%20Sustainable%20Development%20web.pdf > Accessed August 22, 2019.
- S. Wallberg, O.: Grönvall, R. Johansson, M. Hermansson, L. Linderholm, A. Nilsson, L. Söderström, G. Öberg, and A. Niska, GCM-handbok: utformning, drift och underhåll med gång-, cykel- och mopedtrafik i fokus (Solna: SKL Kommentus and Sveriges kommuner och landsting, 2010) <https://www.trafikverket.se/contentassets/0271094089c7499d8fcd95d5b6b4a22e/trafikverket-och-skl-gcm-handbok-utformning-drift-och-underhall-med-gang–cykel-och-mopedtrafik-i-fokus-pdf-fil-56-mb-oppnas-i-nytt-fonster.pdf > Accessed March 28, 2019.
- A. Wretstrand, H. Svensson, S. Fristedt, and T. Falkmer, “Older People and Local Public Transit: Mobility Effects of Accessibility Improvements in Sweden,” Journal of Transport and Land Use 2: 2 (2009) <https://doi.org/https://doi.org/10.5198/jtlu.v2i2.87 > .
- M. D. Yap, G. Correia, and B. van Arem, “Preferences of Travellers for Using Automated Vehicles as Last Mile Public Transport of Multimodal Train Trips,” Transportation Research Part A: Policy and Practice 94 (2016) 1–16.
- M. Zellner, D. Massey, Y. Shiftan, J. Levine, and M. J. Arquero, “Overcoming the Last-Mile Problem with Transportation and Land-Use Improvements: An Agent-Based Approach,” International Journal of Transportation 4: 1 (2016) 1–26.
- Y. Zhang, Y. Li, Q. Liu, and C. Li, “The Built Environment and Walking Activity of the Elderly: An Empirical Analysis in the Zhongshan Metropolitan Area, China,” Sustainability 6: 2 (2014) 1076–1092.
- C. Zheng, J. Yuan, L. Zhu, Y. Zhang, and Q. Shao, “From Digital to Sustainable: A Scientometric Review of Smart City Literature between 1990 and 2019,” Journal of Cleaner Production 258 (2020) 120689 <https://doi.org/https://doi.org/10.1016/j.jclepro.2020.120689 > .
- T. Zuo, H. Wei, and A. Rohne, “Determining Transit Service Coverage by Non-Motorized Accessibility to Transit: Case Study of Applying GPS Data in Cincinnati Metropolitan Area,” Journal of Transport Geography 67 (2018) 1–11.