
ABSTRACT
Noise action planning (NAP) requires collaboration among stakeholders, given the harmful health effects of noise and the subjectivity of how individuals perceive noise. Maptables can be used to mediate in such a collaborative spatial planning process. However, open software applications specifically designed for those devices are still limited or mismatched with user needs. This study presents the co-design and development process of an Open Geo-Spatial Interactive Tool (OGITO-noise) intended for maptables users. We explore to what extent such a tool can be usable and useful in supporting collaborative NAP in practice. Our methods combine agile software development and human-centered design (HCD) in a hybrid fashion, namely remote co-design meetings and face-to-face testing, to develop an open application that our intended users found useful. Those methods were utilized during a pandemic but can also be used when dealing with geographic or resource limitations.
Introduction
Noise is a growing environmental problem diminishing the overall quality of life and well-being of residents in large cities (Minichilli et al., Citation2018). The adverse effects of noise on the human population’s health include annoyance, sleep disturbance linked to an increased rate of cardiovascular diseases, reduced daytime performance, low performance of children at school (Muzet, Citation2007; Lee et al., Citation2020), and mental, neurological and behavioral disorders (Minichilli et al., Citation2018). Long-term noise exposure has been linked to hearing loss, increased hyperactivity in children, and hypertension (Minichilli et al., Citation2018; Petri et al., Citation2021). In response to such increasing noise pollution and its harmful effects, the European Union (EU) adopted the Environmental Noise Directive (END) 2002/49/EC (EU, Citation2002) which defines planning instruments, i.e. Noise Action Plans, “to manage noise issues and effects, including noise reduction if necessary” (EU, Citation2002: 14).
Noise action planning (NAP) objectives are to diminish the harmful health effects of noise and preserve environmental noise quality where it is positive, e.g. quiet areas (King et al., Citation2011). NAP requires the involvement of different stakeholders such as municipal authorities, environmental organizations, local community members (Hintzche and Heinrichs, Citation2018; Maisonneuve et al., Citation2009; Riedel et al., Citation2017). Nonetheless, the participation of various professional stakeholders in NAP is scarcely reported in the literature.
A relatively recent tool used to engage with stakeholders in collaborative spatial planning processes is the so-called maptable. This large horizontal touch-screen enables users to interact with geo-spatial content and offers a platform that accommodates enhanced communication and collaboration (Flacke et al., Citation2020; Pelzer et al., Citation2013). Maptables capabilities are particularly advantageous when complex concepts are discussed. For example, Shrestha et al. (Citation2018) used a maptable to explore Cumulative Burden Assessment (CuBA), a complex concept that included noise nuisance. In this study, participants were able to interact with each other, learn about CuBA and co-produce knowledge. Likewise, Arciniegas and Janssen (Citation2012) used maps and drawing tools implemented in a maptable to support communication among stakeholders with different backgrounds while developing a land-use plan for a polder. Maptables have also been used as a planning support (PS) tool in other contexts, including water management, renewable energy, climate change adaptation, urban redevelopment, and walkability (Janssen et al., Citation2014; Pelzer et al., Citation2013; Voskamp and Van de Ven, Citation2014). However, there remains a paucity of evidence reported on using a maptable to support collaborative NAP.
Previous research has established the poor usability of PS tools and the disparity between PS tool capabilities and user needs as important determinants of the low uptake of PS tools in practice (Russo et al., Citation2018a; Vonk and Ligtenberg, Citation2010). To tackle this problem, the adoption of Human-Centered Design (HCD; European Committee for Standardization, 2019) has been recommended, being an iterative design workflow where users are involved through the design, development, and evaluation of an interactive system. Nonetheless, with a few exceptions (Aguilar et al., Citation2021; Rittenbruch et al., Citation2021; Trubka et al., Citation2016), studies that systematically investigated this strategy are still scarce (Flacke et al., Citation2020). In addition, the development of (open) software designed explicitly for maptables has received scant attention (Hewitt and Macleod, Citation2017). In order to address these two shortcomings and to test our hypothesis that maptables can be effectively used in supporting collaborative NAP where different stakeholders are involved, the main aims of this study are: (1) to co-design and develop an Open Geo-Spatial Interactive Tool (OGITO-noise); and (2) to explore to what extent it can be usable and useful in supporting collaborative NAP. Our methods include agile user stories, human-centered iterative software development, and evaluation of usability and usefulness of OGITO-noise for a case study in a real-world scenario.
This article is structured as follows: the next section provides a brief discussion of stakeholder involvement in NAP and co-design and evaluation of PS tools, followed by a section that elaborates on the methods. After that, we present the results and then we discuss those results in the following section and list lessons learned about co-designing an interactive PS tool in pandemic times. Finally, we draw conclusions and outline directions for future work.
Background
In this section, we elaborate on the importance of stakeholder involvement in NAP. We also describe the advantages of co-designing PS tools and provide the perspective adopted for the evaluation of the co-designed tool presented in this research.
Stakeholders’ Involvement in NAP
NAP demands collaboration between different professional stakeholders, given the harmful health effects of noise and the subjectivity of how individuals perceive noise. Also, noise abatement measures might affect other city areas, for example, infrastructure or road safety (Hintzche and Heinrichs, Citation2018). The END also requires municipalities to involve the public in NAP (EU, Citation2002: 16). Citizen involvement, particularly at the early stages of such a process, can be beneficial as people are the “local experts” who experience the noise daily (Van Renterghem et al., Citation2020; Xiao et al., Citation2018). Nonetheless, most reported citizen involvement in END-related activities mainly focused on data collection using the citizen as a sensor (Alsina-Pagès et al., Citation2017; Murphy et al., Citation2020). Also, understanding modeled maps of noise indicators that are the central instrument in NAP can be challenging for non-experts (Mietlicki et al., Citation2015; Riedel et al., Citation2017). For this reason, several research initiatives have been conducted to facilitate the participation of non-experts in such a process (Mietlicki et al., Citation2015; Van Renterghem et al., Citation2020). However, these initiatives did not exploit spatial visualization capabilities, e.g. data structuring and management in geo-information layers or interactive mapping. Also, using maptables to facilitate stakeholders’ participation in NAP or promote communication and understanding of noise concerns has not yet been investigated.
In this study, we distinguish stakeholders in NAP as our intended users for an interactive application on maptables in two groups: (1) researchers that conduct participatory activities utilizing maptables, i.e. planning workshops in which they play the role of moderator, chauffeur, or promotor (Pelzer et al., Citation2015); and (2) professionals and laypersons, who interact with a maptable and participate in the discussion because they are stakeholders of the problem at hand. In the following, we call the first group partner-users and the second end-users.
Co-Design of PS Tools
Co-design is generally understood as a participatory activity where participants and professional designers work together in the design development process (Rittenbruch et al., Citation2021; Sanders and Stappers, Citation2008). Nonetheless, there are multiple definitions and uses of terms (Heijne et al., Citation2018). In this research, we understand co-design as an approach for geo-spatial interactive system design where users non-trained in design collaborate actively with professionals, e.g. system designers and developers. Such collaboration implies providing information about the context of use and feedback while testing early design solutions (Bont et al., Citation2013).
Previous research suggests that user participation in the design and development of a PS tool has two central objectives: (1) improving the PS tool usability and, therefore, its acceptance; and (2) unraveling requirements through a dialog between the development party and users. For example, Vonk and Ligtenberg (Citation2010) reported close collaboration with intended users to develop a sketch tool in a so-called socio-technical approach. The resulting tool, aimed at professionals, was better accepted than the original prototype that was developed following a traditional design process, i.e. complete cycles of the cascade method for software development. In another study, Trubka et al. (Citation2016) used agile and co-design methods to develop a web-based tool for precinct geo-design, visualization, and assessment. The co-design approach encompassed software development iterations (prototype), user feedback collection about the prototype and its refining based on such feedback. Users evaluated the final prototype as positive and with a high level of usability. Recently, Rittenbruch et al. (Citation2021) conducted a series of co-design workshops with their industry partners to shape RAISE, an interactive scenario exploration tool to support land value uplift under different development scenarios (Pettit et al., Citation2020). The co-design process accommodated the development of a tool that addressed the needs of its intended users. Aguilar et al., (Citation2021) also described a combination of agile and HCD methods to develop an open interactive tool that supports budgetary processes. Their study showed that frequent development iterations and user feedback led to high self-reported user satisfaction. This study draws on their approach.
Evaluation of PS Tools
Usability evaluation of PS tools is conducted in various ways in previously published studies (Aguilar et al., Citation2021; te Brömmelstroet, Citation2013). In this study, we understand usability, an essential component of HCD, from the Human–Computer System Interaction (HCI) perspective that is the “extent to which a system can be used to achieve certain tasks with effectiveness, efficiency and satisfaction in a specified context of use” (European Committee for Standardization, Citation2018: 6). This perspective is adopted because the body of norms related provides a common set of concepts and basic guidance that facilitates the reproducibility of the usability evaluation. The usability evaluation is contextualized to the tasks that end-users are expected to achieve during NAP workshops.
Usefulness or added value of a PS tool has also been debated (Champlin et al., Citation2018). So far, however, this has not been closely examined in the context of NAP. Within this research, we focus on collaborative NAP; we consider PS tools as mediators for social interaction while addressing spatial planning problems (Foth et al., Citation2009; te Brömmelstroet and Schrijnen, Citation2010), in our case, NAP. Therefore, the term usefulness is used here to refer to what extent a PS tool can be used during a planning workshop supported by a maptable to: (1) collect stakeholders’ perceptions concerning noise-related issues; and (2) facilitate communication and interaction among participants (end-users) to define measures tackling those noise-related issues, or reach consensus about them. Since a system can be usable without being useful, it remains important to consider both dimensions in evaluating PS tools (Silva et al., Citation2017).
Methodology
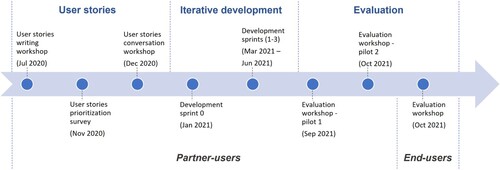
The co-design, development, and evaluation of OGITO-noise build on previous work related to PS tools development in close collaboration with stakeholders and intended users to achieve highly usable PS tools that satisfy the user needs (Aguilar et al., Citation2021; Aguilar et al., Citation2020). To do so, our methods combined agile user stories (Brhel et al., Citation2015), iterative software development, and evaluation of usability and usefulness applied to a case study. illustrates a timeline of the main co-design activities conducted with our partner-users and end-users (see the subsection on stakeholders’ involvement in NAP) following this approach, which is elaborated in the subsequent subsections.
Figure 1. Timeline of co-design activities with partner-users and end-users
Agile User Stories
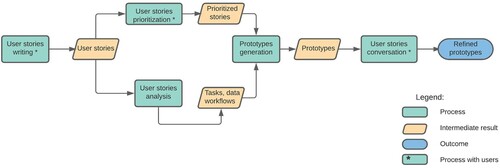
We utilized agile user stories to understand the context of use and elicit user requirements of OGITO-noise. depicts the process from user stories generation to low-fidelity prototypes design and their refinement.
Figure 2. Process from user stories to low-fidelity prototypes design and its refinement
User stories were generated with our partner-users, coming from research institutions in The Netherlands, Canada, and Germany, during a user-stories writing workshop. Five partner-users, one environmental health researcher, three planning researchers and, one GIS technician attended the activity. Collected stories followed the template displayed in , specifying Who, What, and Why of a particular capability or feature of a system—in this case, OGITO-noise. The Who indicates the user role or user group; the What denotes the software capability, whereas the Why is optional and refers to the benefit of having such capability.
Box 1: Common templates for a user story.
Given the restrictions intended to prevent the spread of the COVID-19 disease, the user-stories writing workshop was conducted remotely. In an online meeting of two hours, workshop participants were introduced to the user story concept and format, and several examples were given. Next, participants were asked to “generate” user stories. We used a “role play” format, meaning that participants were instructed to express the needs of their corresponding user group as well as another user group, e.g. expressing a user story for a role of an Environmental planner that was not represented among group participants. To maximize the speed of user stories generation, one person was in charge of writing the story while participants formulated them out in turns. The session was video recorded, with the consent of all participants.
The user stories prioritization was conducted asynchronously via an online questionnaire. Participants prioritized the previously collected stories following the MoSCoW scheme that classifies user stories as Must be, Should be, Could be, and Won’t be (Racheva et al., Citation2008). Stories prioritized as Must be are considered critical and need to be implemented. Should be stories can be implemented later, whereas Could be and Won’t be stories are beneficial but not required to be implemented.
The objective of the user stories analysis was to identify the user tasks during collaborative NAP and the required geo-spatial data. We drew on our experience from facilitating and attending maptable-based participatory workshops to identify the user tasks. Then we conceptualized a workflow based on these tasks for a participatory NAP workshop using a maptable. Such a workshop aimed to gather local perception concerning noisy and quiet areas and preference for noise abatement measures. To determine the geo-spatial data set to be included in the tool, we analyzed each prioritized user story to identify any input data required for its implementation and the output data that it would produce. For the first, we selected open or publicly available data, whereas for the second, we designed geographic information layers stored in a geo-spatial database. We also included background layers for map orientation. Written stories and video recording of the user-story-writing workshop were revisited iteratively by the first author to minimize the inherent subjectivity in our analysis.
In the prototype generation, only prioritized stories, Must be and Should be stories, were further analyzed to produce initial design solutions illustrated in low-fidelity prototypes. Those low-fidelity prototypes were discussed in a user-stories conversation workshop. The objective of this activity was: (1) to reach consensus among participants about the meaning of stories that remained unclear for some participants as expressed in the online survey and their priority; and (2) to validate the proposed workflow for prioritized stories. As stories were discussed, participants expressed their agreement or disagreement with the workflow presented. Notes were taken, and the session was video recorded after getting consent from participants. Workflows were adjusted accordingly and implemented in the development phase.
Iterative Development
Design solutions were progressively developed following an agile approach, meaning approximately four-week sprints (development iterations). These sprints allowed for incremental development and early application testing while engaging in a collaborative dialog with our partner-users, who provided feedback, discussed changes on requirements, or confirmed previously adjusted workflows. A sprint 0 was used to: (1) set up the application platform; (2) organize the required data set, i.e. creating and populating the database; and (3) restructuring the code (Aguilar et al., Citation2021). Next, we implemented prioritized user stories in subsequent sprints. After each sprint, design solutions were evaluated in a sprint review meeting (Pathak and Saha, Citation2013) in which the features developed by the application developers (i.e. researchers) were presented to our users-partners who tested and provided feedback on them. All the review meetings were video recorded to capture the comments from the user who was encouraged to speak aloud as features were tested. The feedback collected was used to adjust, if needed, the user interface (UI) of the application or the feature workflow itself.
To test OGITO-noise in a real-world setting, we developed and tested a core version of it in three iterations with our partner-users where most highly prioritized stories were implemented. Then, we applied it in such a real-world setting, i.e. we tested OGITO-noise in a workshop with participants from the planning practice to support collaborative NAP. The following subsections provide details of the evaluation framework applied and the case study selected.
Evaluation Framework
The evaluation of OGITO-noise aimed to gain insights into its usability and usefulness, as perceived by end-users, also called participants, for tasks related to NAP using a maptable. For the usability evaluation, we selected a task-based evaluation. Meaning that, during a NAP workshop, participants execute specific tasks using OGITO-noise and provide feedback about its usability by filling a post-workshop questionnaire (see Appendix B) and participating in an open discussion. Questions were asked in lay terms to avoid bias in participation. The open discussion allowed participants to provide additional feedback, e.g. how they perceived the tool and what they would suggest to advance it.
The usability dimensions were contextualized to the tasks carried out by workshop participants of our case study as follow:
effectiveness: measured by perceived completeness, meaning that the map sufficiently depicts the current noise situation
efficiency: measured by human effort, i.e. ease of use of the application
satisfaction: evaluated the general user attitude toward the application.
Table 1. Usefulness evaluation of OGITO-noise. Adapted from Pelzer (Citation2017) and Champlin et al. (Citation2018)
Prior to applying this evaluation framework in a workshop with stakeholders from planning practice (end-users), we conducted two pilot workshops with participants from two different universities. The purpose of these pilots was to test the workshop design, e.g. time allocated for each task, tasks order, instructions for participants, and test the evaluation framework. We adjusted those aspects when needed and proceeded to conduct a workshop with end-users.
Case Study
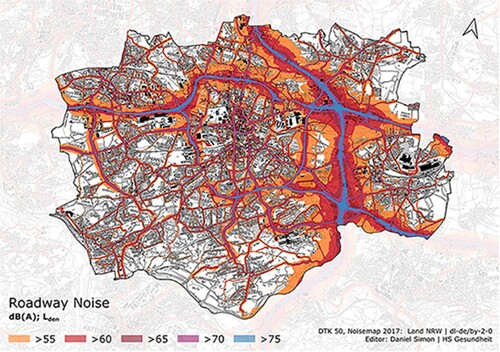
We selected the city of Bochum, Germany as the case study given the expressed interest in a maptable tool for collaborative planning and hence the accessibility to stakeholders and the public availability of modeled noise maps. presents a noise map of the Bochum city; lighter red colors represent lower levels of noise exposure, the blue color represents the highest noise exposure level.
Figure 3. A noise map of Bochum, Germany. Source: HS Gesundheit.
End-users, i.e. staff from the municipality, interacted with OGITO-noise to evaluate its potential to support collaborative NAP in a maptable-based workshop setting. Such a group consisted of four professional planners; two are involved in strategic planning, one in transport planning, and the other in planning for environmental health. In this workshop, OGITO-noise was utilized to gather participants’ perceptions of the current acoustic environment, e.g. identify noisy places, and discuss measures or interventions for noise abatement (Xiao et al., Citation2018). To do so, the workshop followed a sequence of tasks to be executed by participants (see Identified Tasks for a Maptable-Based NAP Workshop).
Results
This section presents the identified tasks and workflow for a maptable-based NAP workshop, depicts OGITO-noise’s architecture, data set and main components, and reports on its usability and usefulness evaluation.
Identified Tasks for a Maptable-Based NAP Workshop
Partner-users generated 29 user stories during the user stories writing workshop (see Appendix A in the supplementary data). Those user stories were further analyzed to identify functional requirements of OGITO-noise, user groups, and associated tasks executed in planning workshops supporting NAP. Potential end-user groups specified by partner-users during the user story-writing workshop were laypersons, environmental professionals, city planners, NGOs, politicians, local tram companies, city health department professionals, and researchers. Identified tasks to be carried out by these user groups were clustered in five main headings as follows:
data exploration: to get to know the data set via map navigation, layer management, and map symbology
data analysis: to examine the current noise burden by visualizing and quantifying the intersection of modeled noise maps and the population and vulnerable institutions exposed to certain levels of noise (via spatial queries)
identification: to draw in the map perceived noisy and quiet places and indicate perceived noise sources and noise annoyance for noisy places
intervention: to propose and rate noise abatement measures for a particular area; to rate areas that might be designated as quiet, and to explore noise-making projects and projects related to noise abatement measures
collaboration: to share the outcome of a group work around a maptable when several groups participate in a workshop using several maptables or when several groups are participating synchronously and remotely
data enrichment: to add local knowledge considering existing (noise/quiet) data.
Workshop Design
Considering the tasks identified in the previous section, our workshop experience, software development capacity, and insights from the pilot workshops, the following design for a participatory workshop of two hours emerged in which participants conducted three main activities with a maptable: (1) analysis of the current noise burden situation; (2) identification of noisy places; and (3) proposing and rating noise abatement measures. Two activities—introduction and closing—were also included. In the introduction, a moderator explained the purpose of the workshop and the data set used, whereas in the closing, participants were asked to provide feedback about OGITO-noise via a questionnaire and open discussion. We excluded tasks related to the exploration of noise-making projects and projects related to noise abatement measures as they were not directly related to the development of noise action plans, and it might have been challenging to obtain updated information on such projects. Also, the collaboration tasks were omitted as we envisioned a co-located and synchronous setting for this workshop, i.e. participants around a maptable. A planning researcher from our partner-users moderated the workshop, and one of the authors provided technical support.
OGITO-Noise Application Platform and Spatial Data Set
OGITO Platform. OGITO’s architecture consists of a frontend that provides the UI of the application and a backend that provides services to process user input data and access to the data stored in a PostgreSQL database (https://www.postgresql.org/). This architecture (see ) was extended from previous work (Aguilar et al., Citation2021) to accommodate, as required by partner-users, analytical capabilities via Application Programming Interface (API) services offered by postgraphile (https://www.graphile.org/postgraphile/). This API allowed for computing spatial queries and retrieving, on the fly, their results during a workshop session. Spatial data layers such as aerial photos or official noise maps were downloaded or consumed from German official repositories (https://www.bezreg-koeln.nrw.de/brk_internet/geobasis/index.html and http://laermkartierung1.eisenbahn-bundesamt.de); we also utilized Open Street Map (OSM; https://www.openstreetmap.org/) as an alternative background layer (see ).
Figure 4. OGITO-noise's Architecture
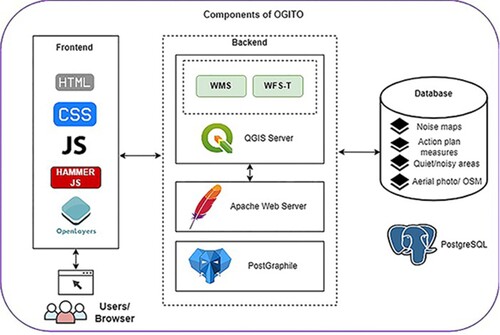
Table 2. Spatial data included in OGITO-noise
Spatial Data Set. The spatial data set included in OGITO-noise consisted of modeled noise maps, i.e. maps of average day-evening-night noise levels (Lden) and night-time noise levels (Lnight) for streets, industries, and trains and light rail trains. These modeled maps enabled users to analyze the current noise burden situation in the study area. We also included open data concerning critical infrastructure and population density. This data was used to compute on-the-fly and represent in the map institutions and population exposed to certain noise levels. Users could also generate maps of noisy and quiet places as perceived by them, and a map of noise measures, i.e. location where actions to abate noise are proposed and rated. lists the spatial data included in OGITO-noise and their corresponding source.
Key Components of the Application
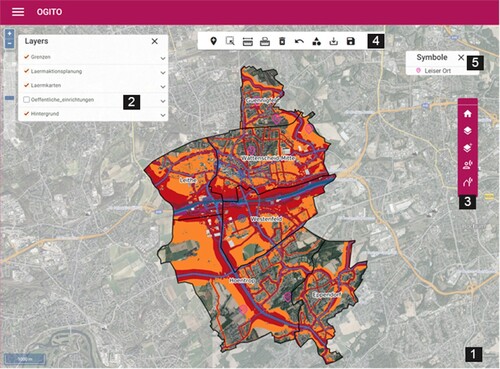
The OGITO-noise user interface is depicted in . The central component is an interactive map (1) that responds to common gestures such as pinch (to zoom in), unpinch (to zoom out), pan (to move) and rotate. Buttons and a control bar are also provided for zoom in and zoom out; and a graphical scale bar is presented at the lower-left corner of the map. The layer management (2) allows layer groups and layers to be shown or hidden; layer groups can be reordered. This component (2), in combination with the editing toolbar (4) and a symbol panel (5), also supplies tools for information retrieval and data input. Similarly, sketching tools are provided on the main toolbar (3) in combination with (4) and (5). Analytical capabilities, i.e. spatial queries to find population or critical infrastructure exposed to different noise sources are also accessible via the main toolbar (3).
Figure 5. OGITO-noise interface (screenshot from application, with boxed numbers added for explanations in this article). Note: Refer to Appendix D for short descriptions of German terms
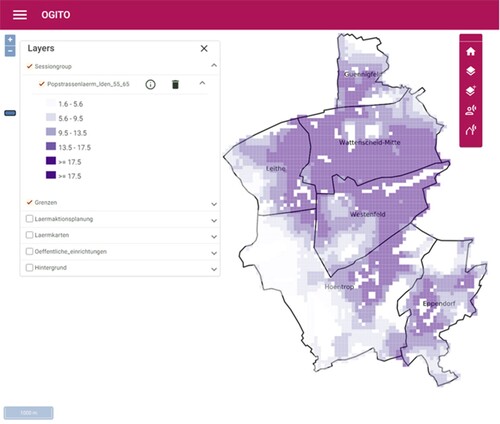
As mentioned earlier, the NAP workshop in which OGITO-noise was utilized by end-users consisted of three main activities. To analyze the current noise situation, participants displayed modeled noise maps, retrieved information from them, and quantified the population and institutions exposed to certain noise levels via on-the-fly spatial queries. To perform such queries, participants selected the noise source, e.g. roads, industries, etc. and noise thresholds, meaning the lower and upper noise level limits. For institutions, participants also selected the type of institution. The newly computed layer was added to the map. presents the modeled noise map for roads, day-evening-night (Lden), whereas depicts the estimated population exposed to Lden values between 55 and 65 dB(A); darker values represent higher number of people per grid-cell in .
Figure 6. Modeled noise map for roads – day-evening-night noise levels (Lden) (Screenshot from application)Note: Refer to Appendix D for short descriptions of German terms
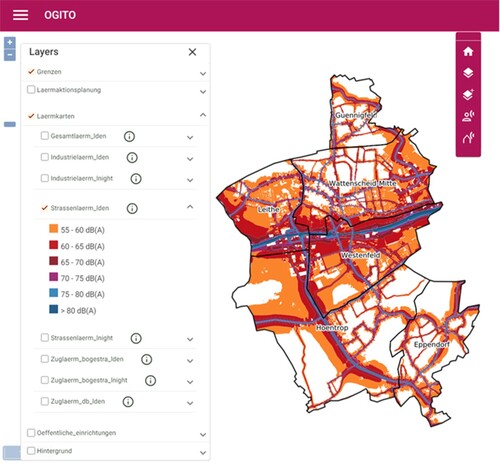
Figure 7. Estimated population exposed to roads noise levels (Lden) between 55 and 65 dB(A) (Screenshot from application) Note: Refer to Appendix D for short descriptions of German terms.
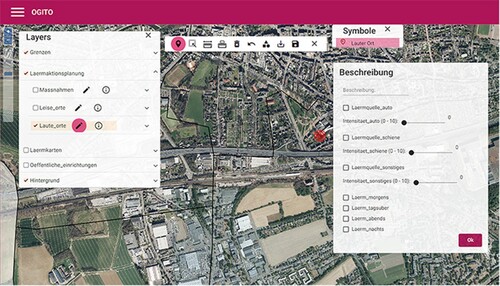
The identification of noisy places enabled adding participants’ perception regarding noise by identifying noisy places in the map and adding additional information. For example, sources, time, and intensity of the perceived noise. illustrates the case of a noisy place. Noisy or quiet places could also be edited, e.g. moved or deleted.
Figure 8. Adding an identified noisy place in OGITO-noise (Screenshot from application) Note: Refer to Appendix D for short descriptions of German terms.
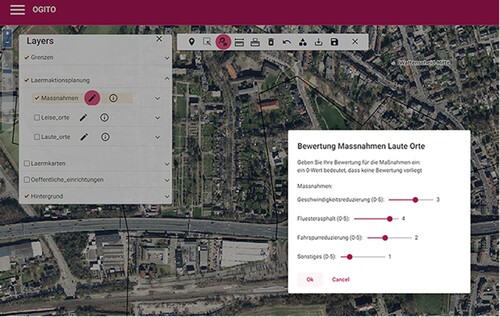
Proposing and rating noise abatement measures were performed in two steps. First, users map the location, i.e. add a point where specific measures are desired; the application gives a set of predefined measures, but it is possible to propose others. In the second step, the selected/proposed measures can be rated to express preference. and show the two-step process to propose and rate noise abatement measures for a particular location.
Figure 9. Proposing noise abatements measures (Screen from the application) Note: Refer to Appendix D for short descriptions of German terms.
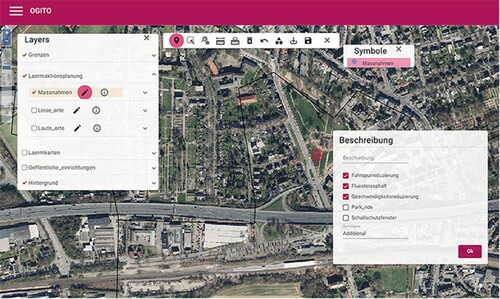
Figure 10. Rating noise abatements measures (Screen from the application) Note: Refer to Appendix D for short descriptions of German terms.
OGITO-noise also allows adding sketch layers where points, lines, and polygons can be drawn. However, this functionality was not included during the NAP workshop due to the limit of two hours for such workshop.
Usability and Usefulness Evaluation
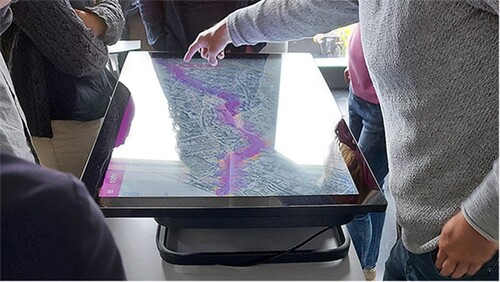
Four participants, end-users, from the municipality attended the workshop in the city of Bochum, where the usability and usefulness of OGITO-noise were evaluated. Workshop participants were professionals, and their ages ranged from 31 to 65 years old. They all had attended other participatory mapping activities before more than three times. illustrates a maptable and the participants around it during the NAP workshop.
Figure 11. OGITO-noise used during the noise action planning (NAP) workshop in Bochum. Source: Rosa Aguilar
The overall response to the efficiency of the tool was positive. Participants found it easy or very easy to navigate the map and to rate noise abatement measures. However, the exercise of identifying populations and institutions exposed to noise and deleting elements from the interactive map was not seen as very easy. The evaluations ranged from easy or neither easy nor difficult to one person declaring it difficult to add elements to the map.
The evaluation of effectiveness was also positive. Participants strongly agreed or agreed that the tool allowed them to complete the majority of the tasks, e.g. to identify elements in the map, identify populations and institutions exposed to noise, and express preferences about noise abatement measures. Also, most participants strongly agreed that the tool allowed adding (drawing) noisy and quiet places as identified by them; one participant neither agreed nor disagreed in this regard. On the other hand, participants were divided concerning the ease of learning of the tool. Nonetheless, the general satisfaction toward OGITO-noise was positive because all participants agreed or strongly agreed to recommend its use.
During the open discussion, participants were asked to provide general feedback concerning the application. Responses were clustered in three main categories: (1) application; (2) data set; and (3) workshop. Concerning the application, a common view among participants was that the tool is interactive and stimulates discussion; they also foresee potential applications to involve citizens. Participants also expressed that adding additional layers on demand would be beneficial; for example, online layers from WMS (Web Map Services), locally stored layers, including CAD files, or newly computed data. Also, an annotation tool similar to those available in interactive boards was suggested. Regarding the visualization of the spatial data, suggestions included adding more contrast to the symbology for noisy and quiet areas or the inclusion of 3D views for specific locations. Concerning the workshop, participants considered the interactive maptable workshop to fit in the process of preparing decisions, i.e. before taking action to abate the noise burden. Additionally, in order to be inclusive of people with limited mobility, doing the workshop in a seated position around the table was proposed.
Questionnaire responses were markedly positive regarding OGITO-noise’s usefulness. Participants agreed or strongly agreed that the application was useful to facilitate collaboration and communication among the group. Likewise, the majority of the participants agreed or strongly agreed that they achieved consensus. Concerning learning, all participants reported learning about the nature of the noise and how it can be addressed; however, they did not agree or disagree about the novelty of their insights. Participants also reported learning about other participants’ perspectives regarding noise and the perception that their own perspective was also understood. However, there was neither agreement nor disagreement among participants regarding understanding the solutions suggested for other participants. We discuss these results in the following subsection.
Discussion
This study applied a co-design approach to develop OGITO-noise—an open interactive tool to support NAP. We adapted traditional co-design methods to a hybrid environment which is still uncommon in HCI research (Harrington and Dillahunt, Citation2021). Our partner-users remained engaged during the whole co-design process. This engagement conformed to the research orientation of our users-partners and the time allocated to each online meeting that was limited to two hours; other studies, in contrast, reported users’ challenges to remain engaged in a remote design environment (Harrington and Dillahunt, Citation2021; Kennedy et al., Citation2021). More research should investigate whether such hybrid methods can produce similar engagement results when applied with laypersons. Such engagement is particularly relevant due to the restrictions of social distancing imposed in several countries aiming to curb the current global pandemic.
User stories were a central element in this research. Our partner-users formulated and prioritized them and participated in the conversation where alternative designs to satisfy the requirements that such stories expressed were discussed. This process led to the functionality of OGITO-noise that was found, by end-users, usable and useful, meaning that the developed tool met the users’ needs. This finding supports previous work linking the utilization of user stories with the production of the “right” software that meets the “right” user requirements (Lucassen et al., Citation2016), and the use of HCD approaches, e.g. iterative evaluation of design solutions, with highly usable systems (Russo et al., Citation2018b).
User feedback collected during the review meetings helped fine-tune the tool functionalities and identify usability pitfalls. For example, instead of multiple ratings (e.g. per participant), adding one rating to each noise abatement measure was preferred for our partner-users because such rating would reflect the result of the discussion among participants, hence, more suitable for group dynamics. Similarly, conducting pilot workshops provided useful insights concerning its sequence of activities. For example, the analysis of the current noise situation was put first because participants of those pilots found it more logical to start with understanding the noise as expressed in the modeled maps and then identifying additional noisy and quiet places. As suggested, the activities sequence was adjusted for the workshop with end-users and worked well.
The self-reported questionnaire and the feedback gathered during the open discussion indicate that, in general, workshop participants evaluated OGITO-noise’s usability positively and expressed the intention to recommend it for NAP activities. This result is likely related to our co-design approach, where users played an active role from the early stages of the design process through cycles of software development and user feedback. These results reflect those of Vonk and Ligtenberg (Citation2010), who also found that close collaboration with users led to better-accepted planning tools. Likewise, Trubka et al. (Citation2016) reported on the benefit of iterations of software development and user feedback to achieve a highly usable system. Nonetheless, not all participants found the tool easy to learn, although it could accommodate different levels and knowledge of the city via switching geographic layers on and off. A possible explanation for this might be that understanding noise maps can be challenging for non-experts (Mietlicki et al., Citation2015; Riedel et al., Citation2017). Another possible explanation could be that end-users might need a bit of practice before being confident while interacting with touch screens, as remarked by Boulange et al. (Citation2017). In a follow-up workshop, more attention could be paid to those aspects, e.g. explaining modeled noise maps, giving more time to familiarize with the tool, and evaluating afterward.
The overall evaluation of OGITO-noise’s usefulness was also substantially positive in the five headings selected. The undoubted benefit was perceived in the communication and collaboration headings. These scores and the highly positive response on learning about the object at stake and about other stakeholders’ perspectives are consistent with previous studies on the use of maptables (Pelzer et al., 2013; Shrestha et al., Citation2018). On the other hand, we surmise that the neutral response concerning learning about noise abatement measures relates to participants’ previous knowledge because they were already familiar with such measures. Additional workshops with, e.g. citizens may provide more insights into the ability of our application to learn about noise abatement measures by lay people.
Conclusions and Future Work
The purpose of the current study was to co-design and develop an OGITO-noise tool and explore to what extent it can be usable and useful in supporting collaborative NAP. Although the number of participants (four) in our evaluation prevents us from drawing statistically-solid evidence on the usability and usefulness of such a tool in practice, our results have shown how HCD and agile methods can be employed to involve users in a co-design process to develop an open application that was—according to the self-reporting of users—usable and useful in supporting NAP with maptables. This result makes us argue that our approach is meaningful towards developing usable and useful PS tools. Furthermore, our hybrid methods, i.e. remote co-design meetings and face-to-face testing, were necessary during a pandemic but can be used when dealing with geographic or resource limitations. We also contribute to the NAP arenas by recommending a workshop structure, based on our findings, for stakeholders’ engagement in participatory activities. Future work directions might focus on the co-design process, e.g. the inclusion of end-users from the beginning of such a process, and advancements in the OGITO-noise tool such as 3D visualization, and recommendation of noise abatement measures at specific locations given certain conditions, e.g. population or critical infrastructure exposed to higher levels of noise. Also, functions for synchronous remote settings could be added, i.e. explicit management of remote collaboration given the potential of the OGITO-noise web platform for this configuration and the increasing demand for e-participation (Heijne et al., Citation2018).
Appendix C. Glossary
Supplementary data associated with this article can be found, in the online version, at https://doi.org/10.4121/22117637.
Appendix D. Short description of German terms used in the tool
Supplementary data associated with this article can be found, in the online version, at https://doi.org/10.4121/22117637.
Additional information
Notes on contributors
Rosa Aguilar
Rosa Aguilar is a post-doctoral researcher in the faculty of Geo-Information Science and Earth Observation (ITC) at the University of Twente, the Netherlands. Before ITC, she worked as a chief technical officer at the Geographic Institute of Venezuela and accumulated practical experience in Geographic Information Systems (GIS), remotely sensed image analysis, spatial database management, and Spatial Data Infrastructure (SDI). She recently joined the Geo-Information and Image Processing Department at ITC.
Johannes Flacke
Johannes Flacke is an assistant professor for spatial planning and decision support systems in the Department of Urban and Regional Planning and Geo-Information Management, Faculty of Geo-Information Science and Earth Observation (ITC), University of Twente, the Netherlands. He is the manager of the Design and Interactive Space for Co-Creating (DISC), a central facility for research on participatory and collaborative PS at the University of Twente.
Daniel Simon
Daniel Simon is a research associate and doctoral student at the Department of Community Health at the Hochschule für Gesundheit (HS Gesundheit) in Bochum, Germany.
Karin Pfeffer
Karin Pfeffer, a geographer, is a professor in infrastructuring urban futures in the Department of Urban and Regional Planning and Geo-Information Management, Faculty of Geo-Information Science and Earth Observation (ITC), University of Twente, the Netherlands.
References
- R. Aguilar, L. Calisto, J. Flacke, A. Akbar, K. Pfeffer, “OGITO, an Open Geospatial Interactive Tool to Support Collaborative Spatial Planning with a Maptable,” Computers, Environment, and Urban Systems 86 (2021) 101591.
- R. Aguilar, J. Flacke, K. Pfeffer, “Towards Supporting Collaborative Spatial Planning: Conceptualization of a Maptable Tool Through User Stories,” ISPRS International Journal of Geo-Information 9:1 (2020) 29.
- R. Alsina-Pagès, U. Hernandez-Jayo, F. Alías, and I. Angulo, “Design of a Mobile Low-Cost Sensor Network Using Urban Buses for Real-Time Ubiquitous Noise Monitoring,” Sensors 17: 1 (2017) 1–21.
- G. Arciniegas and R. Janssen, R, “Spatial Decision Support for Collaborative Land Use Planning Workshops,” Landscape and Urban Planning 107: 3 (2012) 332–342. https://doi.org/10.1016/j.landurbplan.2012.06.004.
- C. Bont, de, P. Ouden, den, H. Schifferstein, F. Smulders and M.Voort, van der, Advanced Design (Den Haag: Design United, 2013).
- C. Boulange, C. Pettit, and B. Giles-Corti, “The Walkability Planning Support System: an Evidence-Based Tool to Design Healthy Communities,” in S. Geertman et al., eds, Planning Support Science for Smarter Urban Futures, Lecture Notes in Geoinformation and Cartography (Cham: Springer, 2017) 153–165.
- M. Brhel, H. Meth, A. Maedche and K. Werder, “Exploring Principles of User-Centered Agile Software Development: A Literature Review,” Information and Software Technology 61 (2015) 163–181.
- C. Champlin, M. te Brömmelstroet and P. Pelzer, “Tables, Tablets and Flexibility: Evaluating Planning Support System Performance Under Different Conditions of Use,” Applied Spatial Analysis and Policy 12: 3 (2018) 1–25.
- EU, Directive 2002/49/ec of the European Parliament and of the Council of 25 June 2002 Relating to the Assessment and Management of Environmental Noise, Official Journal of the European Communities (2002).
- European Committee for Standardization,: Ergonomics of Human-System Interaction - Part 11: Usability: Definitions and Concepts (ISO 9241-11:2018) (Brussels: 2018).
- J. Flacke, R. Shrestha, and R. Aguilar, “Strengthening Participation Using Interactive Planning Support Systems: A Systematic Review,” ISPRS International Journal of Geo-Information 9: 1 (2020) 1–34.
- M. Foth, B. Bajracharya, R. Brown and G. Hearn, “The Second Life of Urban Planning? Using Neogeography Tools for Community Engagement,” Journal of Location Based Services 3: 2 (2009) 97–117.
- C. Harrington and T. Dillahunt, “Eliciting Tech Futures Among Black Young Adults: A Case Study of Remote Speculative Co-Design,” paper presented at Conference on Human Factors in Computing Systems (Yokohama, May 8–13, 2021).
- K. Heijne, H. van der Meer, B. Stelzle, M. Pump, K. Klamert, A. Wilde, A. Siarheyeva, and A. Jannack, Survey on Co-Design Methodologies in Urban Design, Report of WP2: Media and Methodology for Massive Participatory Processes (Delft: EU, 2018). Accessed September 16, 2021.
- R. Hewitt and C. Macleod, “What Do Users Really Need? Participatory Development of Decision Support Tools for Environmental Management Based on Outcomes,” Environments 4: 4 (2017) 88.
- M. Hintzche and E. Heinrichs, “Traffic Noise and Noise Action Planning in Germany,” paper presented at 2018 Joint Conference - Acoustics (Poland, September 11–14, 2018) 97–101.
- R. Janssen, T. Eikelboom, J. Verhoeven and K. Brouns, “Using Geodesign to Develop a Spatial Adaptation Strategy for Friesland,” in D. Lee, et al., eds., Geodesign by Integrating Design and Geo-spatial Sciences (New York: Springer, 2014) 103–116.
- A. Kennedy, C. Cosgrave, J. Macdonald, K. Gunn, T. Dietrich and S. Brumby, “Translating Co-Design from Face-To-Face to Online: An Australian Primary Producer Project Conducted During Covid-19,” International Journal of Environmental Research and Public Health 18: 8 (2021) 4147–4161.
- E. King, E. Murphy, and H. Rice, “Implementation of the EU Environmental Noise Directive: Lessons from the First Phase of Strategic Noise Mapping and Action Planning in Ireland,” Journal of Environmental Management 92: 3 (2011) 756–764.
- H. Lee, S. Garg and K. Lim, “Crowdsourcing of Environmental Noise Map Using Calibrated Smartphones,” Applied Acoustics 160 (2020) 107130–107139.
- G. Lucassen, F. Dalpiaz, J. van der Werf and S. Brinkkemper, S, “The Use and Effectiveness of User Stories in Practice,” in M. Daneva M and O. Pastor O, eds., Requirements Engineering: Foundation for Software Quality. REFSQ 2016. Lecture Notes in Computer Science (Cham, 2016) 205–222.
- N. Maisonneuve, M.: Stevens, M. E. Niessen and L. Steels, “Noisetube: Measuring and Mapping Noise Pollution with Mobile Phones,” in I. Athanasiadis et al., eds., Information Technologies in Environmental Engineering. Environmental Science and Engineering (Berlin: Springer, 2019) 215–228.
- F. Mietlicki, C. Mietlicki, C. Ribeiro, P. Gaudibert, B. Vincent and V. Gissinger, “www.noiseineu.eu: New Tools to Inform The Public About Environmental Noise in Cities and to Assist Decision-Making,” paper presented at Euronoise 2015 (Maastricht, May 31–June 3).
- F. Minichilli, F. Gorini, E. Ascari, F. Bianchi, A. Coi, L. Fredianelli, G. Licitra, F. Manzoli, L. Mezzasalma, and L. Cori.: “Annoyance Judgment and Measurements of Environmental Noise: A Focus on Italian Secondary Schools,” International Journal of Environmental Research and Public Health 15: 2 (2018) 1–17.
- E. Murphy, J.P. Faulkner and O. Douglas, “Current State-of-the-Art and New Directions in Strategic Environmental Noise Mapping,” Current Pollution Reports 6: 2 (2020) 54–64. https://doi.org/10.1007/s40726-020-00141-9.
- A. Muzet, “Environmental Noise, Sleep and Health,” Sleep Medicine Reviews 11: 2 (2007) 135–142.
- K. Pathak and A. Saha, “Review of Agile Software Development Methodologies,” International Journal of Advanced Research in Computer Science and Software Engineering 3:2 (2013) 270–276.
- P. Pelzer, “Usefulness of Planning Support Systems: A Conceptual Framework and an Empirical Illustration,” Transportation Research Part A: Policy and Practice 104 (2017) 84–95.
- P. Pelzer, G. Arciniegas, S. Geertman and J. de Kroes, “Using Maptable® to Learn about Sustainable Urban Development,” in S. Geertman, F. Toppen and J. Stillwell, eds., Planning Support Systems for Sustainable Urban Development. Lecture Notes in Geoinformation and Cartography (Berlin, Heidelberg: Springer, 2013) 167–186.
- P. Pelzer, G. Arciniegas, S. Geertman and J. de Kroes, “Introduction to ‘Planning Support Systems for Sustainable Urban Development’,” in S. Geertman, J. Stillwell and F. Toppen, eds., Planning Support Systems for Sustainable Urban Development. Lecture Notes in Geoinformation and Cartography (Berlin, Heidelberg: Springer, 2013) 1–15.
- P. Pelzer, R. Goodspeed and M. te Brömmelstroet, “Facilitating PSS Workshops: A Conceptual Framework and Findings from Interviews with Facilitators,” in S. Geertman, Jr. J. Ferreira, R. Goodspeed, J. Stillwell, eds., Planning Support Systems and Smart Cities. Lecture Notes in Geoinformation and Cartography (Cham: Springer, 2015) 355–369.
- D. Petri, G. Licitra, M.A. Vigotti, L. Fredianelli, “Effects of Exposure to Road, Railway, Airport and Recreational Noise on Blood Pressure and Hypertension,” International Journal of Environmental Research and Public Health 18: 17 (2021) 9145.
- C. Pettit, Y. Shi, H. Han, M. Rittenbruch, M. Foth, S. Lieske, M. Jamal, “A New Toolkit for Land Value Analysis and Scenario Planning,” Environment and Planning B: Urban Analytics and City Science 47: 8 (2020) 1490–1507.
- K. Pfeffer, J. Martinez, I. Baud and N. Sridharan, “Knowledge Production in Urban Governance Systems through Qualitative Geographical Information Systems (GIS),” Environment and Urbanization Asia 2: 2 (2011) 235–250.
- Z. Racheva, M. Daneva and L. Buglione, “Supporting the Dynamic Reprioritization of Requirements in Agile Development of Software Products,” paper presented at 2008 Second International Workshop on Software Product Management (Barcelona, September 9, 2008).
- N. Riedel, I. van Kamp, H. Köckler, J. Scheiner, A. Loerbroks, T. Claßen and G. Bolte, “Cognitive-Motivational Determinants of Residents’ Civic Engagement and Health (Inequities) in the Context of Noise Action Planning: A Conceptual Model,” International Journal of Environmental Research and Public Health 14: 6 (2017) 578–603.
- M. Rittenbruch, M. Foth, P. Mitchell, R. Chitrakar, B. Christensen and C. Pettit, “Co-Designing Planning Support Systems in Urban Science: The Questions They Answer and the Questions They Raise,” Journal of Urban Technology (2021) 1–26.
- P. Russo, R. Lanzilotti, M. F. Costabile and C. J. Pettit, “Adoption and Use of Software in Land Use Planning Practice: A Multiple-Country Study,” International Journal of Human–Computer Interaction 34: 1 (2018a) 57–72.
- P. Russo, R. Lanzilotti, M. F. Costabile and C. J. Pettit, “Towards Satisfying Practitioners in Using Planning Support Systems,” Computers, Environment and Urban Systems 67 (2018b) 9–20.
- E. B. Sanders and P. J. Stappers, “Co-Creation and the New Landscapes of Design,” Co-Design 4: 1 (2008) 5–18.
- R. Shrestha, J. Flacke, J. Martinez, and M. van Maarseveen, “Interactive Cumulative Burden Assessment: Engaging Stakeholders in an Adaptive, Participatory and Transdisciplinary Approach,” International Journal of Environmental Research and Public Health 15: 2 (2018) 260–283.
- C. Silva, L. Bertolini, M. te Brömmelstroet, D. Milakis and E. Papa, “Accessibility Instruments in Planning Practice: Bridging the Implementation Gap,” Transport Policy 53 (2017) 135–145.
- M. te Brömmelstroet, “Performance of Planning Support Systems: What is it, and How Do We Report on It?,” Computers, Environment and Urban Systems 41 (2013) 299–308.
- M. te Brömmelstroet and P. M. Schrijnen, “From Planning Support Systems to Mediated Planning Support: A Structured Dialogue to Overcome the Implementation Gap,” Environment and Planning B: Planning and Design 37: 1 (2010) 3–20.
- R. Trubka, S. Glackin, O. Lade and C. Pettit, “A Web-Based 3D Visualisation and Assessment System for Urban Precinct Scenario Modelling,” ISPRS Journal of Photogrammetry and Remote Sensing 117 (2016) 175–186.
- T. Van Renterghem, L. Dekoninck and D. Botteldooren, “Multi-Stage Sound Planning Methodology for Urban Redevelopment,” Sustainable Cities and Society 62 (2020) 102362–102374.
- G. Vonk and A. Ligtenberg, “Socio-Technical PSS Development to Improve Functionality and Usability-Sketch Planning Using a Maptable,” Landscape and Urban Planning 94: 3–4 (2010) 166–174. https://doi.org/10.1016/j.landurbplan.2009.10.001
- I. M. Voskamp and F. H. M. van de Ven, “Planning Support System for Climate Adaptation: Composing Effective Sets of Blue-Green Measures to Reduce Urban Vulnerability to Extreme Weather Events,” Building and Environment 83 (2014) 159–167.
- J. Xiao, L. Lavia and J. Kang, “Towards an Agile Participatory Urban Soundscape Planning Framework,” Journal of Environmental Planning and Management 61: 4 (2018) 677–698.
Appendix A.
List of users’ stories and associated tasks for a NAP workshop
Supplementary data associated with this article can be found, in the online version, at https://doi.org/10.4121/22117637.
Appendix B.
Post-workshop questionnaire
This survey is part of the mapping activity in the municipality of Bochum, Germany—the case study of this research. Your participation will be a great help to us. The responses will be kept anonymous. They will be used to better understand your perception about the usability and usefulness of the tool (interactive map in the horizontal surface) utilized in the activity. In addition, summarized data will be used in scientific articles to be published. Please complete this survey before you leave.
Thank you for your participation!
Part 3: About you
22. Fill in your gender:
◻ Female ◻ Male ◻ Prefer not to say
23. Age group:
◻ 18–30 years ◻ 31–50 years ◻ 51–65 years ◻ > 65 years
24. Select your highest completed educational level:
◻ Primary School ◻ High School ◻ Bachelor ◻ MSc ◻ PhD
25. Have you participated in a group mapping activity?
◻ Never ◻ 1–2 times ◻ 3–5 times ◻ More than five times