
 ?Mathematical formulae have been encoded as MathML and are displayed in this HTML version using MathJax in order to improve their display. Uncheck the box to turn MathJax off. This feature requires Javascript. Click on a formula to zoom.
ABSTRACT
Purpose: We studied the expression of urotensin II (UII) and its relationships with markers of pyroptosis in preeclampsia.
Methods: 48 pregnant subjects were recruited consisting of 28 severe preeclampsia pregnancies (SPE) and 20 healthy pregnancies. We detected expressions of UII and markers of pyroptosis such as NLR-family pyrin domain (PYD)-containing 3 (NLRP-3), caspase-1/4/5, interleukin-1β (IL-1β), and gasdermin D (GSDMD) in placentas of patients with SPE and healthy pregnancies.
Results: SPE group have higher expression of UII and NLRP-3, caspase-1, interleukin-1β (IL-1β), and GSDMD than that normal controls by IHC, real-time PCR, and western blot. IHC analysis manifests that the expressions of UII and pyroptosis-related molecules are mainly located in the placental cytotrophoblasts. Expressions of UII mRNA and protein are significantly positively correlated with pyroptosis marker such as NLRP3, caspase-1, GSDMD mRNA and protein by Pearson correlation analysis. Moreover, UII, NLRP-3, caspase-1, interleukin-1β (IL-1β), and GSDMD are positively related with systolic blood pressure, meanwhile caspase-1 and GSDMD are positively correlated with urine protein in SPE patients. We firstly verify that UII has a positive correlation with pyroptosis markers in placentas of preeclampsia patients; besides, pyroptosis-related proteins are positively correlated with systolic blood pressure and urine protein in patients with severe preeclampsia.
KEYWORDS:
Introduction
Preeclampsia (PE) is defined as increased blood pressure and proteinuria occurring after 20 weeks of gestation, which is a severe complication of pregnancy. It affects nearly 3–5% of pregnancies worldwide. PE is the leading cause of prematurity and fetal growth restriction, as well as maternal morbidity and mortality (Citation1–3). The pathogenesis of PE is complex and unclear. The current theory states that PE is caused by impaired trophoblast invasion, defective vascular remodeling of spiral arteries, and poorly perfused placenta. As a result, there are elevations in oxidative stress and inflammatory imbalance (Citation4–6).
Recent studies have shown that pyroptosis in the placenta was associated with PE (Citation7–9). Pyroptosis, a form of programmed cell death triggered by microbial infection and noninfectious stimuli, is characterized by the release of proinflammatory cytokines (Citation10,Citation11). It is divided into two classes: the caspase-1-dependent pathway (also known as the canonical pathway) that responds to various kinds of stimuli, and the non-canonical pathway that relies on caspase-4/5 in human (caspase-11 in mouse) and mainly responds to gram-negative bacteria invasion. For the canonical pathway, an inflammasome, a stimulant, triggers sensors first. The NLR-family pyrin domain (PYD)-containing 3 (NLRP-3) is a well-studied inflammasome sensor that responds to microbes or aseptic inflammation (Citation12). Both the canonical pathway and non-canonical pathway can generate activation of gasdermin D (GSDMD). Cleaved GSDMD can cause membrane pore formation, plasma membrane rupture, cell lyses, the release of cellular contents and cytokines such as interleukin 1-beta (IL-1β) and IL-18 (Citation13–19).
Cheng (Citation20) et al. reported that endoplasmic reticulum stress (ER stress) can activate NLRP3 by activating thioredoxin-interacting protein in hypoxia-treated trophoblasts in preeclampsia.
Urotensin II is a vasoactive substance which is widely expressed in the placentas as well as other organs, such as kidney, small intestine, prostate et al. UII possesses the most potent endogenous vasoconstrictor discovered up to now. Our previous study (Citation21) found that the expressions of UII and ER stress markers (GRP78 and CHOP) were significantly higher in patients with severe preeclampsia than that of normal controls. Moreover, UII expression was positively correlated with markers of ER stress. Moreover, UII is an inflammatory cytokine (Citation22), so we hypothesize that UII may possess the potential to induce placental pyroptosis and amplify inflammation in severe preeclampsia.
In the current study, we studied relationships between UII expression and pyroptosis markers in the placentas in PE patients.
Materials and methods
Study subjects
Forty-eight pregnant subjects were recruited, including 20 health pregnancies and 28 severe preeclamptic pregnancies from April 2020 to Aug 2020 in Obstetric wards in Xuanwu Hospital Capital Medical University. The preeclamptic criteria were according to the American College of Obstetricians and Gynecologists guidelines. Definition of severe preeclampsia (one or more of following): SBP ≥ 160 mmHg or DBP ≥ 110 mmHg on two occasions 6 or more hours apart in a pregnant woman on bed rest, proteinuria with excretion >2 g in 24 hour urine, oliguria, with less than 500 mL over 24 hours, pulmonary edema or cyanosis, impairment of liver function, visual or cerebral disturbances, pain in epigastric area or right upper quadrant, thrombocytopenia, intrauterine growth restriction.
The inclusive criteria of preeclamptic patients were that patients must have pregnant-induced hypertension and proteinuria, with a living fetus. The exclusive criteria in preeclamptic group were pregnancies with infection, twin pregnancies, cancer, diabetes mellitus, chronic liver disease, chronic kidney disease, and chronic heart disease.
The control group was chosen at the same time admission for delivery in our hospital and exclusive criteria for normal control were patients with hypertension, diabetes mellitus, primary liver disease, chronic kidney disease, or other diseases.
The way of delivery in normal control group was natural labor and only three participants have done cesarean birth for scarred uterus and all the preeclampsia patients have done cesarean birth. Patients’ clinical data such as age, gestational age, height, body weight, etc., were collected. Body mass indices (BMI) were calculated by weight divided by squared height before gestation. Blood pressure of all participants was measured by qualified physicians or nurses. The clinical and lab test parameters of the participants were collected and supplied in . Placentas were obtained from control pregnancies and SPE patients, and were stored in liquid nitrogen. Consent forms were obtained. Ethical approval was obtained from the Xuanwu Hospital Capital Medical University Human Research Ethics Committee.
Table 1. Comparison of clinical parameters between severe preeclampsia patients and normal controls
Antibodies
Anti-IL-1β antibody (ab106015), anti-caspase-4 antibody (ab25898), anti-caspase-5 antibody (ab40887), anti-GSDMD antibody – C-terminal (ab228824), and anti-Urotensin II antibody-C-terminal (ab194676) were purchased from Abcam (UK, London, Abcam) used for western blot, IF and IHC methods. Anti-caspase-1 antibody (D7F10) was obtained from Cell Signaling Technology (US, Trask Lane Danvers, CST) and was used in western blot, IF, and IHC. Anti-NLRP-3 antibody (Beijing, China, Wanleibio) was used in IHC and IF, and anti-NLRP-3 antibody (ab91413) was obtained from Abcam for western blot.
Real-time quantitative PCR Detecting System (qPCR)
Total RNA was extracted from placental tissues with Trizol (Keygen, China). 0.2 ug of total RNA was reverse-transcribed using FastKing RT Kit with gDNase (Tiangen, China). Quantitative PCR was performed in a 20 μL reaction system containing specific primers and Super Real PreMix Plus (SYBR Green) (Tiangen, China) on the Quant Studio 5 Real-Time PCR System (Thermo Fisher Scientific, USA). All samples were analyzed in triplicate. Relative expression levels of transcripts of interest were calculated using the comparative Ct(ΔΔCT) method with β-actin as housekeeping gene.
Primer sequences are as follows,
Western blot analysis
Placenta tissues were washed with PBS and ground under RIPA containing protease inhibitors (Applygen, China). Forty-five micrograms of placental lysates were loaded on 15% SDS-PAGE gel before being transferred to nitrocellulose membranes (Millipore, USA). After blocked in 5% bovine serum albumin (BSA) (AMRESCO Inc., OH, USA) for 1 hour, membranes were incubated overnight at 4°C with anti-IL1 beta antibody (1:500), anti-caspase-1 antibody (1:1000), anti-caspase-4 antibody (1:1000), anti-caspase-5 antibody (1:1000), anti-NLRP-3 antibody (1:200), anti-GSDMD antibody – C-terminal (1:1000) and anti-urotensin II antibody-C-terminal (1:1000) respectively, and then washed by TBST for 3 times. After being incubated by second antibody (zsbio, China), membranes were visualized using Immobilon Western Chemiluminescent HRP Substrate (Millipore, USA). β-actin was used as the loading control. Semi-quantitative grayscale intensity was measured by image J. (NIH, USA).
Immunohistochemical assays
Immunohistochemical (IHC) methods were applied for detecting IL-1β, caspase-1, caspase-4, caspase-5, NLRP-3, and GSDMD expression of paraffin-embedded placentas in severe 28 preeclamptic patients and 20 healthy pregnancies. The fixed placentas were sectioned at a thickness of 5 μm, then incubated by 3% hydrogen peroxide to remove endogenous peroxidase. After being washed for 5 times, tissue slices were then incubated with primary antibodies of IL-1β (1:200), caspase-1 (1:50), caspase-4 (1:100), caspase-5 (1:100), NLRP-3 (1:200), GSDMD (1:50), UII (1:200) at 4°C overnight, followed with the second antibody (zsbio, China) for 30 min. 3, 3′-diaminobenzidine staining was visualized under 200× high-power microscope fields. Area% stained with 3, 3′-diaminobenzidine was calculated by Image J (NIH, USA). We used the method of average positive stained area percentage (% area) to evaluate the immunohistochemistry results for UII, Caspase1, 4, 5, NLRP3, IL-1β, GSDMD in placentas in normal controls and SPE patients.
Immunofluorescence assays
Before immunofluorescence (IF), dewaxed and rehydrated sections were subjected to antigen retrieval with high-pressure steam treatment. After blocked in 5% bovine serum albumin (BSA) (AMRESCO Inc., OH, USA) for 30 minutes, slices were incubated with primary antibodies of IL-1β (1:200), caspase-1 (1:50), caspase-4 (1:100), caspase-5 (1:100), NLRP-3 (1:200), GSDMD (1:50), and UII (1:100) at 4°C overnight. Then, tissue sections were incubated with the second antibody combined PE or FITC for 30 minutes. DAPI identified the nucleus. The positive cell was visualized under 300× fluorescence microscope fields (Leica, DM3000).
Terminal deoxynucleotidyl transferase biotin-dUTP nick end labeling assays
Terminal deoxynucleotidyl transferase biotin-dUTP nick end labeling (TUNEL) was applied in 5 μm sections to detect DNA fragmentations. Dead End Fluorometric TUNEL System kit (promage, USA) was used according to the supplier’s instruction: sections were dewaxed and rehydrated, and then were digested with proteinase-K for 15 minutes. After being washed for two times, sections were incubated with equilibration buffer for 5 minutes. Then, tissue slices were incubated with 50 μL nucleotide mix (45 μLequilibration buffer + 5 μL nucleotide) and 1 μL recombinant terminal deoxynucleotidyl transferase (rTdT) enzyme at 37°C for 60 minutes. Later, sections soaked for 15 minutes in 2× SCC. Nuclei were stained by DAPI. The dead cell was visualized and calculated under 300× fluorescence microscope fields (Leica, DM3000).
Statistical analysis
Data are presented as mean ± standard deviation (SD) and non-normal distributed data are presented as medium (max and min values). Independent-samples t test was applied for normal distribution or Mann–Whitney U test was performed to test the difference for non-normal distribution in statistical analysis. Pearson correlation coefficients or spearman correlation were calculated to evaluate the relationship between the expression of UII, blood pressure, or urinary protein excretion parameters and pyroptosis markers. The data were analyzed by using the statistical package spss 17.0 (SPSS, Inc., Chicago, IL, USA). A two-sided P < .05 was considered statistically significant.
Results
Clinical characteristics of pregnancies
The clinical characteristics of all pregnancies are summarized in . Compared to normal controls, SPE patients had shorter gestation, higher systolic blood pressures (SBP) and diastolic blood pressures (DBP), and higher levels of blood urea nitrogen (BUN), creatinine (Cr) and uric acid (UA). They also showed significantly higher urinary protein levels (P < .001 compared with normal controls). There were no differences in terms of age and white blood cell (WBC) counts levels.
UII was upregulated in the placenta tissues of SPE
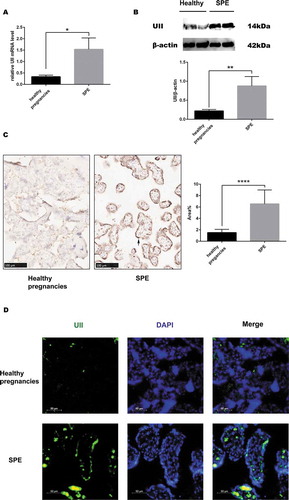
Compared with the control group, the SPE group showed significantly higher UII mRNA levels (). Western blot analysis confirmed that UII levels were significantly higher in SPE patients (). Using IHC and IF stain, we demonstrated that UII was mainly located in placental trophoblastic cells (, ).
Figure 1. The expression of UII in placenta tissues. (a). UII mRNA levels in healthy pregnancies and SPE. (b). UII protein expression in healthy pregnancies and SPE. (c). Expression of UII in placenta tissues measured by immunochemistry. Expression of UII in SPE was significantly greater than that in healthy pregnancies and was mainly located in trophoblastic cells (black arrow). Area% was substantially greater in SPE (n = 20 in the control and n = 28 in the SPE) (d). Immunofluorimetry was used to detect the expression of UII. (*P < .05, **P < .01, ****P < .0001 vs. Healthy pregnancy)
Comparison of expression of pyroptosis markers caspase-1, caspase4/5, NLRP3, IL-1β and GSDMD in placentas between SPE and control pregnancy
Real-time PCR revealed significantly greater mRNA levels of caspase-1, IL-1β, NLRP3, and GSDMD in SPE patients (). Caspase-4 and caspase-5 mRNA levels were not significantly greater in the SPE group (,). We then measured protein levels using western blot, and found the results consistent with those of real-time PCR except that expression of IL-1β was not significantly increased in SPE group in comparison to NC group.
Figure 2. Comparison of the expression of pyroptosis mRNA between SPE and healthy pregnancies analyzed by real-time PCR. (a). caspase-1. (b). NLRP3. (c). IL-1β. (d). GSDMD. (e). Caspase-4. (f). Caspase-5. (*P < .05, **P < .01, ***P < .001 vs. Healthy pregnancy)
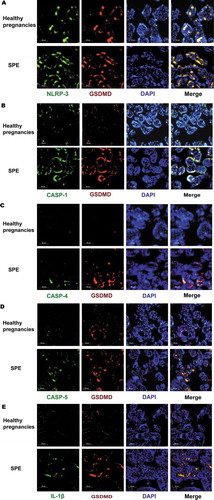
(). The locations of NLRP-3, caspase-1/4/5, and its downstream signal molecules (including IL-1 and GSDMD) were determined using IHC by calculating average positive stained area percentage (% area). These proteins were located in trophoblast cells, as was UII. The expression levels were similar to the mRNA results. There were no differences in caspase-4 and caspase-5 between patients with severe preeclampsia and the normal control group, while caspase-1, IL-1β, NLRP3, and GSDMD were significantly higher in SPE (). Double IF staining was used to co-localize upstream proteins, such as NLRP-3, caspase-1, and GSDMD, and all of them were located in trophoblastic cells. Moreover, NLRP-3, caspase-1, and the downstream signal protein IL-1β were the same location with GSDMD ().
Figure 3. Comparison of the expression of pyroptosis protein between SPE and healthy pregnancies analyzed by western blot. (a). The expression of proteins by western blot. (b). Caspase-4. (c). GSDMD. (d). Caspase-1. (e). NLRP-3. (f). Caspase-5. (g). IL-1β. (***P < .001, ****P < .0001 vs. Healthy pregnancy)
Figure 4. Comparison of the expression of pyroptosis protein between SPE and healthy pregnancies analyzed by immunochemistry (IHC). NLRP-3, caspase-5, caspase-1, caspase-4, GSDMD and IL-1β all were mainly located in trophoblastic cells.(***P < .001, ****P < .0001 vs. Healthy pregnancy)
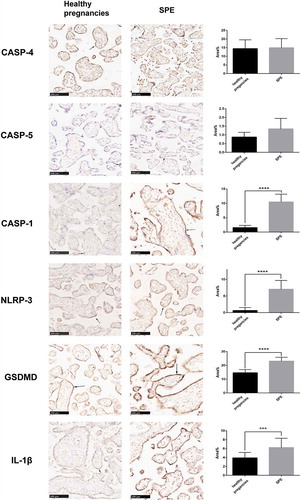
Figure 5. The expression of pyroptosis markers in placenta tissues measured by immunofluorimetry. NLRP-3, caspase-1/4/5 and their downstream signal protein IL-1β were the same location with GSDMD
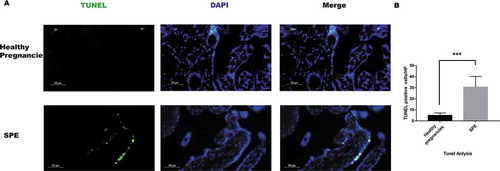
Moreover, DNA breaks were detected by TUNEL assay, and our data showed dead cells were increased in SPE patients ().
Figure 6. Dead cells detected using TUNEL in placenta tissues. (a). Dead cells detected by TUNEL methods in placenta tissues. Dead cells were green, the nucleus was blue. (b). Analysis of TUNEL positive cells in placentas. There were more dead cell in SPE group in comparison to health pregnancies by TUNEL method. (***P < .001 vs. Healthy pregnancy)
Correlation of UII and pyroptosis markers expression (mRNA and protein level) with clinical parameters by IHC or real-time PCR in SPE group
ICH analysis revealed that UII protein expression (presented by average positive stain area percentage, area % value) was positively correlated with SBP (R = 0.730, P = .001), DBP (R = 0.749, P < .001), 24 hours urinary protein excretion (R = 0.658, P = .039) and WBC levels (R = 0.495, P = .031) in SPE patients (). UII protein expression was positively correlated with caspase-1 (R = 0.699 P = .023), NLRP3 (R = 0.745, P = .001), GSDMD (R = 0.667, P = .027). Moreover, casepase-1 protein expression had positive correlation with SBP (R = 0.587, P = .015) and 24 hours protein excretion (R = 0.486, P = .017). NLRP3 protein expression was positively correlated with SBP expression (R = 0.752, P = .001) and DBP (R = 0.450, P = .053). GSDMD was positively correlated with SBP (R = 0.784, P = .039), DBP (R = 0.623, P = .017) and 24 hours urinary protein excretion (R = 0.497, P = .032).
Table 2. The correlation of UII protein expression and pyroptosis markers protein for immunochemistry in the placenta of SPE patients and their relationships with other parameters by Pearson or Spearman correlation analysis
Similar results were verified using real-time PCR. UII mRNA expression had positive relationship with SBP (R = 0.916, P = .029), DBP (R = 0.977, P = .004) and 24 hours urinary protein excretion (R = 0.73, P = .012) in SPE group (). UII mRNA was positively correlated with mRNA expression of pyroptosis markers such as caspase-1 (R = 0.469, P = .034), NLRP3 (R = 0.936, P = .0001), and GSDMD (R = 0.538, P = .015). Moreover, casepase-1 mRNA and NLRP3 were, respectively, positively correlated with SBP (R = 0.741, P = .019; R = 0.732, P = .039). GSDMD had positive correlation with SBP (R = 0.723, P = .043) and 24 housr protein excretion (R = 0.806, P = .012).
Table 3. The correlation of UII mRNA expression and pyroptosis markers mRNA for real-time PCR in the placenta of SPE patients and their relationships with other parameters
Discussion
Pyroptosis was first demonstrated as a programmed cell death mode that is triggered by inflammasome-mediated caspase-1 activation in response to the infection of pathogens in innate immune cells, such as monocytes and macrophages (Citation18,Citation19). However, recently growing evidences have verified that pyroptosis also elicits sterile inflammation in nonimmune cells in response to endogenous danger signals (Citation17).
Matias ML et al. (Citation23) observed that levels of caspase-1 and IL-1β, both of which were pyroptosis markers, were upregulated in preeclampsia. Matias assumed caspase-1 was increased because of uric acid, crystals of which potently enable inflammasome assembly. C Weel I et al. (Citation8) obtained placenta tissues from 20 preeclampsia patients, and noted similar results. In our current study, we found that the expression of NLRP3, caspase-1, GSDMD, and IL-1β were significantly upregulated in the SPE group. These outcomes were consistent with those studies (Citation23,Citation24). Taken together, these data suggested that pyroptosis occurred in pregnancies complicated by preeclampsia. In our current study, although we have demonstrated that serum uric acid was significantly higher in SPE group than that of health control group, we couldn’t verify that marker of pyroptosis such as caspase-1, NLRP3 and IL-1β had correlations with serum uric acid level.
We also found caspase-4 and 5 were not significantly upregulated in severe preeclampsia.
Our study firstly demonstrated that markers of pyroptosis such as NLRP3, caspase-1, and GSDMD expression in placentas of pregnancies by IHC or real-time PCR were positively correlated with blood pressure. It might result from placentas trophoblast and endothelial cell over inflammation which affected trophoblast invasion and consequently regulated blood pressure by placentas releasing active vascular substances, on the other hand, placenta endothelial cell induced vascular remodeling and vascular constricting, and then also increased blood pressure.
We also firstly found that pyroptosis-related molecules such as caspase-1 and GSDMD were positively correlated with urine protein excretion in patients with severe preeclampsia. Cheng et al. (Citation25) reported that the expression pyroptosis markers caspase-11, GSDMD, and cleaved N-gasdermin D (GSDMD-N) in podocytes were significantly increased, accompanied by decreased expression of podocyte markers nephrin and podocin, loss and fusion in podocyte foot processes, increased inflammatory cytokines NF-κB, IL-1β, and IL-18, macrophage infiltration, glomerular matrix expansion and increased urinary albumin. All these changes in diabetic mice were attenuated by knockout of caspase-11 or GSDMD. Two reasons might account for our current results. On the one hand, placenta pyroptosis could induce progressive preeclampsia, and consequently, placentas tissue released some inflammatory cytokines or some active substances to circulation which induced the injury of glomeruli endothelial and increased proteinuria. Second, we also found placenta UII expression was positively correlated with proteinuria. We speculated under hypoxia, placenta UII upregulated and UII had a harmful effect in preeclampsia (consisting of preeclampsia kidney lesion) through enhancing pyroptosis of trophoblast. Next step, we need to elucidate that whether UII induce pyroptosis of trophoblast in vitro study and animal experiment.
In our current study, we first demonstrated that UII expression was positively correlated with the expression of NLRP3, caspase-1 and it was also positively correlated with the expression of GSDMD which is downstream molecular of caspase-1 and NLRP3.
Our previous study demonstrated UII expression had a positive correlation with ER stress markers GRP78 and CHOP, blood pressure (Citation21). Elevated Ca2+ concentration could induce activation of NLRP3, UII could increase intracellular calcium concentration (Citation26), and Cheng et al. (Citation25) also reported that ER induced pyroptosis initiator NLRP3 upregulation. In view of these, we speculated that UII might have correlation with pyroptosis markers upregulation of placenta. In our current investigation, we first demonstrated that UII expression was positively correlated with expression of NLRP3, caspase-1 and it also had correlation with GSDMD which is downstream molecular of caspase-1 and NLRP3.
These hints that under hypoxia condition, placenta tissues release UII and UII may promote pyroptosis level of placentas, and then amplifies inflammation and aggravates preeclampsia.
There are some limitations. The sample size is small and this is a clinical cross-sectional study, and we do not explore a causative relationship between UII and pyroptosis. As a next step, we plan to elucidate whether UII induces expression of caspase-1 or caspase-4 and GSDMD in trophoblast cells in vitro and in animal studies. The SPE group had shorter gestation age compared with control group; majority of health control group have natural labor and all the preeclampsia patients have done cesarean. Gestation age and different delivery methods may be the confounding factors. But at present, there were no reports that premature birth or cesarean could affect the expression of pyroptosis-related molecules.
In conclusion, we firstly verify that UII has a positive correlation with pyroptosis markers in placentas of preeclampsia patients. Besides, pyroptosis-related proteins are positively correlated with systolic blood pressure and urine protein in patients with severe preeclampsia.
Competing interest statement
The authors declare that they have no competing financial interests.
Authors’ contribution to the Manuscript
YJ Pan: Project development, Manuscript writing
MZ Zhang: Project development, Data Collection
LH He: Data Collection
J Feng: Data Collection
AH Zhang: Project development, Manuscript writing
Additional information
Funding
References
- Shao Y, Qiu J, Huang H, Mao B, Dai W, He X, Cui H, Lin X, Lv L, Wang D, et al. Pre-pregnancy BMI, gestational weight gain and risk of preeclampsia: A birth cohort study in Lanzhou, China. BMC Pregnancy Child Birth. 2017;17:400.
- Dong X, Gou W, Li C, Wu M, Han Z, Li X, Chen Q. Proteinuria in preeclampsia: not essential to diagnosis but related to disease severity and fetal outcomes. Pregnancy Hypertens. 2017;8:60–64.
- Mol B, Roberts CT, Thangaratinam S, Magee LA, de Groot C, Hofmeyr GJ. Pre-eclampsia. Lancet. 2016;387:999–1011. doi:10.1016/S0140-6736(15)00070-7.
- Karumanchi SA, Granger JP. Preeclampsia and Pregnancy-Related hypertensive disorders. Hypertension. 2016;67:238–42. doi:10.1161/HYPERTENSIONAHA.115.05024.
- Pauli JM, Repke JT. Preeclampsia: short-term and long-term implications. Obstet Gynecol Clin North Am. 2015;42:299–313. doi:10.1016/j.ogc.2015.01.007.
- Correa PJ, Palmeiro Y, Soto MJ, Ugarte C, Illanes SE. Etiopathogenesis, prediction, and prevention of preeclampsia. Hypertens Pregnancy. 2016;35:280–94. doi:10.1080/10641955.2016.1181180.
- Kohli S, Ranjan S, Hoffmann J, Kashif M, Daniel EA, Al-Dabet MM. Maternal extracellular vesicles and platelets promote preeclampsia via inflammasome activation in trophoblasts. Blood. 2016;128:2153–64. doi:10.1182/blood-2016-03-705434.
- Weel IC, Romao-Veiga M, Matias ML, Fioratti EG, Peracoli JC, Borges V. Increased expression of NLRP3 inflammasome in placentas from pregnant women with severe preeclampsia. J Reprod Immunol. 2017;123:40–47. doi:10.1016/j.jri.2017.09.002.
- Brien ME, Duval C, Palacios J, Boufaied I, Hudon-Thibeault AA, Nadeau-Vallee M, Vaillancourt C, Sibley CP, Abrahams VM, Jones RL, et al. Uric acid crystals induce placental inflammation and alter trophoblast function via an IL-1-Dependent pathway: implications for fetal growth restriction. J Immunol. 2017;198:443–51.
- Kearney CJ, Martin SJ. An Inflammatory Perspective on Necroptosis. Mol Cell. 2017;65:965–73. doi:10.1016/j.molcel.2017.02.024.
- Bergsbaken T, Fink SL, Cookson BT. Pyroptosis: host cell death and inflammation. Nat Rev Microbiol. 2009;7:99–109. doi:10.1038/nrmicro2070.
- Gaidt MM, Hornung V. Alternative inflammasome activation enables IL-1beta release from living cells. Curr Opin Immunol. 2017;44:7–13. doi:10.1016/j.coi.2016.10.007.
- Place DE, Kanneganti TD. Recent advances in inflammasome biology. Curr Opin Immunol. 2018;50:32–38. doi:10.1016/j.coi.2017.10.011.
- Kovacs SB, Miao EA. Gasdermins: effectors of pyroptosis. Trends Cell Biol. 2017;27:673–84. doi:10.1016/j.tcb.2017.05.005.
- Feng S, Fox D, Man SM. Mechanisms of gasdermin family members in inflammasome signaling and cell death. J Mol Biol. 2018;430:3068–80. doi:10.1016/j.jmb.2018.07.002.
- Malik A, Kanneganti TD. Inflammasome activation and assembly at a glance. J Cell Sci. 2017;130:3955–63. doi:10.1242/jcs.207365.
- Zhaolin Z, Guohua L, Shiyuan W, Zuo W. Role of pyroptosis in cardiovascular disease. Cell Prolif. 2019;52:e12563. doi:10.1111/cpr.12563.
- Lamkanfi M, Dixit VM. Mechanisms and functions of inflammasomes. Cell. 2014;157:1013–22. doi:10.1016/j.cell.2014.04.007.
- Rathinam V, Zhao Y, Shao F. Innate immunity to intracellular LPS. Nat Immunol. 2019;20:527–33. doi:10.1038/s41590-019-0368-3.
- Cheng SB, Nakashima K, Huber WJ, Davis S, Banerjee S, Huang ZP, Saito S, Sadovsky Y, Sharma S. Pyroptosis is a critical inflammatory pathway in the placenta from early onset preeclampsia and in human trophoblasts exposed to hypoxia and endoplasmic reticulum stressors. Cell Death Dis. 2019;10:927. doi:10.1038/s41419-019-2162-4.
- He WY, Chen GJ, Lai X, Wu F, Tang CS, Zhang AH. Expression levels of urotensin II are associated with endoplasmic reticulum stress in patients with severe preeclampsia. J Hum Hypertens. 2016;30:129–35. doi:10.1038/jhh.2015.28.
- Sun SL, Liu LM. Urotensin II: an inflammatory cytokine. J Endocrinol. 2019. doi:10.1530/JOE-18-0505.
- Matias ML, Romao M, Weel IC, Ribeiro VR, Nunes PR, Borges VT, Araújo JP, Peraçoli JC, de Oliveira L, Peraçoli MT, et al. Endogenous and uric Acid-Induced activation of NLRP3 inflammasome in pregnant women with preeclampsia. PLoS One. 2015;10:e129095.
- Stodle GS, Silva GB, Tangeras LH, Gierman LM, Nervik I, Dahlberg UE, Sun C, Aune MH, Thomsen LCV, Bjørge L, et al. Placental inflammation in pre-eclampsia by Nod-like receptor protein (NLRP)3 inflammasome activation in trophoblasts. Clin Exp Immunol. 2018;193:84–94.
- Cheng Q, Pan J, Zhou ZL, Yin F, Xie HF, Chen PP, Li JY, Zheng PQ, Zhou L, Zhang W, et al. Caspase-11/4 and gasdermin D-mediated pyroptosis contributes to podocyte injury in mouse diabetic nephropathy. Acta Pharmacol Sin. 2020: 1–10. doi:10.1038/s41401-020-00525-z.
- Murakami T, Ockinger J, Yu JJ, Byles V, McColl A, Hofer AM, Horng T.Critical role for calcium mobilization in activation of the NLRP3 inflammasome. Proc Natl Acad Sci. 2012;109(28):11282–87. doi:10.1073/pnas.1117765109.