 ?Mathematical formulae have been encoded as MathML and are displayed in this HTML version using MathJax in order to improve their display. Uncheck the box to turn MathJax off. This feature requires Javascript. Click on a formula to zoom.
Abstract
Fourier transform infrared (FTIR) spectroscopy has been extensively used in microplastic (MP) pollution research since 2004. The aim of this review is to discuss and highlight the recent advances in FTIR (spectroscopy and chemical imaging) techniques that are used to characterize various polymer types of MPs and to trace their fate and transport in different environmental matrices. More than 400 research papers dealing with FTIR techniques in MP pollution research, which are published between January 2010 and December 2019, have been identified from the Scopus and Web of Science databases. The MPs present in sediment, water (marine and freshwater), biota, air/dust, waste water treatment plants and salt are further classified according to (1) characterization and identification, (2) weathering and aging, (3) ecotoxicology, and (4) analytical methods. The results revealed that the ATR-FTIR technique is mostly used to identify and characterize the MPs found in water and sediment. The µFTIR (FTIR imaging) is extensively used to study the ingestion of MPs in biota (both marine and freshwater). In this article, we have summarized the current knowledge of application of FTIR spectroscopy to MP research and provided insights to future challenges for understanding the risk of MPs.
Graphical Abstract

Keywords:
1. Introduction
Microplastic (MP) contamination in water (both marine and fresh water) (Gago et al., Citation2016; Koelmans et al., Citation2019), sediment (Cauwenberghe et al., Citation2015; Xu, Liu, et al., Citation2019), air (Zhang et al., Citation2020), salt (Peixoto et al., Citation2019), biota (Rezania et al., Citation2018; O'Connor et al., Citation2020; Markic et al., Citation2020), wastewater treatment plant (Sun, Dai, et al., Citation2019) and honey (Muhlschlegel et al., Citation2017) has aroused as a major global environmental and economic issue. The term “microplastics” was first coined by Thompson (Thompson et al., Citation2004) in 2004 to describe the small size (less than 5 mm in size) plastic particles in the oceans. Since then, significant amount of results has been published on this topic globally. Plastic debris in the environment is classified based on their chemical composition, solid state, solubility, size, shape, color and origin. Depending on size, plastics have been categorized as nanoplastics (1 to <1000 nm), MPs (1 to <1000 µm), mesoplastics (1 to <10 mm) and macroplastics (1 cm and larger) (Hartmann et al., Citation2019). MP consists of primary MPs, which are manufactured in microscopic size for specific purpose (including microbeads) and secondary MPs, which are formed from large plastic debris degraded and fragmented by long-term physical, chemical and biological effects in the environment (Cole et al., Citation2011; Veerasingam et al., Citation2017; Besseling et al., Citation2019).
Weathering process in MPs (both primary and secondary) is first initiated at the surface of particles, where the surface layer is discolored, oxidized, embrittled and crazed (Bond et al., Citation2018). Then, the interior weathering is proceeded by a diffusion-controlled process. MP undergoes degradation due to physical (wind wave action and mixing in-between the heavy and/or abrasive beach sediments) (Efimova et al., Citation2018; Chubarenko et al., Citation2020), chemical (UV light from solar radiation) (Andrady, Citation2011, Citation2017; Song et al., Citation2017) and biological (microorganisms) (Kooi et al., Citation2017) factors. Degradation processes of MPs are categorized as follows: photo degradation (action of light or photons, usually UV light from the sun), thermal degradation (high temperature causes molecular deterioration in laboratory condition), thermo-oxidative degradation (slow oxidative, molecular deterioration at moderate temperatures), hydrolysis (reaction with water) and biodegradation (decomposition of organic materials by microorganisms). Due to weathering process, MPs change its physical properties such as mechanical, optical or electrical characteristics in crazing, cracking, erosion, discoloration and phase separation. Degradation of MPs depends on many factors including polymer type, age, and environmental conditions such as sunlight, temperature, rain, humidity, irradiation, pH, pollutants, thermal cycles, and oxygen content (Halle et al., Citation2016; Smith et al., Citation2018). Weathering of MPs in water is much slower than that in air or on beaches, as water suppresses light-induced oxidative degradation. This can be attributed to low temperatures, low oxygen concentrations and reduced transmittance of UV irradiation in water as well as increased biofilm formation (Andrady, Citation2011, Citation2017; Bond et al., Citation2018). Due to higher rate of photo-oxidation process, plastics in the hot sand beaches degraded faster than those floating in the ocean water (Veerasingam, Mugilarasan, et al., Citation2016; Sathish et al., Citation2019).
Since the size of MPs is very small, it can be ingested by a wide range of organisms by mistake as food for prey (Botterell et al., Citation2019). MPs are not only contaminants by themselves, they are also associated with different chemical additives, which were added during their manufacturing process to optimize their physical attributes. These chemicals, including those incorporated during plastic production (additives), can leach into biological tissues, posing health risk to organisms and bio-accumulating in the food chain (Koelmans, Citation2015; Gall & Thompson, Citation2015; Galloway et al., Citation2017). Therefore, MPs have the potential to act as vectors for the transport of hydrophobic organic pollutants (Rochman, Citation2015). The vector effect of particle mediated transport of pollutants can be divided into three groups (Syberg et al., Citation2015): (1) an environmental-vector effect (MPs with adhered pollutants are transported through the environment), (2) an organismal-vector effect (the pollutant is transported into the organisms) and (3) a cellular-vector effect (the pollutant is transported with the particle into cells).
Many analytical methods have been used to identify polymeric composition of plastic debris in different aquatic environments (summarized in ). These methods are time consuming, involving laborious sample preparation, and destructive in nature. Moreover, most of these methods are limited to volatile or ionizable compounds such as small oligomeric fragments or additives within the bulk material. FTIR and Raman techniques are versatile vibrational spectroscopic methods used to characterize different types of polymers (Kappler et al., Citation2016; Jung et al., Citation2018). In fact, FTIR spectroscopy can identify all the molecular and functional groups present in plastic polymers (Bhargava et al., Citation2003; Mecozzi et al., Citation2016).
Table 1. Analytical methods for the characterization of MPs.
FTIR spectroscopy deals with measurement of infrared (IR) radiation absorbed by the MP sample, allowing the study of molecular composition. An infrared spectrum represents a fingerprint of a sample (MP) with absorption peaks correspond to the frequencies of vibration between the bonds of the atoms making up the material. Because each different polymer material is a unique combination of atoms, no two compounds produce exactly the same infrared spectrum. Therefore, the chemical structure of a polymer molecule can be determined by FTIR (Chalmers, Citation2006). The IR region of the electromagnetic spectrum is divided into three regions: (1) the higher energy near infrared (NIR) region with wavenumbers of 14,000–4000 cm−1 (0.78–2.5 µm wavelength) range, which is sensitive to overtone and combinations of vibrations, (2) the mid infrared (MIR) region with wavenumbers of 4000–400 cm−1 (2.5–30 µm wavelength) range to study the fundamental vibrations and (3) the far infrared (FIR) region with wavenumbers of 400–10 cm−1 (30–1000 µm wavelength) range to study rotations (Mukherjee & Gowen, Citation2015). Among these three IR spectral regions, MIR is the most common region in the field of MP characterization. FTIR spectroscopy can be used to study the solid, liquid and gaseous samples. Since MPs are generally solid samples, we will focus our discussion on these materials. FTIR spectra of different polymers are covered in this review to illustrate the key features involved in spectral interpretation and its application for the analysis of MPs.
The objectives of this article are (1) to critically review the work of identification of MPs using FTIR technique in various environmental matrices, (2) to highlight the suitable evaluation and data processing methods for MPs identification based on FTIR measurements, and (3) to look at the current limitations in the methods and analyses, and how do we improve and harmonize the practices for future studies of MPs using FTIR measurements.
2. Data collection
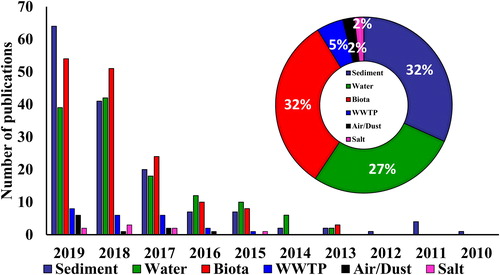
A comprehensive literature search was conducted using a combination of keywords including “microplastic,” “microplastics,” “plastic,” “FTIR,” “sediment,” “water,” “waste water treatment plant,” “atmosphere,” “dust,” “biota,” “ingestion,” “salt” in Scopus and Web of Science database. The retrieved articles were screened, and only those studies carried out with FTIR technique were selected. This has resulted into 412 research articles, published between January 2010 and December 2019, and these were taken-up for detailed review. These research articles are categorized according to the topics of investigation: (1) characterization and identification, (2) weathering and aging, (3) ecotoxicology, and (4) analytical methods and future challenges. The statistics show that the number of publications pertaining to MP studies using FTIR technique has increased rapidly in the last 5 years ().
Figure 1. Literature search results on microplastics using FTIR displayed as the number of publications from January 2010 to December 2019. The published papers were further classified into various environmental matrices (sediment, water, waste water treatment plants, biota, dust/air, and salt).
3. Characterization and identification
Characterization and identification of different polymer types of MPs found in a sample are important as each polymer has its own impacts on the biosphere. MP pollution has been studied in various environmental matrices (sediment, water, biota, salt and air/dust) using FTIR technique around the world (). However, only few studies have been carried out using FTIR technique so far to assess the MPs in air (dust) samples. Most frequently obtained shapes of MPs are fibers, fragments, films, foams, microbeads and pellets. Abundance of secondary MPs is higher (fragments, fibers, and foams) than the primary MPs (microbeads and pellets). MPs collected from various environmental matrices might be linked with different organic pollutants, and that may affect the identification of their polymer types. Therefore, purification of MPs is the key to instrumental analysis. Various digestion methods including oxidant digestion (reagent: 30% H2O2/35% H2O2/5% NaCIO), acid digestion (reagent: 65% HNO3/37% HCl), alkaline digestion (reagent: 10 M NaOH/10% KOH) and enzymatic digestion (reagent: trypsin/proteinase K) are used for purification (Lusher et al., Citation2017). The review analysis shows that various polymer types have been covered in the studies—polyethylene (PE), polypropylene (PP), polystyrene (PS), polyamide (PA), and polyethylene terephthalate (PET). PE and PP are the dominant polymer types found in all environmental matrices. The MPs extracted from sediment, water, biota, waste water treatment plants, salt, and air (dust) are grouped into two categories after visual identification: (1) large MPs (5 mm–500 µm) and (2) small MPs (size <500 µm) (Eo et al., Citation2018; GESAMP, Citation2019; Hidalgo-Ruz et al., Citation2012; Lorenz et al., Citation2019; Olesen et al., Citation2019; Song, Hong, Jang, Han, Rani, et al., Citation2015).
Table 2. Comprehensive list of research papers dealing with microplastic analysis using FTIR, as of December 2019.
FTIR is a well recognized, rapid and quite reliable method to identify polymer types of different MPs by comparing the resulting FTIR spectra with known plastic polymers in the spectral library (). Usually, larger MPs are identified by ATR-FTIR, whereas smaller MPs (particle down to 20 µm) are characterized by μFTIR (Okoffo et al., Citation2019). Single particles with size larger than 200–300 µm are commonly presorted using visual examination before FTIR analysis (Primpke, Christiansen, et al., Citation2020). Among the research articles considered for this review, nearly 60% of studies used ATR-FTIR technique to characterize the large single particle MPs extracted from different environmental matrices () since it is a cost-efficient method and no sample preparation or complicated mathematical correction is required. Though reflection is fully nondestructive (Primpke, Christiansen, et al., Citation2020), ATR may destroy MPs due to pressure applied (Wu, Tao, et al., Citation2019). In some studies, the larger single MPs were ground with potassium bromide (KBr) for transmission measurements either by diffuse reflection or via ATR measurements (Renner et al., Citation2016). However, in these techniques, the working time per particle is high (∼3 min per particle). Aforementioned techniques require sample transport to a laboratory. In a few studies, handheld FTIR technique was used for the direct measurement of MPs in the field (Abidli et al., Citation2018; Tang et al., Citation2019). However, the handheld FTIR system is more expensive than the benchtop FTIR instruments. Handheld FTIR systems are commonly limited to characterizing the MP particles with size of 300–500 µm (Primpke, Christiansen, et al., Citation2020).
Table 3. FTIR characteristic peak assignments for various types of MPs.
Table 4. ATR-FTIR spectroscopic characterization and identification of MPs extracted from different environmental matrices in select locations.
The µ-FTIR method allows chemical imaging of larger areas of membrane filters with high resolution using focal plane array (FPA) detectors (Bergmann et al., Citation2017, Citation2019; Cincinelli et al., Citation2017; Liu, Olesen, et al., Citation2019; Mintenig et al., Citation2017; Olesen et al., Citation2019; Primpke et al., Citation2017, Citation2018, Citation2019; Primpke, Cross, et al., Citation2020; Simon et al., Citation2018; Vianello et al., Citation2019; Zarfl, Citation2019). µ-FTIR technique is extensively used for chemical imaging () of different modes—coupled with ATR (Muhlschlegel et al., Citation2017; Pegado et al., Citation2018; Song, Hong, Jang, Han, & Shim, Citation2015; Wagner et al., Citation2017), transmission (Compa et al., Citation2018; Ding et al., Citation2018; Frias et al., Citation2010; Kuhn, Schaafsma, et al., Citation2018; Liu, Lu, et al., Citation2018; Loder et al., Citation2015; Lourenco et al., Citation2017) and reflection (Kanhai et al., Citation2018; Lares et al., Citation2018; Phuong, Poirier, et al., Citation2018; Tagg et al., Citation2015; Vianello et al., Citation2013; Wang, Peng, et al., Citation2017). Though µFTIR imaging is an effective method for MP characterization, it needs long measurement time (often greater than 20 h) of samples of MP particles on a filter (Kappler et al., Citation2016; Loder et al., Citation2015; Primpke et al., Citation2017). Moreover, it also poses the risk of sample contamination or loss. µFTIR in reflection mode is required a good reflection property and it is less suitable for colored or small MP particles, whereas transmission mode may show total absorption for large or thick particles (Primpke, Christiansen, et al., Citation2020).
Table 5. µ-FTIR imaging characterization and identification of MPs extracted from different environmental matrices in select locations.
Automatic FTIR imaging such as FPA (focal plane array) is used for fast acquisition of several spectra within an area through one single measurement. Liu, Olesen, et al. (Citation2019) used μFTIR imaging with a 125 × 125 Mercury-Cadmium-Telluride (MCT) FPA detector (spectral resolution of 5.5 μm) to identify the polymer types of MPs. Bergmann et al. (Citation2019) applied µFTIR equipped with a FPA (64 × 64 detector elements) for scanning an area of 20 × 20 FPA (14.1 by 14.1 mm), which allowed the detection of MP particles down to 11 μm in 4.5 h. Various sophisticated softwares are used for spectral correlation analysis in MP research. Approximately, 1.8 million spectra, which take 48 hrs data analysis time using the Bruker OPUS software, and take only 4 hrs time using the siMPle software to complete the spectral correlation (Peeken et al., Citation2018; Primpke, Cross, et al., Citation2020). Though mercury cadmium telluride (MCT) detector is used in µFTIR chemical imaging of MPs, it is a time-consuming method for larger filter areas (Harrison et al., Citation2012; Vianello et al., Citation2013; Yu et al., Citation2016). Loder et al. (Citation2015) used ten filters with different materials, pore size and thickness to test their applicability for FPA based MP characterization experiment using µFTIR (both reflectance and transmittance modes). Out of eight tested filters, only two filters, viz., polycarbonate and the aluminum oxide, were suitable for FPA based µFTIR measurements of MPs. The problems of remaining six filters were their IR window range, i.e., IR transparency was either too narrow, IR characteristics had high diffractive error (reflectance mode) or absorbance values much higher than 0.5, resulting in unclear IR spectra. Small MP particles were often concentrated on various filters (e.g., aluminum oxide filters, and metal covered PC filters) (Bergmann et al., Citation2017; Loder et al., Citation2015; Mani, Primpke, et al., Citation2019; Mintenig et al., Citation2017, Citation2019; Peeken et al., Citation2018; Primpke et al., Citation2017, Citation2018, Citation2019; Primpke, Christiansen, et al., Citation2020), silicon membranes (Kappler et al., Citation2015, Citation2016), slides (Kunz et al., Citation2016; Wagner et al., Citation2017), compression cells (Cai et al., Citation2019; Frias et al., Citation2014) and windows made of infrared transparent or reflective materials (Loder et al., Citation2015; Pham et al., Citation2017; Primpke, Christiansen, et al., Citation2020). The cost of aluminum oxide filter is cheaper than other filters (Bergmann et al., Citation2017; Mani, Primpke, et al., Citation2019; Mintenig et al., Citation2017, Citation2019; Primpke et al., Citation2017, Citation2018, Citation2019). However, the aluminum oxide filters have wavenumber limitation toward 3600–1250 cm−1 compared to other filters (FPA: 3600–900 cm−1 and even lowest for MCT (Primpke, Christiansen, et al., 2017, Citation2020). However, characterization of MPs using FTIR measurements cannot be performed in the presence of water as its spectrum will overlay the target spectra (Primpke, Christiansen, et al., Citation2020; Primpke, Cross, et al., Citation2020).
Within a FTIR spectrum of MP, not every spectral region contains relevant information (Renner, Nellessen, et al., Citation2019). Therefore, the spectrum can be reduced to a more compact and highly characteristic sub-spectrum, which can increase the selectivity of library searching (Hendrickson et al., Citation2018; Kappler et al., Citation2015; Kroon, Motti, Talbot, et al., Citation2018; Renner et al., Citation2017). Usually, FTIR spectra of MPs can be divided into three regions: 4000–2750, 2750–1850, and 1850–700 cm−1. Renner, Nellessen, et al. (Citation2019) found that the variance (intensity) and specificity (number of individual signals) are very high in the fingerprint region (1850–700 cm−1) (). Therefore, it is suggested that the fingerprint region is suitable for the identification of MPs, whereas the middle region (2750–1850 cm−1) is not appropriate for this purpose due to its low variance and specificity (Cabernard et al., Citation2018; Kappler et al., Citation2016). FTIR spectra for various types of polymers are shown in . These spectra have been evaluated using five different spectral ranges, such as stretching vibration of CH/CH2/CH3 groups (2980–2780 cm−1), CH2 bending vibration (1480–1400 cm−1), C = O stretching vibration (1760–1670 cm−1), C = O stretching vibration (1800–1740 cm−1) and CF2 stretching vibration (1174–1087 cm−1). FTIR spectra of unknown MPs can be effectively identified through comparing to a commercially available polymer library of known recorded spectra of polymers (Renner, Nellessen, et al., Citation2019).
4. Weathering and aging
Understanding the surface degradation of MPs in the environment increases our knowledge of the pollutant-plastic interaction. In addition, knowing the weathering of MPs is important for understanding the ecological impacts of the most common type of plastic debris. The environmental degradation of MPs via photo-, bio-, oxidative-, hydrolytic and altogether were studied using FTIR techniques by many researchers (Andrade, Fernandez-Gonzalez, et al., Citation2019; Auta et al., Citation2018; Bond et al., Citation2018; Brandon et al., Citation2016; Costa et al., Citation2018; Nazareth et al., Citation2019; Rajakumar et al., Citation2009; Ren et al., Citation2019; Tang et al., Citation2019; Tofa et al., Citation2019; von Friesen et al., Citation2019). FTIR results highlight three likely areas of weathering related changes in MPs: hydroxyl groups (broad peaks from 3100 to 3700 cm−1, centered at 3300–3400 cm−1), alkenes or carbon double bonds (1600–1680 cm−1) and carbonyls (1690–1810 cm−1). FTIR spectroscopy is used to measure the changes in chemical bond structures (carbonyl groups, hydroxyl, and carbon-oxygen) with weathering (Brandon et al., Citation2016). Carbonyl index (CI) is commonly used to measure the light induced photo-oxidation of polyethylene MPs, since it normally increases with increasing exposure time, i.e., increasing degree of photo-degradation (Endo et al., Citation2005; Veerasingam, Saha, et al., Citation2016). Carbonyl index is defined as the absorbance of carbonyl bond peaks relative to the absorbance of reference peaks (methylene bond). The carbonyl absorption bands are considered in the region 1760–1690 cm−1 and the methylene absorption bands are taken in the region 1490–1420 cm−1 (methylene scissoring peak) (Halle et al., Citation2016). Hydroxyl index (HI) is calculated as the ratio of the absorbance peak at 3340 cm−1 (3300–3400 cm−1) to the absorbance at reference peak. It is found that several reference peaks are used, including 974 and 2720 cm−1 for PP and 1465 and 2020 cm−1 for PE (Brandon et al., Citation2016). Rajakumar et al. (Citation2009) noted significant changes of HI only at the time of rapid growth of CI value. Carbon-oxygen index (COI) is measured based on the ratio between absorbance peak in the region 1000 to 1200 cm−1 and reference peak. Reference peak regions for PE and PP are 2908–2920 cm−1 and 2885–2940 cm−1, respectively. Changes in HI and COI values could be readily diagnosed by FTIR, followed by CI value (Brandon et al., Citation2016).
Recently, Andrade, Winemiller, et al. (Citation2019) found that FTIR could be used as a low-cost technique to monitor changes in different polymer types (polyamide, polypropylene and polystyrene) of MPs during oceanic aging. In polyamide MPs, the photo-oxidation and/or thermo-oxidation processes increase the intensity of 1150 cm−1 band in FTIR spectra. The IR spectrum of polypropylene MP changes substantially with weathering due to the appearance of following functional groups: 3370 and 3240 cm−1 (hydroxyl groups), 1640 cm−1 (C = O and double bonds), 1530 cm−1 (C = O ketones), 1440 cm−1 (carboxylic acids), 1140 cm−1 (alkanes), 1100 cm−1 (C–O bond), and 720 cm−1 (CH2) (Andrade, Fernandez-Gonzalez, et al., Citation2019; Tang et al., Citation2019). The FTIR spectra of weathered polystyrene MP showed spectral changes correspond to the formation of new bands at 3360–3240 cm−1 (hydroxyl group), 1640 cm−1 (double bond or C = O groups), and 1100 cm−1 (C-O bonds) (Andrade, Fernandez-Gonzalez, et al., Citation2019). The degree of crystallinity of polymer is a key variable in defining the morphological, physical and mechanical properties of the MP. Crystallinity is calculated by the method used in Stark and Matuana (Citation2004). The doublet peaks observed at 1474–1464 cm−1 and 730–720cm−1 correspond to PE crystalline content (1474 and 730 cm−1) and amorphous content (1464 and 720 cm−1), respectively. The percentage of the crystalline content, X, can be calculated using the following equation:
where Ia and Ib can be determined from the bands at either 1474 and 1464 cm−1 or 730 and 720 cm−1, respectively. Crystallinity increases when chain scission occurs in MPs. The shorter chains produced by chain scission events can crystallize more readily than the crosslinks. The chain scission affects the tie molecules, and thereby the crystallinity is decreased. Holmes et al. (Citation2014) found that the weathering process is more influenced in the absorption of trace metals by MPs than its polymer types. It is found that during the aging process, the absorbance ratio between contaminant vibrational band and polymer vibrational band is increased. However, aging of polymers is a very complex process and it is nearly impossible to estimate average duration of existence of MPs in an environmental compartment. Instead, aging extent of several MPs can be compared with one another (Renner et al., Citation2017). Wang, Zhou, et al. (2019) reported that the probable sources of major MPs can be identified based on polymer types, shape and topographic features.
5. Ecotoxicology
Globally, environmental-vector of MPs have been studied in various marine and freshwater biota, especially in fish, bivalves and birds (Anbumani & Kakkar, Citation2018; Chang et al., Citation2020; Du et al., Citation2020). Several toxicology studies (organismal-vector) including uptake of MPs and associated pollutants have been conducted in laboratories (Browne et al., Citation2013; Cole et al., Citation2013; Koelmans et al., Citation2016). Fishes and bivalves, which are used as bio-indicators to assess the health of aquatic ecosystems, are also used as the most common organisms to study ecotoxicology of MPs. The major toxic effects of MPs on biota can be categorized as follows: (1) physical toxicity, (2) chemical toxicity, (3) cellular toxicity, and (4) Toxicity due to pathogenic microbes (Bhattacharya & Khare, Citation2020). Following are the adverse effects of ingested MPs in aquatic and terrestrial organisms reported in the publications: (1) feeding activity and behavioral changes (Bour et al., Citation2018; Scherer et al., Citation2017; Wang, Mao, et al., Citation2019; Wu, Tao, et al., Citation2019), (2) inhibition of growth, reproduction and fecundity (Garrido et al., Citation2019), (3) histopathological damage and/or death (Lei et al., Citation2018), (4) Oxidative stress (Yu et al., Citation2018), (5) neurotoxicity (Barboza et al., Citation2018), (6) immune system responses (Avio et al., Citation2015), (7) changes in gene expression (Rochman et al., Citation2014, Citation2015), and (8) energy deficiency (Rodriguez-Seijo, Citation2018). Prokic et al. (Citation2019) found that in biota, MPs can have the following effects: (1) induce oxidative damage (increased lipid peroxidation and DNA strand breaks), (2) alter anti-oxidative system (superoxide dismutase, catalase and glutathione peroxidase were parameters with the highest and significant changes in activities) and metabolism (isocitrate dehydrogenase and lactate dehydrogenase activity), and (3) have neurotoxic effects (inhibition of acetylcholinesterase activity). These effects depend on size and dose of used MPs, and/or their interaction with other xenobiotics.
FTIR spectroscopic imaging (µFTIR) is found to be label-free, nondestructive chemical analysis and powerful tool for studying live biological cells (Chan & Kazarian, Citation2013; Baker et al., 2014). Recently, µ-FTIR spectroscopy was used to describe the distribution of MPs in different fish organs and the possibility of bio-accumulation in fish tissues (Su, Deng, et al., Citation2019). Sun, Chen, et al. (Citation2018) used FTIR technique to investigate the toxic effects of polystyrene nano- and micro-particles on the marine bacterium Halomonas alkaliphila. FTIR absorption bands for carbohydrate, polysaccharides, and amide were shifted to a higher wavenumber when Halomonas alkaliphila was exposed to nanoplastics, but not in MPs. Thus, the size of plastics plays an important role in the alteration of the bacterial chemical composition (Sun, Chen, et al., Citation2018). Therefore, FTIR technique is not only used to identify the polymer types of MPs ingested by biota, but also used to investigate the toxicity effects in the biota.
6. Analytical methods and future challenges
The quality, spectral contrast and quantitative precision of FTIR spectrum recorded from a MP sample depends on the choice of sample preparation method and/or sampling technique. Transmission, attenuated total reflectance, diffuse reflectance, reflectance (mapping) and reflectance (focal plane array mapping) techniques are used extensively in MP research, and every technique has its own advantages and disadvantages () depending on analytical issue and sample properties (Renner et al., Citation2016). Three steps are followed to characterize the MPs using FTIR spectra: (1) inspection of data quality, (2) evaluation of FTIR spectra to identify the corresponding MPs, and (3) identification using spectral library search—calculation of a similarity value called “Hit Quality Index” (HQI).
Table 6. Techniques and accessories used in FTIR for analysis of MPs based on their merits and demerits (modified from Renner et al., Citation2016).
Inspection of data quality has two steps—looking at the characteristic shape of the whole spectrum and characterizing individual vibrational bands. However, this inspection method requires much experience and it is very time consuming. Smoothing and baseline correction are important to improve the quality of FTIR spectra of MPs (smoothing to increase signal-to-noise ratio). The moving average and Savitzky-Golay smoothing are well established and both are useful techniques to enhance the certainty of results. The common baseline correction methods used in FTIR spectroscopy are Savitzky-Golay differentiation (based on Savitzky-Golay smoothing), rolling-circle filter, asymmetric least squares, and adaptive iteratively reweighted penalized least squares (Renner, Nellessen, et al., Citation2019).
Evaluation of FTIR spectra is the most critical step in MP analysis. Manual interpretation of relevant absorption peaks based on reference tables and comparison of complete spectra with a reference spectral library are the two common approaches in the evaluation. Manual interpretation is time consuming and requires expert knowledge, and thus, it suits only for a low throughput quantity. Spectra obtained from analysis of MPs are typically compared and matched with those of model samples from library databases. For example, in one study, the spectra matched with HQI ≥0.7 were accepted, those with HQI <0.6 were rejected and spectra with HQI = 0.6 were individually interpreted (Woodall et al., Citation2014).
FTIR spectra acquired from different modes (transmission, reflection and diffuse reflectance) are not the same (Picollo et al., Citation2014). Only a few researchers are working on this topic (Xu & Gowen, Citation2019; Xu, Thomas, et al., Citation2019), and adequate attention is not given for comparing/matching the unknown spectra with literature/spectral library. Several degradation processes in MPs cause spectral alterations relative to pristine reference library spectra. Thus, library searching could be vulnerable to misidentification of MP samples. However, most studies ignored spectral changes caused by MP degradation when comparing or matching with the reference spectral library. Therefore, it is important to improve new library searching procedures, which are more robust and can handle the problem of comparing the weathered MPs with virgin polymer references. Substrate (holding MPs) has a minimum spectral interference and can immobile the MPs especially for µ-FTIR imaging, where the stage moves during scanning (Corami et al., Citation2020; Vianello et al., Citation2013; Xu, Thomas, et al., Citation2019). Therefore, it is necessary to address the importance of appropriate substrate material for obtaining high quality results with minimum spectroscopic interference in the FTIR spectra.
In general, two approaches are followed to analyze MPs on filter materials: (1) measurement of complete filter area spot by spot (Kappler et al., Citation2016; Loder et al., Citation2015; Primpke et al., Citation2017) and (2) measurement of selected points of interest (Maes et al., Citation2017). In complete filter measurement method, the maximum number of spots are analyzed (also high analysis time) and big data sets are needed to be evaluate. However, without either FPA detector or charge-coupled device, this approach is not recommended. In the select points of interest measurement method, the number of spots (also less analysis time) is reduced, and FPA detector is not needed. But there is a risk of overlooking MP particles and also an additional step is required to define points of interest (Renner et al., Citation2020). Though the automated evaluation method demonstrated that the analysis time has decreased from several days to 4–9 h for a scanning, only recently this technique is introduced in the MP research (Chen et al., Citation2020; Primpke, Christiansen, et al., Citation2020). Therefore, further improvements are needed in constructing a reference spectrum for weathered MPs, and also reducing the analytical time. Moreover, training the classifier can increase the analysis speed substantially when dealing with large datasets of FTIR spectra. For example, automated identification methods were tested based on hierarchical cluster analysis (Primpke et al., Citation2018), shortwave infrared imaging (Schmidt et al., Citation2018), identification of the most relevant bands (Renner et al., Citation2017; Renner, Nellessen, et al., Citation2019), random decision forest method (Hufnagl et al., Citation2019), modified chemometric identification concept (Renner, Sauerbier, et al., Citation2019), machine learning method (Kedzierski et al., Citation2019), Python based μFTIR mapping (Renner et al., Citation2020) and Hybrid fusion method (Chabuka & Kalivas, Citation2020). The analysis of FTIR spectra is time-consuming as often it is needed to compare the spectra one by one with the reference spectra. Moreover, appearance of additional bands in the spectra due to aging of MPs and/or fouling present on particles is a significant part of misinterpretation. More often, the reference spectra in the spectral library are made of new and clean plastics, and there could be a possibility that MPs may not be identified successfully with the matching algorithm and spectral library of FTIR instrument. Therefore, it is mandatory to develop additional accessories to combine with FTIR techniques for the characterization of MP particles less than 10 µm size.
7. Conclusions
MPs have been identified and reported in environmental matrices from the poles to equator and from atmosphere to deep ocean. Though the usage of FTIR techniques in MP research has increased tremendously since 2004, there are still some challenges to be overcome in the area of standardizing the operational protocols for identification and quantification. Among the reviewed research articles, ATR-FTIR has been used in 60% of the studies to characterize different polymer types at various environmental matrices. Attenuated total reflectance (ATR) technique coupled with FTIR spectroscopy is widely used to characterize the large size MPs, whereas smaller MPs require the use of µFTIR coupled with detector, especially, µFTIR coupled with focal plane array detector facilitates a much faster generation of chemical imaging of MPs by simultaneously scanning several thousand spectra within a single measurement. FTIR technique is also used to study the changes in chemical bond structures (hydroxyl, carbonyl groups and carbon-oxygen) of MPs during various weathering process. Moreover, FTIR method is used to understand the ecological effects of ingested MPs and its associated pollutants and biochemical variations at the cellular level. Following criteria are needed to be considered during data processing, evaluation and identification MPs using FTIR spectroscopy: (1) when we compare/match an unknown spectrum with literature or a commercial spectral library, it is necessary to check the mode of acquisition of FTIR spectra (acquired the same mode or different modes), (2) the spectral change caused by weathering and aging, when comparing or matching with the spectral library, and (3) desirable substrate to be used to reduce the spectral interference. Standardization of chemometric techniques, decrease in data processing time, better file handling capabilities of systems are expected to improve FTIR analysis in MP pollution research. Since identification of MP particles <10 µm using FTIR technique is a challenging task, development of novel additional accessories or proper combination use of existing techniques is needed for future MP research.
Supplemental Material
Download MS Word (90.1 KB)Acknowledgements
This work was carried out under the following projects: (1) QUEX-ESC-QP-TM-18/19, funded by Qatar Petroleum through ESC, Qatar University, Qatar, (2) INT/RUS/RFBR/P-339, funded by Department of Science & Technology, India, and (3) RFBR No. 18-55-45024, funded by RFBR, Russia. Open Access funding provided by the Qatar National Library.
References
- Abayomi, O. A., Range, P., Al-Ghouti, M. A., Obbard, J. P., Almeer, S. H., & Ben-Hamadou, R. (2017). Microplastics in coastal environments of the Arabian Gulf. Marine Pollution Bulletin, 124(1), 181–188. https://doi.org/https://doi.org/10.1016/j.marpolbul.2017.07.011
- Abidli, S., Antunes, J. C., Ferreira, J. L., Lahbib, Y., Sobral, P., & Menif, N. T. E. (2018). Microplastics in sediments from the littoral zone of the north Tunisian coast (Mediterranean Sea). Estuarine Coastal and Shelf Science, 205, 1–9. https://doi.org/https://doi.org/10.1016/j.ecss.2018.03.006
- Abidli, S., Lahbib, Y., & Menif, N. T. E. (2019). Microplastics in commercial molluscs from the lagoon of Bizerte (Northern Tunisia). Marine Pollution Bulletin, 142, 243–252. https://doi.org/https://doi.org/10.1016/j.marpolbul.2019.03.048
- Acosta-Coley, I., Cuadro, D. M., Rodriguez-Cavallo, E., Rosa, J., & Olivero-Verbel, J. (2019). Trace elements in microplastics in Cartagena: A hotspot for plastic pollution at the Caribbean. Marine Pollution Bulletin, 139, 402–411. https://doi.org/https://doi.org/10.1016/j.marpolbul.2018.12.016
- Acosta-Coley, I., Duran-Izquierdo, M., Rodriguez-Cavallo, E., Mercado-Camargo, J., Mendez-Cuadro, D., & Olivero-Verbel, J. (2019). Quantification of microplastics along the Caribbean coastline of Colombia: Pollution profile and biological effects on Caenorhabditis elegans. Marine Pollution Bulletin, 146, 574–583. https://doi.org/https://doi.org/10.1016/j.marpolbul.2019.06.084
- Acosta-Coley, I., & Olivero-Verbel, J. (2015). Microplastic resin pellets on an urban tropical beach in Colombia. Environmental Monitoring and Assessment, 187(7), 435. https://doi.org/https://doi.org/10.1007/s10661-015-4602-7
- Akindele, E. O., Ehlers, S. M., & Koop, J. H. E. (2019). First empirical study of freshwater microplastics in West Africa using gastropods from Nigeria as bioindicators. Limnologica, 78, 125708. https://doi.org/https://doi.org/10.1016/j.limno.2019.125708
- Aliabad, M. K., Nassiri, M., & Kor, K. (2019). Microplastics in the surface seawaters of Chabahar Bay, Gulf of Oman (Makran coasts). Marine Pollution Bulletin, 143, 125–133. https://doi.org/https://doi.org/10.1016/j.marpolbul.2019.04.037
- Alomar, C., & Deudero, S. (2017). Evidence of microplastic ingestion in the shark Galeus melastomus Rafinesque, 1810 in the continental shelf off the western Mediterranean Sea. Environmental Pollution, 223, 223–229. https://doi.org/https://doi.org/10.1016/j.envpol.2017.01.015
- Alvarez, G., Barros, A., & Velando, A. (2018). The use of European shag pellets as indicators of microplastic fibers in the marine environment. Marine Pollution Bulletin, 137, 444–448. https://doi.org/https://doi.org/10.1016/j.marpolbul.2018.10.050
- Alvarez-Hernandez, C., Cairos, C., Lopez-Darias, J., Mazzetti, E., Hernandez-Sanchez, C., Gonzalez-Salamo, J., & Hernandez-Borges, J. (2019). Microplastic debris in beaches of Tenerife (Canary Islands, Spain). Marine Pollution Bulletin, 146, 26–32. https://doi.org/https://doi.org/10.1016/j.marpolbul.2019.05.064
- Alves, V. E. N., & Figueiredo, G. M. (2019). Microplastic in the sediments of a highly eutrophic tropical estuary. Marine Pollution Bulletin, 146, 326–335. https://doi.org/https://doi.org/10.1016/j.marpolbul.2019.06.042
- Amelineau, F., Bonnet, D., Heitz, O., Mortreux, V., Harding, A. M. A., Karnovsky, N., Walkusz, W., Fort, J., & Gremillet, D. (2016). Microplastic pollution in the Greenland Sea: Background levels and selective contamination of planktivorous diving seabirds. Environmental Pollution, 219, 1131–1139. https://doi.org/https://doi.org/10.1016/j.envpol.2016.09.017
- Anbumani, S., & Kakkar, P. (2018). Ecotoxicological effects of microplastics on biota: A review. Environmental Science and Pollution Research International, 25(15), 14373–14396. https://doi.org/https://doi.org/10.1007/s11356-018-1999-x
- Andrade, J., Fernandez-Gonzalez, V., Lopez-Mahia, P., & Muniategui, S. (2019). A low-cost system to simulate environmental microplastic weathering. Marine Pollution Bulletin, 149, 110663. https://doi.org/https://doi.org/10.1016/j.marpolbul.2019.110663
- Andrade, M. C., Winemiller, K. O., Barbosa, P. S., Fortunati, A., Chelazzi, D., Cincinelli, A., & Giarrizzo, T. (2019). First account of plastic pollution impacting freshwater fishes in the Amazon: Ingestion of plastic debris by piranhas and other serrasalmids with diverse feeding habits. Environmental Pollution, 244, 766–773. https://doi.org/https://doi.org/10.1016/j.envpol.2018.10.088
- Andrady, A. L. (2011). Microplastics in the marine environment. Marine Pollution Bulletin, 62(8), 1596–1605. https://doi.org/https://doi.org/10.1016/j.marpolbul.2011.05.030
- Andrady, A. L. (2017). The plastic in microplastics: A review. Marine Pollution Bulletin, 119(1), 12–22. https://doi.org/https://doi.org/10.1016/j.marpolbul.2017.01.082
- Antunes, J. C., Frias, J. G. L., Micaelo, A. C., & Sobral, P. (2013). Resin pellets from beaches of the Portuguese coast and adsorbed persistent organic pollutants. Estuarine Coastal and Shelf Science, 130, 62–69. https://doi.org/https://doi.org/10.1016/j.ecss.2013.06.016
- Ariza-Tarazona, M. C., Villarreal-Chiu, J. F., Barbieri, V., Siligardi, C., & Cedillo-Gonzalez, E. L. (2019). New strategy for microplastic degradation: Green photocatalysis using a protein-based porous N-TiO2 semiconductor. Ceramics International, 45(7), 9618–9624. https://doi.org/https://doi.org/10.1016/j.ceramint.2018.10.208
- Asefnejad, A., Khorasani, M. T., Behnamghader, A., Farsadzadeh, B., & Bonakdar, S. (2011). Manufacturing of biodegradable polyurethane scaffolds based on polycaprolactone using a phase separation method: Physical properties and in vitro assay. International Journal of Nanomedicine, 6, 2375–2384. https://doi.org/https://doi.org/10.2147/IJN.S15586
- Asensio, R. C., Moya, M. S. A., de la Roja, J. M., & Gomez, M. (2009). Analytical characterisation of polymers used in conservation and restoration by ATR-FTIR spectroscopy. Analytical and Bioanalytical Chemistry, 395, 2081–2096.
- Ashwini, S. K., & Varghese, G. K. (2019). Environmental forensic analysis of the microplastic pollution at “Nattika” beach, Kerala coast, India. Environmental Forensics, 21(1), 21–36.
- Atwood, E. C., Falcieri, F. M., Piehl, S., Bochow, M., Matthies, M., Franke, J., Carniel, S., Sclavo, M., Laforsch, C., & Siegert, F. (2019). Coastal accumulation of microplastic particles emitted from the Po River, Northern Italy: Comparing remote sensing and hydrodynamic modelling with in situ sample collections. Marine Pollution Bulletin, 138, 561–574. https://doi.org/https://doi.org/10.1016/j.marpolbul.2018.11.045
- Auta, H. S., Emenike, C. U., Jayanthi, B., & Fauziah, S. H. (2018). Growth kinetics and biodeterioration of polypropylene microplastics by Bacillus sp. and Rhodococcus sp. Isolated from mangrove sediment. Marine Pollution Bulletin, 127, 15–21. https://doi.org/https://doi.org/10.1016/j.marpolbul.2017.11.036
- Avery-Gomm, S., Valliant, M., Schacter, C. R., Robbins, K. F., Liboiron, M., Daoust, P.-Y., Rios, L. M., & Jones, I. L. (2016). A study of wrecked Dovekies (Alle alle) in the western North Atlantic highlights the importance of using standardized methods to quantify plastic ingestion. Marine Pollution Bulletin, 113(1–2), 75–80. https://doi.org/https://doi.org/10.1016/j.marpolbul.2016.08.062
- Avio, C. G., Cardelli, L. R., Gorbi, S., Pellegrini, D., & Regoli, F. (2017). Microplastics pollution after the removal of the Costa Concordia wreck: First evidences from a biomonitoring case study. Environmental Pollution, 227, 207–214. https://doi.org/https://doi.org/10.1016/j.envpol.2017.04.066
- Avio, C. G., Gorbi, S., & Regoli, F. (2015). Experimental development of a new protocol for extraction and characterisation of microplastics in fish tissues: First observations in commercial species from Adriatic Sea. Marine Environmental Research, 111, 18–26. https://doi.org/https://doi.org/10.1016/j.marenvres.2015.06.014
- Axworthy, J. B., & Padilla-Gamino, J. L. (2019). Microplastics ingestion and heterotrophy in thermally stressed corals. Scientific Reports, 9(1), 18193. https://doi.org/https://doi.org/10.1038/s41598-019-54698-7
- Baalkhuyur, F. M., Dohaish, E. B., Elhalwagy, M. E. A., Alikunhi, N. M., AlSuwailem, A. M., Rostad, A., Coker, D. J., Berumen, M. L., & Duarte, C. M. (2018). Microplastic in the gastrointestinal tract of fishes along the Saudi Arabian Red Sea coast. Marine Pollution Bulletin, 131(Pt A), 407–415. https://doi.org/https://doi.org/10.1016/j.marpolbul.2018.04.040
- Baini, M., Fossi, M. C., Galli, M., Caliani, I., Campani, T., Finoia, M. G., & Panti, C. (2018). Abundance and characterisation of microplastics in the coastal waters of Tuscany (Italy): The application of the MSFD monitoring protocol in the Mediterranean Sea. Marine Pollution Bulletin, 133, 543–552. https://doi.org/https://doi.org/10.1016/j.marpolbul.2018.06.016
- Baker, M. J., Trevisan, J., Bassan, P., Bhargava, R., Butler, H. J., Dorling, K. M., Fielden, P. R., Fogarty, S. W., Fullwood, N. J., Heys, K. A., Hughes, C., Lasch, P., Martin-Hirsch, P. L., Obinaju, B., Sockalingum, G. D., Sule-Suso, J., Strong, R. J., Walsh, M. J., Wood, B. R., Gardner, P., & Martin, F. L. (2014). Using Fourier transform IR spectroscopy to analyse biological materials. Nature Protocols, 9(8), 1771–1791. https://doi.org/https://doi.org/10.1038/nprot.2014.110
- Bancin, L. J., Walther, B. A., Lee, Y.-C., & Kunz, A. (2019). Two-dimensional distribution and abundance of micro- and mesoplastic pollution in the surface sediment of Xialiao beach, New Taipei City, Taiwan. Marine Pollution Bulletin, 140, 75–85. https://doi.org/https://doi.org/10.1016/j.marpolbul.2019.01.028
- Barboza, L. G. A., Vieira, L. R., Branco, V., Figueiredo, N., Carvalho, F., Carvalho, C., & Guilhermino, L. (2018). Microplastics cause neurotoxicity, oxidative damage and energy-related changes and interact with the bioaccumulation of mercury in the European seabass, Dicentrarchus labras (Linnaeus, 1758). Aquatic Toxicology, 195, 49–57. https://doi.org/https://doi.org/10.1016/j.aquatox.2017.12.008
- Barrows, A. P. W., Cathey, S. E., & Petersen, C. W. (2018). Marine environment microfiber contamination: Global patterns and the diversity of microparticle origins. Environmental Pollution, 237, 275–284. https://doi.org/https://doi.org/10.1016/j.envpol.2018.02.062
- Barrows, A. P. W., Christiansen, K. S., Bode, E. T., & Hoellein, T. J. (2018). A watershed-scale, citizen science approach to quantifying microplastic concentration in a mixed land-use river. Water Research, 147, 382–392. https://doi.org/https://doi.org/10.1016/j.watres.2018.10.013
- Battulga, B., Kawahigashi, M., & Oyuntsetseg, B. (2019). Distribution and composition of plastic debris along the river shore in the Selenga River basin in Mongolia. Environmental Science and Pollution Research International, 26(14), 14059–14072. https://doi.org/https://doi.org/10.1007/s11356-019-04632-1
- Bayo, J., Rojo, D., & Olmos, S. (2019). Abundance, morphology and chemical composition of microplastics in sand and sediments from a protected coastal area: The Mar Menor lagoon (SE Spain). Environmental Pollution, 252, 1357–1366. https://doi.org/https://doi.org/10.1016/j.envpol.2019.06.024
- Beltran, M., & Marcilla, A. (1997). Fourier transform infrared spectroscopy applied to the study of PVC decomposition. European Polymer Journal, 33(7), 1135–1142. https://doi.org/https://doi.org/10.1016/S0014-3057(97)00001-3
- Bergmann, M., Wirzberger, V., Krumpen, T., Lorenz, C., Primpke, S., Tekman, M. B., & Gerdts, G. (2017). High quantities of microplastic in Arctic deep-sea sediments from the HAUSGARTEN observatory. Environmental Science & Technology, 51(19), 11000–11010. https://doi.org/https://doi.org/10.1021/acs.est.7b03331
- Bergmann, M., Mutzel, S., Primpke, S., Tekman, M. B., Trachsel, J., & Gerdts, G. (2019). White and wonderful? Microplastics prevail in snow from the Alps to the Arctic. Science Advances, 5(8), eaax1157. https://doi.org/https://doi.org/10.1126/sciadv.aax1157
- Bernardini, I., Garibaldi, F., Canesi, L., Fossi, M. C., & Baini, M. (2018). First data on plastic ingestion by blue sharks (Prionace glauca) from the Ligurian Sea (North-Western Mediterranean Sea). Marine Pollution Bulletin, 135, 303–310. https://doi.org/https://doi.org/10.1016/j.marpolbul.2018.07.022
- Bessa, F., Barria, P., Neto, J. M., Frias, J. P. G. L., Otero, V., Sobral, P., & Marques, J. C. (2018). Occurrence of microplastics in commercial fish from a natural estuarine environment. Marine Pollution Bulletin, 128, 575–584. https://doi.org/https://doi.org/10.1016/j.marpolbul.2018.01.044
- Bessa, F., Ratcliffe, N., Otero, V., Sobral, P., Marques, J. C., Waluda, C. M., Trathan, P. N., & Xavier, J. C. (2019). Microplastics in gentoo penguins from the Antarctic region. Scientific Reports, 9(1), 14191. https://doi.org/https://doi.org/10.1038/s41598-019-50621-2
- Besseling, E., Foekema, E. M., Van Franeker, J. A., Leopold, M. F., Kühn, S., Bravo Rebolledo, E. L., Heße, E., Mielke, L., IJzer, J., Kamminga, P., & Koelmans, A. A. (2015). Microplastic in a macro filter feeder: Humpback whale Megaptera novaeangliae. Marine Pollution Bulletin, 95(1), 248–252. https://doi.org/https://doi.org/10.1016/j.marpolbul.2015.04.007
- Besseling, E., Redondo-Hasselerharm, P., Foekema, E. M., & Koelmans, A. A. (2019). Quantifying ecological risks of aquatic micro- and nanoplastic. Critical Reviews in Environmental Science and Technology, 49(1), 32–80. https://doi.org/https://doi.org/10.1080/10643389.2018.1531688
- Bhargava, R., Wang, S. Q., & Koenig, J. L. (2003). FTIR Microspectroscopy of polymeric systems. Advances in Polymer Science, 163, 137–191.
- Bhattacharya, A., & Khare, S. K. (2020). Ecological and toxicological manifestations of microplastics: Current scenario, research gaps, and possible alleviation measures. Journal of Environmental Science and Health C, 38(1), 1–20. https://doi.org/https://doi.org/10.1080/10590501.2019.1699379
- Biginagwa, F. J., Mayoma, B. S., Shashoua, Y., Syberg, K., & Khan, F. R. (2016). First evidence of microplastics in the African Great Lakes: Recovery from lake Victoria Nile perch and Nile tilapia. Journal of Great Lakes Research, 42(1), 146–149. https://doi.org/https://doi.org/10.1016/j.jglr.2015.10.012
- Birnstiel, S., Soares-Gomes, A., & Gama, B. A. P. (2019). Depuration reduces microplastic content in wild and farmed mussels. Marine Pollution Bulletin, 140, 241–247. https://doi.org/https://doi.org/10.1016/j.marpolbul.2019.01.044
- Biver, T., Bianchi, S., Carosi, M. R., Ceccarini, A., Corti, A., Manco, E., & Castelvetro, V. (2018). Selective determination of poly(styrene) and polyolefin microplastics in sandy beach sediments by gel permeation chromatography coupled with fluorescence detection. Marine Pollution Bulletin, 136, 269–275. https://doi.org/https://doi.org/10.1016/j.marpolbul.2018.09.024
- Blair, R. M., Waldron, S., & Gauchotte-Lindsay, C. (2019). Average daily flow of microplastics through a tertiary wastewater treatment plant over a ten-month period. Water Research, 163, 114909. https://doi.org/https://doi.org/10.1016/j.watres.2019.114909
- Blaskovic, A., Guerranti, C., Fastelli, P., Anselmi, S., & Renzi, M. (2018). Plastic levels in sediments closed to Cecina river estuary (Tuscany, Italy). Marine Pollution Bulletin, 135, 105–109. https://doi.org/https://doi.org/10.1016/j.marpolbul.2018.07.021
- Blettler, M. C. M., Garello, N., Ginon, L., Abrial, E., Espinola, L. A., & Wantzen, K. M. (2019). Massive plastic pollution in a mega-river of a developing country: Sediment deposition and ingestion by fish (Prochilodus lineatus). Environmental Pollution, 255, 113348. https://doi.org/https://doi.org/10.1016/j.envpol.2019.113348
- Blettler, M. C. M., & Ulla, M. A. (2019). Plastic pollution in freshwater ecosystems: Macro-, meso-, and microplastic debris in a floodplain lake. Environmental Monitoring Assessment, 189, 581.
- Blumenroder, J., Sechet, P., Kakkonen, J. E., & Hartl, M. G. J. (2017). Microplastic contamination of intertidal sediments of Scapa Flow, Orkney: A first assessment. Marine Pollution Bulletin, 124(1), 112–120. https://doi.org/https://doi.org/10.1016/j.marpolbul.2017.07.009
- Bond, T., Ferrandiz-Mas, V., Felipe-Sotelo, M., & van Sebille, E. (2018). The occurrence and degradation of aquatic plastic litter based on polymer physicochemical properties: A review. Critical Reviews in Environmental Science and Technology, 48(7–9), 685–722. https://doi.org/https://doi.org/10.1080/10643389.2018.1483155
- Botterell, Z. L. R., Beaumont, N., Dorrington, T., Steinke, M., Thompson, R. C., & Lindeque, P. K. (2019). Bioavailability and effects of microplastics on marine zooplankton: A review. Environmental Pollution, 245, 98–110. https://doi.org/https://doi.org/10.1016/j.envpol.2018.10.065
- Bour, A., Avio, C. G., Gorbi, S., Regoli, F., & Hylland, K. (2018). Presence of microplastics in benthic and epibenthic organisms: Influence of habitat, feeding mode and trophic level. Environmental Pollution, 243(Pt B), 1217–1225. https://doi.org/https://doi.org/10.1016/j.envpol.2018.09.115
- Brandon, J., Goldstein, M., & Ohman, M. D. (2016). Long-term aging and degradation of microplastic particles: Comparing in situ oceanic and experimental weathering patterns. Marine Pollution Bulletin, 110(1), 299–308. https://doi.org/https://doi.org/10.1016/j.marpolbul.2016.06.048
- Brandon, J. A., Jones, W., & Ohman, M. D. (2019). Multidecadal increase in plastic particles in coastal ocean sediments. Science Advances, 5(9), eaax0587. https://doi.org/https://doi.org/10.1126/sciadv.aax0587
- Brate, I. L. N., Blazquez, M., Brooks, S. J., & Thomas, K. V. (2018). Weathering impacts the uptake of polyethylene microparticles from toothpaste in Mediterranean mussels (M. galloprovincialis). Science of the Total Environment, 626, 1310–1318. https://doi.org/https://doi.org/10.1016/j.scitotenv.2018.01.141
- Brate, I. L. N., Eidsvoll, D. P., Steindal, C. C., & Thomas, K. V. (2016). Plastic ingestion by Atlantic cod (Gadus morhua) from the Norwegian coast. Marine Pollution Bulletin, 112(1–2), 105–110. https://doi.org/https://doi.org/10.1016/j.marpolbul.2016.08.034
- Brate, I. L. N., Hurley, R., Iversen, K., Beyer, J., Thomas, K. V., Steindal, C. C., Green, N. W., Olsen, M., & Lusher, A. (2018). Mytilus spp. as sentinels for monitoring microplastic pollution in Norwegian coastal waters: A qualitative and quantitative study. Environmental Pollution, 243, 383–393. https://doi.org/https://doi.org/10.1016/j.envpol.2018.08.077
- Browne, M. A., Niven, S. J., Galloway, T. S., Rowland, S. J., & Thompson, R. C. (2013). Microplastic moves pollutants and additives to worms, reducing functions linked to health and biodiversity. Current Biology: CB, 23(23), 2388–2392. https://doi.org/https://doi.org/10.1016/j.cub.2013.10.012
- Cabernard, L., Roscher, L., Lorenz, C., Gerdts, G., & Primpke, S. (2018). Comparison of Raman and Fourier Transform Infrared Spectroscopy for the quantification of microplastics in the Aquatic environment. Environmental Science & Technology, 52(22), 13279–13288. https://doi.org/https://doi.org/10.1021/acs.est.8b03438
- Cai, L., Wang, J., Peng, J., Tan, Z., Zhan, Z., Tan, X., & Chen, Q. (2017). Characteristic of microplastics in the atmospheric fallout from Dongguan city, China: Preliminary research and first evidence. Environmental Science and Pollution Research International, 24(32), 24928–24935. https://doi.org/https://doi.org/10.1007/s11356-017-0116-x
- Cai, M., He, H., Liu, M., Li, S., Tang, G., Wang, W., Huang, P., Wei, G., Lin, Y., Chen, B., Hu, J., & Cen, Z. (2018). Lost but can’t be neglected: Huge quantities of small microplastics hide in the South China Sea. Science of the Total Environment, 633, 1206–1216. https://doi.org/https://doi.org/10.1016/j.scitotenv.2018.03.197
- Cai, H., Du, F., Li, L., Li, B., Li, J., & Shi, H. (2019). A practical approach based on FT-IR spectroscopy for identification of semi-synthetic and natural celluloses in microplastic investigation. Science of the Total Environment, 669, 692–701. https://doi.org/https://doi.org/10.1016/j.scitotenv.2019.03.124
- Calderon, E. A., Hansen, P., Rodriguez, A., Blettler, M. C. M., Syberg, K., & Khan, F. R. (2019). Microplastics in the digestive tracts of four fish species from the Cienaga Grande de Santa Marta estuary in Colombia. Water, Air, & Soil Pollution, 230(11), 257. https://doi.org/https://doi.org/10.1007/s11270-019-4313-8
- Caldwell, J., Petri-Fink, A., Rothen-Rutishauser, B., & Lehner, R. (2019). Assessing meso- and microplastic pollution in the Ligurian and Tyrrhenian seas. Marine Pollution Bulletin, 149, 110572. https://doi.org/https://doi.org/10.1016/j.marpolbul.2019.110572
- Camacho, M., Herrera, A., Gomez, M., Acosta-Dacal, A., Martinez, I., Henriquez-Hernandez, L. A., & Luzardo, O. P. (2019). Organic pollutants in marine plastic debris from Canary Islands beaches. The Science of the Total Environment, 662, 22–31. https://doi.org/https://doi.org/10.1016/j.scitotenv.2018.12.422
- Caron, A. G. M., Thomas, C. R., Berry, K. L. E., Motti, C. A., Ariel, E., & Brodie, J. E. (2018). Ingestion of microplastic debris by green sea turtle (Chelonia mydas) in the Great Barrier Reef: Validation of a sequential extraction protocol. Marine Pollution Bulletin, 127, 743–751. https://doi.org/https://doi.org/10.1016/j.marpolbul.2017.12.062
- Carr, S. A., Liu, J., & Tesoro, A. G. (2016). Transport and fate of microplastic particles in wastewater treatment plants. Water Research, 91, 174–182. https://doi.org/https://doi.org/10.1016/j.watres.2016.01.002
- Carreras-Colom, E., Constenla, M., Soler-Membrives, A., Cartes, J. E., Baeza, M., Padros, F., & Carrasson, M. (2018). Spatial occurrence and effects of microplastic ingestion on the deep-water shrimp Aristeus antennatus. Marine Pollution Bulletin, 133, 44–52. https://doi.org/https://doi.org/10.1016/j.marpolbul.2018.05.012
- Carson, H. S., Colbert, S. L., Kaylor, M. J., & McDermid, K. J. (2011). Small plastic debris changes water movement and heat transfer through beach sediments. Marine Pollution Bulletin, 62(8), 1708–1713. https://doi.org/https://doi.org/10.1016/j.marpolbul.2011.05.032
- Castillo, A. B., Al-Maslamani, I., & Obbard, J. P. (2016). Prevalence of microplastics in the marine waters of Qatar. Marine Pollution Bulletin, 111(1–2), 260–267. https://doi.org/https://doi.org/10.1016/j.marpolbul.2016.06.108
- Castro, R. O., Silva, M. L., Marques, M. R. C., & de Araujo, F. V. (2016). Evaluation of microplastics in Jurujuba cove, Niterói, RJ, Brazil, an area of mussels farming. Marine Pollution Bulletin, 110(1), 555–558. https://doi.org/https://doi.org/10.1016/j.marpolbul.2016.05.037
- Catarino, A. I., Macchia, V., Sanderson, W. G., Thompson, R. C., & Henry, T. B. (2018). Low levels of microplastics (MP) in wild mussels indicate that MP ingestion by humans is minimal compared to exposure via household fibres fallout during a meal. Environmental Pollution, 237, 675–684. https://doi.org/https://doi.org/10.1016/j.envpol.2018.02.069
- Cau, A., Avio, C. G., Dessi, C., Follesa, M. C., Moccia, D., Regoli, F., & Pusceddu, A. (2019). Microplastics in the crustaceans Nephrops norvegicus and Aristeus antennatus: Flagship species for deep-sea environments? Environmental Pollution, 255(Pt 1), 113107. https://doi.org/https://doi.org/10.1016/j.envpol.2019.113107
- Cauwenberghe, L. V., Devriese, L., Galgani, F., Robbens, J., & Janssen, C. R. (2015). Microplastics in sediments: A review of techniques, occurrence and effects. Marine Environmental Research, 111, 5–17.
- Ceccarini, A., Corti, A., Erba, F., Modugno, F., Nasa, J. L., Bianchi, S., & Castelvetro, V. (2018). The hidden microplastics: New insights and figures from the through separation and characterisation of microplastics and of their degradation by-products in coastal sediments. Environmental Science & Technology, 52(10), 5634–5643. https://doi.org/https://doi.org/10.1021/acs.est.8b01487
- Chabuka, B., & Kalivas, J. (2020). Application of a hybrid fusion classification process for identification of microplastics based on Fourier transform infrared spectroscopy. Applied Spectroscopy. https://doi.org/https://doi.org/10.1177/0003702820923993
- Chae, D.-H., Kim, I.-S., Kim, S.-K., Song, Y. K., & Shim, W. J. (2015). Abundance and distribution characteristics of microplastics in surface seawaters of the Incheon/Kyeonggi coastal region. Archives of Environmental Contamination and Toxicology, 69(3), 269–278. https://doi.org/https://doi.org/10.1007/s00244-015-0173-4
- Chalmers, J. M. (2006). Infrared spectroscopy in analysis of polymers and rubbers. In R. A. Meyers (Ed.), Encyclopaedia of analytical chemistry. Wiley. https://doi.org/https://doi.org/10.1002/9780470027318.a2015
- Chan, H. S. H., Dingle, C., & Not, C. (2019). Evidence for non-selective ingestion of microplastic in demersal fish. Marine Pollution Bulletin, 149, 110523. https://doi.org/https://doi.org/10.1016/j.marpolbul.2019.110523
- Chan, K. L., & Kazarian, S. G. (2013). Aberration-free FTIR spectroscopic imaging of live cells in microfluidic devices. The Analyst, 138(14), 4040–4047. https://doi.org/https://doi.org/10.1039/c3an00327b
- Chang, X., Xue, Y., Li, J., Zou, L., & Tang, M. (2020). Potential health impact of environmental micro- and nanoplastics pollution. Journal of Applied Toxicology: JAT, 40(1), 4–15. https://doi.org/https://doi.org/10.1002/jat.3915
- Chen, M., Jin, M., Tao, P., Wang, Z., Xie, W., Yu, X., & Wang, K. (2018). Assessment of microplastics derived from mariculture in Xiangshan Bay, China. Environmental Pollution, 242(Pt B), 1146–1156. https://doi.org/https://doi.org/10.1016/j.envpol.2018.07.133
- Chen, Q., Zhang, H., Allgeier, A., Zhou, Q., Ouellet, J. D., Crawford, S. E., Luo, Y., Yang, Y., Shi, H., & Hollert, H. (2019). Marine microplastics bound Dioxin-like chemicals: Model explanation and risk assessment. Journal of Hazardous Materials, 364, 82–90. https://doi.org/https://doi.org/10.1016/j.jhazmat.2018.10.032
- Chen, Y., Wen, D., Pei, J., Fei, Y., Ouyang, D., Zhang, H., & Luo, Y. (2020). Identification and quantification of microplastics using Fourier Transform Infrared Spectroscopy: Current status and future prospects. Current Opinion in Environmental Science & Health, 18, 14–19. https://doi.org/https://doi.org/10.1016/j.coesh.2020.05.004
- Cheung, P. K., Cheung, L. T. O., & Fo, L. (2016). Seasonal variation in the abundance of marine plastic debris in the estuary of a subtropical macro-scale drainage basin in South China. Science of the Total Environment, 562, 658–665. https://doi.org/https://doi.org/10.1016/j.scitotenv.2016.04.048
- Cheung, P. K., & Fok, L. (2016). Evidence of microbeads from personal care product contaminating the sea. Marine Pollution Bulletin, 109(1), 582–585. https://doi.org/https://doi.org/10.1016/j.marpolbul.2016.05.046
- Cheung, P. K., Fok, L., Hung, P. L., & Cheung, L. T. O. (2018). Spatio-temporal comparison of neustonic microplastic density in Hong Kong waters under the influence of the Pearl River Estuary. Science of the Total Environment, 628–629, 731–739. https://doi.org/https://doi.org/10.1016/j.scitotenv.2018.01.338
- Cheung, P. K., Hung, P. L., & Fok, L. (2019). River microplastic contamination and dynamics upon a rainfall event in Hong Kong, China. Environmental Processes, 6(1), 253–264. https://doi.org/https://doi.org/10.1007/s40710-018-0345-0
- Cho, Y., Shim, W. J., Jang, M., Han, G. M., & Hong, S. H. (2019). Abundance and characteristics of microplastics in market bivalves from South Korea. Environmental Pollution, 245, 1107–1116. https://doi.org/https://doi.org/10.1016/j.envpol.2018.11.091
- Chouchene, K., Costa, J. P., Wali, A., Girao, A. V., Hentati, O., Duarte, A. C., Rocha-Santos, T., & Ksibi, M. (2019). Microplastic pollution in the sediments of Sidi Mansour Harbour in Southeast Tunisia. Marine Pollution Bulletin, 146, 92–99. https://doi.org/https://doi.org/10.1016/j.marpolbul.2019.06.004
- Chubarenko, I., Efimova, I., Bagaeva, M., Bagaev, A., & Isachenko, I. (2020). On mechanical fragmentation of single-use plastics in the sea swash zone with different types of bottom sediments: Insights from laboratory experiments. Marine Pollution Bulletin, 150, 110726. https://doi.org/https://doi.org/10.1016/j.marpolbul.2019.110726
- Cincinelli, A., Scopetani, C., Chelazzi, D., Lombardini, E., Martellini, T., Katsoyiannis, A., Fossi, M. C., & Corsolini, S. (2017). Microplastic in the surface waters of the Ross Sea (Antarctica): Occurrence, distribution and characterisation by FTIR. Environmental Pollution, 175, 391–400.
- Claessens, M., Meester, S. D., Landuyt, L. V., Clerck, K. D., & Janssen, C. R. (2011). Occurrence and distribution of microplastics in marine sediments along the Belgian coast. Marine Pollution Bulletin, 62(10), 2199–2204. https://doi.org/https://doi.org/10.1016/j.marpolbul.2011.06.030
- Coates, J. (2000). Interpretation of infrared spectra, a practical approach. In R. A. Meyers (Ed.), Encyclopaedia of analytical chemistry (pp. 10815–10837). John Wiley & Sons, Ltd.
- Cole, M., Lindeque, P., Fileman, E., Halsband, C., Goodhead, R., Moger, J., & Galloway, T. S. (2013). Microplastic ingestion by zooplankton. Environmental Science & Technology, 47(12), 6646–6655. https://doi.org/https://doi.org/10.1021/es400663f
- Cole, M., Lindeque, P., Halsband, C., & Galloway, T. S. (2011). Microplastics as contaminants in the marine environment: A review. Marine Pollution Bulletin, 62(12), 2588–2597. https://doi.org/https://doi.org/10.1016/j.marpolbul.2011.09.025
- Cole, M., Webb, H., Lindeque, P. K., Fileman, E. S., Halsband, C., & Galloway, T. S. (2014). Isolation of microplastics in biota-rich seawater samples and marine organisms. Scientific Reports, 4, 4528. https://doi.org/https://doi.org/10.1038/srep04528
- Compa, M., Ventero, A., Iglesias, M., & Deudero, S. (2018). Ingestion of microplastics and natural fibres in Sardina pilchardus (Walbaum, 1792) and Engraulis encrasicolus (Linnaeus, 1758) along the Spanish Mediterranean coast. Marine Pollution Bulletin, 128, 89–96. https://doi.org/https://doi.org/10.1016/j.marpolbul.2018.01.009
- Conley, K., Clum, A., Deepe, J., Lane, H., & Beckingham, B. (2019). Wastewater treatment plants as a source of microplastics to an urban estuary: Removal efficiencies and loading per capita over one year. Water Research X, 3, 100030. https://doi.org/https://doi.org/10.1016/j.wroa.2019.100030
- Constant, M., Kerherve, P., Mino-Vercellio-Verollet, M., Dumontier, M., Vidal, A. S., Canals, M., & Heussner, S. (2019). Beached microplastics in the Northwestern Mediterranean Sea. Marine Pollution Bulletin, 142, 263–273. https://doi.org/https://doi.org/10.1016/j.marpolbul.2019.03.032
- Coppock, R. L., Cole, M., Lindeque, P. K., Queiros, A. M., & Galloway, T. S. (2017). A small-scale, portable method for extracting microplastics from marine sediments. Environmental Pollution, 230, 829–837. https://doi.org/https://doi.org/10.1016/j.envpol.2017.07.017
- Corami, F., Rosso, B., Bravo, B., Gambaro, A., & Barbante, C. (2020). A novel method for purification, quantitative analysis and characterisation of microplastic fibers using micro-FTIR. Chemosphere, 238, 124564. https://doi.org/https://doi.org/10.1016/j.chemosphere.2019.124564
- Corcoran, P. L., Norris, T., Ceccanese, T., Walzak, M. J., Helm, P. A., & Marvin, C. H. (2015). Hidden plastics of Lake Ontario, Canada and their potential preservation in the sediment record. Environmental Pollution, 204, 17–25. https://doi.org/https://doi.org/10.1016/j.envpol.2015.04.009
- Cordova, M. R., Purwiyanto, A. I. S., & Suteja, Y. (2019). Abundance and characteristics of microplastics in the northern coastal waters of Surabaya, Indonesia. Marine Pollution Bulletin, 142, 183–188. https://doi.org/https://doi.org/10.1016/j.marpolbul.2019.03.040
- Costa, J. P., Nunes, A. R., Santos, P. S. M., Girao, A. V., Duarte, A. C., & Rocha-Santos, T. (2018). Degradation of polyethylene microplastics in seawater: Insights into the environmental degradation of polymers. Journal of Environmental Science and Health, Part A, 53, 866–875.
- Courtene-Jones, W., Quinn, B., Ewins, C., Gary, S. F., & Narayanaswamy, B. E. (2019). Consistent microplastic ingestion by deep-sea invertebrates over the four decades (1976–2015), a study from the North East Atlantic. Environmental Pollution, 244, 503–512. https://doi.org/https://doi.org/10.1016/j.envpol.2018.10.090
- Courtene-Jones, W., Quinn, B., Gary, S. F., Mogg, A. O. M., & Narayanaswamy, B. E. (2017). Microplastic pollution identified in deep-sea water and ingested by benthic invertebrates in the Rockall Through, North Atlantic Ocean. Environmental Pollution, 231(Pt 1), 271–280. https://doi.org/https://doi.org/10.1016/j.envpol.2017.08.026
- Courtene-Jones, W., Quinn, B., Murphy, F., Gary, S. F., & Narayanaswamy, B. E. (2017). Optimisation of enzymatic digestion and validation of specimen preservation methods for the analysis of ingested microplastics. Analytical Methods, 9(9), 1437–1445. https://doi.org/https://doi.org/10.1039/C6AY02343F
- Crichton, C. M., Noel, M., Gies, E. A., & Ross, P. S. (2017). A novel, density-independent and FTIR-compatible approach for the rapid extraction of microplastics from aquatic sediments. Analytical Methods, 9(9), 1419–1428. https://doi.org/https://doi.org/10.1039/C6AY02733D
- Dai, Z., Zhang, H., Zhou, Y., Tian, Y., Chen, T., Tu, C., Fu, C., & Luo, Y. (2018). Occurrence of microplastics in the water column and sediment in an inland sea affected by intensive anthropogenic activities. Environmental Pollution, 242, 1557–1565. https://doi.org/https://doi.org/10.1016/j.envpol.2018.07.131
- Deng, Y., Zhang, Y., Qiao, R., Bonilla, M. M., Yang, X., Ren, H., & Lemos, B. (2018). Evidence that microplastics aggravate the toxicity of organophosphorus flame retardants in mice (Mus musculus). Journal of Hazardous Materials, 357, 348–354. https://doi.org/https://doi.org/10.1016/j.jhazmat.2018.06.017
- Didier, D., Anne, M., & Alexandra, T. H. (2017). Plastics in the North Atlantic garbage patch: A boat-micrbe for hitchhikers and plastic degraders. Science of the Total Environment, 599–600, 1222–1232.
- Digka, N., Tsangaris, C., Torre, M., Anastasopoulou, A., & Zeri, C. (2018). Microplastics in mussels and fish from the Northern Ionian Sea. Marine Pollution Bulletin, 135, 30–40. https://doi.org/https://doi.org/10.1016/j.marpolbul.2018.06.063
- Dikareva, N., & Simon, K. S. (2019). Microplastic pollution in streams spanning an urbanisation gradient. Environmental Pollution, 250, 292–299. https://doi.org/https://doi.org/10.1016/j.envpol.2019.03.105
- Ding, J., Jiang, F., Li, J., Wang, Z., Sun, C., Wang, Z., Fu, L., Ding, N. X., & He, C. (2019). Microplastics in the Coral reef systems from Xisha Islands of South China Sea. Environmental Science & Technology, 53(14), 8036–8046. https://doi.org/https://doi.org/10.1021/acs.est.9b01452
- Ding, J.-F., Li, J.-X., Sun, C.-J., He, C.-F., Jiang, F.-H., Gao, F.-L., & Zheng, L. (2018). Separation and identification of microplastics in digestive system of Bivalves. Chinese Journal of Analytical Chemistry, 46(5), 690–697. https://doi.org/https://doi.org/10.1016/S1872-2040(18)61086-2
- Donohue, M. J., Masura, J., Gelatt, T., Ream, R., Baker, J. D., Faulhaber, K., & Lerner, D. T. (2019). Evaluating exposure of northern fur seals, Callorhinus ursinus, to microplastic pollution through fecal analysis. Marine Pollution Bulletin, 138, 213–221. https://doi.org/https://doi.org/10.1016/j.marpolbul.2018.11.036
- Dowarah, K., & Devipriya, S. P. (2019). Microplastic prevalence in the beaches of Puducherry, India and its correlation with fishing and tourism/recreational activities. Marine Pollution Bulletin, 148, 123–133. https://doi.org/https://doi.org/10.1016/j.marpolbul.2019.07.066
- Doyle, D., Gammell, M., Frias, J., Griffin, G., & Nash, R. (2019). Low levels of microplastics recorded from the common periwinkle, Littorina littorea on the west coast of Ireland. Marine Pollution Bulletin, 149, 110645. https://doi.org/https://doi.org/10.1016/j.marpolbul.2019.110645
- Dris, R., Gasperi, J., Mirande, C., Mandin, C., Guerrouache, M., Langlois, V., & Tassin, B. (2017). A first overview of textile fibers, including microplastics, in indoor and outdoor environments. Environmental Pollution, 221, 453–458. https://doi.org/https://doi.org/10.1016/j.envpol.2016.12.013
- Dris, R., Gasperi, J., Rocher, V., & Tassin, B. (2018). Synthetic and non-synthetic anthropogenic fibers in a river under the impact of Paris Megacity: Sampling methodological aspects and flux estimations. Science of the Total Environment, 618, 157–164. https://doi.org/https://doi.org/10.1016/j.scitotenv.2017.11.009
- Dris, R., Gasperi, J., Saad, M., Mirande, C., & Tassin, B. (2016). Synthetic fibers in atmospheric fallout: A source of microplastics in the environment? Marine Pollution Bulletin, 104(1–2), 290–293. https://doi.org/https://doi.org/10.1016/j.marpolbul.2016.01.006
- Du, J., Xu, S., Zhou, Q., Li, H., Fu, L., Tang, J., Wang, Y., Peng, X., Xu, Y., & Du, X. (2020). A review of microplastics in the aquatic environmental: Distribution, transport, ecotoxicology, and toxicological mechanisms. Environmental Science and Pollution Research International, 27(11), 11494–11505. https://doi.org/https://doi.org/10.1007/s11356-020-08104-9
- Dumichen, E., Barthel, A.-K., Braun, U., Bannick, C. G., Brand, K., Jekel, M., & Senz, R. (2015). Analysis of polyethylene microplastics in environmental samples, using a thermal decomposition method. Water Research, 85, 451–457. https://doi.org/https://doi.org/10.1016/j.watres.2015.09.002
- Dyachenko, A., Mitchell, J., & Arsem, N. (2017). Extraction and identification of microplastic particles from secondary wastewater treatment plant (WWTP) effluent. Analytical Methods, 9(9), 1412–1418. https://doi.org/https://doi.org/10.1039/C6AY02397E
- Edo, C., Tamayo-Belda, M., Martinez-Campos, S., Martin-Betancor, K., Gonzalez-Pleiter, M., Pulido-Reyes, G., Garcia-Ruiz, G., Zapata, F., Leganes, F., Fernandez-Pinas, F., & Rosal, R. (2019). Occurrence and identification of microplastics along a beach in the Biosphere Reserve of Lanzarote. Marine Pollution Bulletin, 143, 220–227. https://doi.org/https://doi.org/10.1016/j.marpolbul.2019.04.061
- Efimova, I., Bagaeva, M., Bagaev, A., Kileso, A., & Chubarenko, I. P. (2018). Secondary microplastics generation in the sea swash zone with coarse bottom sediments: Laboratory experiments. Frontiers in Marine Science, 5, 313. https://doi.org/https://doi.org/10.3389/fmars.2018.00313
- Endo, S., Takizawa, R., Okuda, K., Takada, H., Chiba, K., Kanehiro, H., Ogi, H., Yamashita, R., & Date, T. (2005). Concentrations of polychlorinated biphenyls (PCBs) in beached resin pellets: Variability among individual particles and regional differences. Marine Pollution Bulletin, 50(10), 1103–1114. https://doi.org/https://doi.org/10.1016/j.marpolbul.2005.04.030
- Eo, S., Hong, S. H., Song, Y. K., Han, G. M., & Shim, W. J. (2019). Spatiotemporal distribution and annual load of microplastics in the Nakdong River, South Korea. Water Research, 160, 228–237. https://doi.org/https://doi.org/10.1016/j.watres.2019.05.053
- Eo, S., Hong, S. H., Song, Y. K., Lee, J., Lee, J., & Shim, W. J. (2018). Abundance, composition yuand distribution of microplastics larger than 20µm in sand beaches of South Korea. Environmental Pollution, 238, 894–902. https://doi.org/https://doi.org/10.1016/j.envpol.2018.03.096
- Fan, Y., Zheng, K., Zhu, Z., Chen, G., & Peng, X. (2019). Distribution, sedimentary record, and persistence of microplastics in the Pearl river catchment, China. Environmental Pollution, 251, 862–870. https://doi.org/https://doi.org/10.1016/j.envpol.2019.05.056
- Fang, C., Zheng, R., Zhang, Y., Hong, F., Mu, J., Chen, M., Song, P., Lin, L., Lin, H., Le, F., & Bo, J. (2018). Microplastic contamination in benthic organisms from the Arctic and sub-Arctic regions. Chemosphere, 209, 298–306. https://doi.org/https://doi.org/10.1016/j.chemosphere.2018.06.101
- Felice, B. D., Bacchetta, R., Santo, N., Tremolada, P., & Parolini, M. (2018). Polystyrene microplastics did not affect body growth and swimming activity in Xenopus laevis tadpoles. Environmental Science and Pollution Research, 25(34), 34644–34651. https://doi.org/https://doi.org/10.1007/s11356-018-3408-x
- Feng, Z., Zhang, T., Li, Y., He, X., Wang, R., Xu, J., & Gao, G. (2019). The accumulation of microplastics in fish from an important fish farm and mariculture area, Haizhou Bay, China. The Science of the Total Environment, 696, 133948. https://doi.org/https://doi.org/10.1016/j.scitotenv.2019.133948
- Figueiredo, G. M., & Vianna, T. M. P. (2018). Suspended microplastics in a highly polluted bay: Abundance, size, and availability for mesozooplankton. Marine Pollution Bulletin, 135, 256–265. https://doi.org/https://doi.org/10.1016/j.marpolbul.2018.07.020
- Filgueira, A. V., Gago, J., Campillo, J. A., & Leon, V. M. (2019). Microplastic distribution in surface sediments along the Spanish Mediterranean continental shelf. Environmental Science and Pollution Research, 26(21), 21264–21273. https://doi.org/https://doi.org/10.1007/s11356-019-05341-5
- Foekema, E. M., de Gruijter, C., Mergia, M. T., van Franeker, J. A., Murk, A. J., & Koelmans, A. A. (2013). Plastic in the North Sea fish. Environmental Science & Technology, 47(15), 8818–8824. https://doi.org/https://doi.org/10.1021/es400931b
- Fok, L., Cheung, P. K., Tang, G., & Li, W. C. (2017). Size distribution of stranded small plastic debris on the coast of Guangdong, South China. Environmental Pollution, 220, 407–412. https://doi.org/https://doi.org/10.1016/j.envpol.2016.09.079
- Fossi, M. C., Baini, M., Panti, C., Galli, M., Jimenez, B., Munoz-Arnanz, J., Marsili, L., Finoia, M. G., & Ramirez-Macias, D. (2017). Are whale sharks exposed to persistent organic pollutants and plastic pollution in the Gulf of California (Mexico)? First ecotoxicological investigation using skin biopsies. Comparative Biochemistry and Physiology Part C: Toxicology & Pharmacology, 199, 48–58. https://doi.org/https://doi.org/10.1016/j.cbpc.2017.03.002
- Frias, J. P. G. L., Sobral, P., & Ferreira, A. M. (2010). Organic pollutants in microplastics from two beaches of the Portuguese coast. Marine Pollution Bulletin, 60(11), 1988–1992. https://doi.org/https://doi.org/10.1016/j.marpolbul.2010.07.030
- Frias, J. P. G. L., Otero, V., & Sobral, P. (2014). Evidence of microplastics in samples of zooplankton from Portuguese coastal waters. Marine Environmental Research, 95, 89–95. https://doi.org/https://doi.org/10.1016/j.marenvres.2014.01.001
- Gago, J., Galgani, F., Maes, T., & Thompson, R. C. (2016). Microplastics in Seawater: Recommendations from the Marine Strategy Framework Directive Implementation Process. Frontiers in Marine Science, 3, 219. https://doi.org/https://doi.org/10.3389/fmars.2016.00219
- Gall, S. C., & Thompson, R. C. (2015). The impact of debris on marine life. Marine Pollution Bulletin, 92(1–2), 170–179. https://doi.org/https://doi.org/10.1016/j.marpolbul.2014.12.041
- Gallagher, A., Rees, A., Rowe, R., Stevens, J., & Wright, P. (2016). Microplastics in the Solvent estuarine complex, UK: An initial assessment. Marine Pollution Bulletin, 102(2), 243–249. https://doi.org/https://doi.org/10.1016/j.marpolbul.2015.04.002
- Galloway, T. S., Cole, M., & Lewis, C. (2017). Interactions of microplastic debris throughout the marine ecosystem. Nature Ecology and Evolution, 1, 0116.
- Garaba, S. P., & Dierssen, H. M. (2018). An airborne remote sensing case study of synthetic hydrocarbon detection using short wave infrared absorption features identified from marine-harvested macro- and microplastics. Remote Sensing of Environment, 205, 224–235. https://doi.org/https://doi.org/10.1016/j.rse.2017.11.023
- Garces-Ordonez, O., Castillo-Olaya, V. A., Granados-Briceno, A. F., Garcia, L. M. B., & Diaz, L. F. E. (2019). Marine litter and microplastic pollution on mangrove soils of the Cienaga Grande de Santa Marta, Coambian Caribbean. Marine Pollution Bulletin, 145, 455–462. https://doi.org/https://doi.org/10.1016/j.marpolbul.2019.06.058
- Garcia-Garin, O., Vighi, M., Aguilar, A., Tsangaris, C., Digka, N., Kaberi, H., & Borrell, A. (2019). Boops boops as a bioindicator of microplastic pollution along the Spanish Catalan coast. Marine Pollution Bulletin, 149, 110648. https://doi.org/https://doi.org/10.1016/j.marpolbul.2019.110648
- Garrido, S., Linares, M., Campillo, J. A., & Albentosa, M. (2019). Effect of microplastics on the toxicity of chlorpyrifos to the microalgae Isochrysis galbana, clone t-ISO. Ecotoxicology and Environmental Safety, 173, 103–109. https://doi.org/https://doi.org/10.1016/j.ecoenv.2019.02.020
- Gasperi, J., Dris, R., Bonin, T., Rocher, V., & Tassin, B. (2014). Assessment of floating plastic debris in surface water along the Seine river. Environmental Pollution, 195, 163–166. https://doi.org/https://doi.org/10.1016/j.envpol.2014.09.001
- Gassel, M., & Rochman, C. M. (2019). The complex issue of chemicals and microplastic pollution: A case study in North Pacific lanternfish. Environmental Pollution, 248, 1000–1009. https://doi.org/https://doi.org/10.1016/j.envpol.2019.03.002
- GESAMP. (2019). Guidelines or the monitoring and assessment of plastic litter and microplastics in the ocean (Kershaw, P. J., Turra, A., and Galgani, F., editors, IMO/FAO/UNESCO-IOC/UNIDO/WMO/IAEA/UN/UNEP/UNDP/ISA Joint Group of Experts on the Scientific Aspects of Marine Environmental Protection). Rep. Stud. GESAMP No. 99, pp. 130.
- Gewert, B., Ogonowski, M., Barth, A., & MacLeod, M. (2017). Abundance and composition of near surface microplastics and plastic debris in the Stockhom Archipelago, Baltic Sea. Marine Pollution Bulletin, 120(1–2), 292–302. https://doi.org/https://doi.org/10.1016/j.marpolbul.2017.04.062
- Gies, E. A., LeNoble, J. L., Noel, M., Etemadifar, A., Bishay, F., Hall, E. R., & Ross, P. S. (2018). Retention of microplastics in a major secondary wastewater treatment plant in Vancouver, Canada. Marine Pollution Bulletin, 133, 553–561. https://doi.org/https://doi.org/10.1016/j.marpolbul.2018.06.006
- Goldstein, M. C., Titmus, A. J., & Ford, M. (2013). Scales of spatial Heterogeneity of plastic marine debris in the Northern Pacific Ocean. PLoS One., 8(11), e80020. https://doi.org/https://doi.org/10.1371/journal.pone.0080020
- Gomiero, A., Strafella, P., Øysaed, K. B., & Fabi, G. (2019). First occurrence and composition assessment of microplastics in native mussels collected from coastal and offshore areas of the northern and central Adriatic Sea. Environmental Science and Pollution Research International, 26(24), 24407–24416. https://doi.org/https://doi.org/10.1007/s11356-019-05693-y
- Graca, B., Szewc, K., Zakrzewska, D., Dołęga, A., & Szczerbowska-Boruchowska, M. (2017). Sources and fate of microplastics in marine and beach sediments of the Southern Baltic Sea—A preliminary study. Environmental Science and Pollution Research, 24(8), 7650–7661. https://doi.org/https://doi.org/10.1007/s11356-017-8419-5
- Gray, A. D., Wertz, H., Leads, R. R., & Weinstein, J. E. (2018). Microplastic in two South Carolina Estuaries: Occurrence, distribution and composition. Marine Pollution Bulletin, 128, 223–233. https://doi.org/https://doi.org/10.1016/j.marpolbul.2018.01.030
- Green, D. S., Kregting, L., Boots, B., Blockley, D. J., Brickle, P., Costa, M., & Crowley, Q. (2018). A comparison of sampling methods for seawater microplastics and a first report of the microplastic litter in coastal waters of Ascension and Falkland Islands. Marine Pollution Bulletin, 137, 695–701. https://doi.org/https://doi.org/10.1016/j.marpolbul.2018.11.004
- Guidelli, E. J., Ramos, A. P., Zaniquelli, M. E. D., & Baffa, O. (2011). Green synthesis of colloidal silver nanoparticles using natural rubber latex extracted from Hevea brasiliensis. Spectrochimica Acta. Part A, Molecular and Biomolecular Spectroscopy, 82(1), 140–145. https://doi.org/https://doi.org/10.1016/j.saa.2011.07.024
- Gündoğdu, S., Çevik, C., Ayat, B., Aydoğan, B., & Karaca, S. (2018). How microplastics quantities increase with flood events? An example from Mersin Bay NE Levantine coast of Turkey. Environmental Pollution, 239, 342–350. https://doi.org/https://doi.org/10.1016/j.envpol.2018.04.042
- Gündoğdu, S., Çevik, C., & Karaca, S. (2017). Fouling assemblage of benthic plastic debris collected from Mersin Bay, NE Levantine coast of Turkey. Marine Pollution Bulletin, 124(1), 147–154. https://doi.org/https://doi.org/10.1016/j.marpolbul.2017.07.023
- Guven, O., Gokdag, K., Jovanovic, B., & Kideys, A. E. (2017). Microplastic litter composition of the Turkish territorial waters of the Mediterranean Sea, and its occurrence in the gastrointestinal tract of fish. Environmental Pollution, 223, 286–294.
- Haave, M., Lorenz, C., Primpke, S., & Gerdts, G. (2019). Different stories told by small and large microplastics in sediment—First report of microplastic concentrations in an urban recipient in Norway. Marine Pollution Bulletin, 141, 501–513. https://doi.org/https://doi.org/10.1016/j.marpolbul.2019.02.015
- Hall, N. M., Berry, K. L. E., Rintoul, L., & Hoogenboom, M. O. (2015). Microplastic ingestion by scleractinian corals. Marine Biology, 162(3), 725–732. https://doi.org/https://doi.org/10.1007/s00227-015-2619-7
- Halle, A., Ladirat, L., Gendre, X., Goudouneche, D., Pusineri, C., Routaboul, C., Tenailleau, C., Duployer, B., & Perez, E. (2016). Understanding the fragmentation pattern of marine plastic debris. Environmental Science & Technology, 50(11), 5668–5675. https://doi.org/https://doi.org/10.1021/acs.est.6b00594
- Halstead, J. E., Smith, J. A., Carter, E. A., Lay, P. A., & Johnston, E. L. (2018). Assessment tools for microplastics and natural fibres ingested by fish in an urbanised estuary. Environmental Pollution, 234, 552–561. https://doi.org/https://doi.org/10.1016/j.envpol.2017.11.085
- Hanachi, P., Karbalaei, S., Walker, T. R., Cole, M., & Hosseini, S. V. (2019). Abundance and properties of microplastics found in commercial fish meal and cultured common carp (Cyprinus carpio). Environmental Science and Pollution Research International, 26(23), 23777–23787. https://doi.org/https://doi.org/10.1007/s11356-019-05637-6
- Harrison, J. P., Ojeda, J. J., & Romero-Gonzalez, M. E. (2012). The applicability of reflectance micro-Fourier-transform infrared spectroscopy for the detection of synthetic microplastics in marine sediments. The Science of the Total Environment, 416, 455–463. https://doi.org/https://doi.org/10.1016/j.scitotenv.2011.11.078
- Hartmann, N. B., Hüffer, T., Thompson, R. C., Hassellöv, M., Verschoor, A., Daugaard, A. E., Rist, S., Karlsson, T., Brennholt, N., Cole, M., Herrling, M. P., Hess, M. C., Ivleva, N. P., Lusher, A. L., & Wagner, M. (2019). Are we speaking the same language? Recommendations for a definition and categorization framework for plastic debris. Environmental Science & Technology, 53(3), 1039–1047. https://doi.org/https://doi.org/10.1021/acs.est.8b05297
- Hasselerharm, P. E. R., Falahudin, D., Peeters, E., & Koelmans, A. A. (2018). Microplastic effect thresholds for freshwater benthic macroinvertebrates. Environmental Science & Technology, 52(4), 2278–2286. https://doi.org/https://doi.org/10.1021/acs.est.7b05367
- Hendrickson, E., Minor, E. C., & Schreiner, K. (2018). Microplastic abundance and composition in western lake superior as determined via microscopy, Pyr-GC/MS, and FTIR. Environmental Science & Technology, 52(4), 1787–1796. https://doi.org/https://doi.org/10.1021/acs.est.7b05829
- Hermsen, E., Pompe, R., Besseling, E., & Koelmans, A. A. (2017). Detection of low numbers of microplastics in North Sea fish using strict quality assurance criteria. Marine Pollution Bulletin, 122(1–2), 253–258. https://doi.org/https://doi.org/10.1016/j.marpolbul.2017.06.051
- Herrera, A., Garrido-Amador, P., Martinez, I., Samper, M. D., Lopez-Martinez, J., Gomez, M., & Packard, T. T. (2018). Novel methodology to isolate microplastics from vegetal-rich samples. Marine Pollution Bulletin, 129(1), 61–69. https://doi.org/https://doi.org/10.1016/j.marpolbul.2018.02.015
- Hidalgo-Ruz, V., Gutow, L., Thompson, R. C., & Thiel, M. (2012). Microplastics in the marine environment: A review of the methods used for identification and quantification. Environmental Science & Technology, 46(6), 3060–3075. https://doi.org/https://doi.org/10.1021/es2031505
- Hipfner, J. M., Galbraith, M., Tucker, S., Studholme, K. R., Domalik, A. D., Pearson, S. F., Good, T. P., Ross, P. S., & Hodum, P. (2018). Two forage fishes as potential conduits for the vertical transfer of microfibres in Northeastern Pacific Ocean food webs. Environmental Pollution, 239, 215–222. https://doi.org/https://doi.org/10.1016/j.envpol.2018.04.009
- Hodson, M. E., Duffus-Hodson, C., Clark, A., Prendergast-Miller, M., & Thorpe, K. L. (2017). Plastic bag derived microplastics as a vector for metal exposure in terrestrial invertebrates. Environmental Science & Technology, 51(8), 4714–4721. https://doi.org/https://doi.org/10.1021/acs.est.7b00635
- Holmes, L. A., Turner, A., & Thompson, R. C. (2014). Interactions between trace metals and plastic production pellets under estuarine conditions. Marine Chemistry, 167, 25–32. https://doi.org/https://doi.org/10.1016/j.marchem.2014.06.001
- Horn, D., Miller, M., Anderson, S., & Steele, C. (2019). Microplastics are ubiquitous on California beaches and enter the coastal food web through consumption by Pacific mole crabs. Marine Pollution Bulletin, 139, 231–237. https://doi.org/https://doi.org/10.1016/j.marpolbul.2018.12.039
- Hossain, M. S., Sobhan, F., Uddin, M. N., Sharifuzzaman, S. M., Chowdhury, S. R., Sarker, S., & Chowdhury, M. S. N. (2019). Microplastics in fishes from the Northern Bay of Bengal. Science of the Total Environment, 690, 821–830. https://doi.org/https://doi.org/10.1016/j.scitotenv.2019.07.065
- Hu, L., Chernick, M., Hinton, D. E., & Shi, H. (2018). Microplastics in small waterbodies and Tadpoles from Yangtze River Delta, China. Environmental Science & Technology, 52(15), 8885–8893. https://doi.org/https://doi.org/10.1021/acs.est.8b02279
- Hufnagl, B., Steiner, D., Renner, E., Loder, M. G. J., Laforsch, C., & Lohninger, H. (2019). A methodology for the fast identification and monitoring of microplastics in environmental samples using random decision forest classifiers. Analytical Methods, 11(17), 2277–2285. https://doi.org/https://doi.org/10.1039/C9AY00252A
- Hurley, R. R., Woodward, J. C., & Rothwell, J. J. (2017). Ingestion of microplastics by freshwater Tubifex worms. Environmental Science & Technology, 51(21), 12844–12851. https://doi.org/https://doi.org/10.1021/acs.est.7b03567
- Iannilli, V., Gennaro, A. D., Lecce, F., Sighicelli, M., Falconieri, M., Pietrelli, L., Poeta, G., & Battisti, C. (2018). Microplastics in Talitrus saltator (Crustacea, Amphipoda): New evidence of ingestion from natural contexts. Environmental Science and Pollution Research International, 25(28), 28725–28729. https://doi.org/https://doi.org/10.1007/s11356-018-2932-z
- Iannilli, V., Pasquali, V., Setini, A., & Corami, F. (2019). First evidence of microplastics ingestion in benthic amphipods from Svalbard. Environmental Research, 179(Pt A), 108811. https://doi.org/https://doi.org/10.1016/j.envres.2019.108811
- Ilharco, L. M., & Brito de Barros, R. (2000). Aggregation of pseudoisocyanine iodide in cellulose acetate films: Structural characterisation by FTIR. Langmuir, 16(24), 9331–9337. https://doi.org/https://doi.org/10.1021/la000579e
- Imhof, H. K., Sigl, R., Brauer, E., Feyl, S., Giesemann, P., Klink, S., Leupolz, K., Löder, M. G. J., Löschel, L. A., Missun, J., Muszynski, S., Ramsperger, A. F. R. M., Schrank, I., Speck, S., Steibl, S., Trotter, B., Winter, I., & Laforsch, C. (2017). Spatial and temporal variation of macro-, meso- and microplastic abundance on a remote coral island of the Maldives, Indian Ocean. Marine Pollution Bulletin, 116(1–2), 340–347. https://doi.org/https://doi.org/10.1016/j.marpolbul.2017.01.010
- Iniguez, M. E., Conesa, J. A., & Fullana, A. (2017). Microplastics in Spanish table salt. Scientific Reports, 7(1), 8620. https://doi.org/https://doi.org/10.1038/s41598-017-09128-x
- Isobe, A. (2016). Percentage of microbeads in pelagic microplastics within Japanese coastal waters. Marine Pollution Bulletin, 110(1), 432–437. https://doi.org/https://doi.org/10.1016/j.marpolbul.2016.06.030
- Isobe, A., Kubo, K., Tamura, Y., Kako, S., Nakashima, E., & Fujii, N. (2014). Selective transport of microplastics and mesoplastics by drifting in coastal waters. Marine Pollution Bulletin, 89(1–2), 324–330. https://doi.org/https://doi.org/10.1016/j.marpolbul.2014.09.041
- Isobe, A., Uchida, K., Tokai, T., & Iwasaki, S. (2015). East Asian seas: A hot spot of pelagic microplastics. Marine Pollution Bulletin, 101(2), 618–623. https://doi.org/https://doi.org/10.1016/j.marpolbul.2015.10.042
- Isobe, A., Uchiyama-Matsumoto, K., Uchida, K., & Tokai, T. (2017). Microplastics in the Southern Ocean. Marine Pollution Bulletin, 114(1), 623–626. https://doi.org/https://doi.org/10.1016/j.marpolbul.2016.09.037
- Isobe, A., Iwasaki, S., Uchida, K., & Tokai, T. (2019). Abundance of non-conservative microplastics in the upper ocean from 1957 to 2066. Nature Communications, 10(1), 417. https://doi.org/https://doi.org/10.1038/s41467-019-08316-9
- Iwasaki, S., Isobe, A., Kako, S., Uchida, K., & Tokai, T. (2017). Fate of microplastics and mesoplastics carried by surface currents and wind waves: A numerical model approach in the Sea of Japan. Marine Pollution Bulletin, 121(1–2), 85–96. https://doi.org/https://doi.org/10.1016/j.marpolbul.2017.05.057
- Jabeen, K., Su, L., Li, J., Yang, D., Tong, C., Mu, J., & Shi, H. (2017). Microplastics and mesoplastics in fish from coastal and freshwaters of China. Environmental Pollution, 221, 141–149. https://doi.org/https://doi.org/10.1016/j.envpol.2016.11.055
- Jahan, S., Strezov, V., Weldekidan, H., Kumar, R., Kan, T., Sarkodie, S. A., He, J., Dastjerdi, B., & Wilson, S. P. (2019). Interrelationship of microplastic pollution in sediments and oysters in a seaport environment of the eastern coast of Australia. Science of the Total Environment, 695, 133924. https://doi.org/https://doi.org/10.1016/j.scitotenv.2019.133924
- Jang, M., Shim, W. J., Han, G. M., Song, Y. K., & Hong, S. H. (2018). Formation of microplastics by polychaetes (Marphysa sanguinea) inhabiting expanded polystyrene marine debris. Marine Pollution Bulletin, 131(Pt A), 365–369. https://doi.org/https://doi.org/10.1016/j.marpolbul.2018.04.017
- Jemec, A., Horvat, P., Kunej, U., Bele, M., & Krzan, A. (2016). Uptake and effects of microplastic textile fibers on freshwater crustacean Daphnia magna. Environmental Pollution, 219, 201–209. https://doi.org/https://doi.org/10.1016/j.envpol.2016.10.037
- Jensen, L. H., Motti, C. A., Garm, A. L., Tonin, H., & Kroon, F. J. (2019). Sources, distribution and fate of microfibers on the Great Barrier Reef, Australia. Scientific Reports, 9(1), 9021. https://doi.org/https://doi.org/10.1038/s41598-019-45340-7
- Jiang, P., Zhao, S., Zhu, L., & Li, D. (2018). Microplastic-associated bacterial assemblages in the intertidal zone of the Yangtze Estuary. The Science of the Total Environment, 624, 48–54. https://doi.org/https://doi.org/10.1016/j.scitotenv.2017.12.105
- Jung, M. R., Horgen, F. D., Orski, S. V., Rodriguez, V., Beers, K. L., Balazs, G. H., Jones, T. T., Work, T. M., Brignac, K. C., Royer, S.-J., Hyrenbach, K. D., Jensen, B. A., & Lynch, J. M. (2018). Validation of ATR FTIR to identify polymers of plastic marine debris, including those ingested by marine organisms. Marine Pollution Bulletin, 127, 704–716. https://doi.org/https://doi.org/10.1016/j.marpolbul.2017.12.061
- Kalcikova, G., Alic, B., Skalar, T., Bundschuh, M., & Gotvajn, A. Z. (2017). Wastewater treatment plant effluents as source of cosmetic polyethylene microbeads to freshwater. Chemosphere, 188, 25–31. https://doi.org/https://doi.org/10.1016/j.chemosphere.2017.08.131
- Kang, J.-H., Kwon, O. Y., Lee, K.-W., Song, Y. K., & Shim, W. J. (2015). Marine neustonic microplastics around the southeastern coast of Korea. Marine Pollution Bulletin, 96(1–2), 304–312. https://doi.org/https://doi.org/10.1016/j.marpolbul.2015.04.054
- Kanhai, L. D. K., Gårdfeldt, K., Lyashevska, O., Hassellöv, M., Thompson, R. C., & O'Connor, I. (2018). Microplastics in sub-surface waters of the Arctic Central Basin. Marine Pollution Bulletin, 130, 8–18. https://doi.org/https://doi.org/10.1016/j.marpolbul.2018.03.011
- Kanhai, L. D. K., Officer, R., Lyashevska, O., Thompson, R. C., & O'Connor, I. (2017). Microplastic abundance, distribution and composition along a latitudinal gradient in the Atlantic Ocean. Marine Pollution Bulletin, 115(1–2), 307–314. https://doi.org/https://doi.org/10.1016/j.marpolbul.2016.12.025
- Kappler, A., Fischer, D., Oberbeckmann, S., Schernewski, G., Labrenz, M., Eichhorn, K.-J., & Voit, B. (2016). Analysis of environmental microplastics by vibrational microspectroscopy: FTIR, Raman or both? Analytical and Bioanalytical Chemistry, 408(29), 8377–8391. https://doi.org/https://doi.org/10.1007/s00216-016-9956-3
- Kappler, A., Windrich, F., Loder, M. G. J., Malanin, M., Fischer, D., Labrenz, M., Eichhorn, K.-J., & Voit, B. (2015). Identification of microplastics by FTIR and Raman microscopy: A novel silicon filter substrate opens the important spectral range below 1300 cm-1 for FTIR transmission measurements. Analytical and Bioanalytical Chemistry, 407(22), 6791–6801. https://doi.org/https://doi.org/10.1007/s00216-015-8850-8
- Karami, A., Golieskardi, A., Choo, C. K., Larat, V., Galloway, T. S., & Salamatinia, B. (2017). The presence of microplastics in commercial salts from different countries. Scientific Reports, 7, 46173. https://doi.org/https://doi.org/10.1038/srep46173
- Karkanorachaki, K., Kiparissis, S., Kalogerakis, G. C., Yiantzi, E., Psillakis, E., & Kalogerakis, N. (2018). Plastic pellets, meso- and microplastics on the coastline of Northern Crete: Distribution and organic pollution. Marine Pollution Bulletin, 133, 578–589. https://doi.org/https://doi.org/10.1016/j.marpolbul.2018.06.011
- Karthik, R., Robin, R. S., Purvaja, R., Ganguly, D., Anandavelu, I., Raghuraman, R., Hariharan, G., Ramakrishna, A., & Ramesh, R. (2018). Microplastics along the beaches of southeast coast of India. Science of the Total Environment, 645, 1388–1399. https://doi.org/https://doi.org/10.1016/j.scitotenv.2018.07.242
- Kataoka, T., Nihei, Y., Kudou, K., & Hinata, H. (2019). Assessment of the sources and inflow processes of microplastics in the river environments of Japan. Environmental Pollution, 244, 958–965. https://doi.org/https://doi.org/10.1016/j.envpol.2018.10.111
- Kaya, A. T., Yurtsever, M., & Bayraktar, S. C. (2018). Ubiquitous exposure to microfiber pollution in the air. European Physical Journal Plus, 133, 488.
- Kedzierski, M., Falcou-Prefol, M., Kerros, M. E., Henry, M., Pedrotti, M. L., & Bruzaud, S. (2019). A machine learning algorithm for high throughput identification of FTIR spectra: Application on microplastics collected in the Mediterranean Sea. Chemosphere, 234, 242–251. https://doi.org/https://doi.org/10.1016/j.chemosphere.2019.05.113
- Khan, F. R., Boyle, D., Chang, E., & Bury, N. R. (2017). Do polyethylene microplastic beads alter the intestinal uptake of Ag in rainbow trout (Oncorhynchus mykiss)? Analysis of the MP vector effect using in vitro gut sacs. Environmental Pollution, 231, 200–206. https://doi.org/https://doi.org/10.1016/j.envpol.2017.08.019
- Khan, F. R., Syberg, K., Shashoua, Y., & Bury, N. R. (2015). Influence of polyethylene microplastic beads on the uptake and localization of silver in zebrafish (Danio rerio). Environmental Pollution, 206, 73–79. https://doi.org/https://doi.org/10.1016/j.envpol.2015.06.009
- Kim, I.-S., Chae, D.-H., Kim, S.-K., Choi, S., & Woo, S.-B. (2015). Factors influencing the spatial variation of microplastics on high-tidal coastal beaches in Korea. Archives of Environmental Contamination and Toxicology, 69(3), 299–309. https://doi.org/https://doi.org/10.1007/s00244-015-0155-6
- Kim, J. S., Lee, H. J., Kim, S. K., & Kim, H. J. (2018). Global pattern of microplastics (MPs) in commercial food grade salts: Sea salt as an indicator of seawater MP pollution. Environmental Science & Technology, 52(21), 12819–12828. https://doi.org/https://doi.org/10.1021/acs.est.8b04180
- Klein, S., Worch, E., & Knepper, T. P. (2015). Occurrence and spatial distribution of microplastics in river shore sediments of the Rhine-Main area in Germany. Environmental Science & Technology, 49(10), 6070–6076. https://doi.org/https://doi.org/10.1021/acs.est.5b00492
- Koelmans, A. A. (2015). Modeling the role of microplastics in bioacuumulation of organic chemicals to marine aquatic organisms: A critical review. In M. Bergmann, L. Gutow, & M. Klages (Eds.), Marine anthropogenic litter (pp. 309–324). Springer.
- Koelmans, A. A., Bakir, A., Burton, G. A., & Janssen, C. R. (2016). Microplastic as a vector for chemicals in the aquatic environment: Critical review and model-supported reinterpretation of empirical studies. Environmental Science & Technology, 50(7), 3315–3326. https://doi.org/https://doi.org/10.1021/acs.est.5b06069
- Koelmans, A. A., Nor, N. H. M., Hermsen, E., Kooi, M., Mintenig, S. M., & France, J. D. (2019). Microplastics in freshwaters and drinking water: Critical review and assessment of data quality. Water Research, 155, 410–422. https://doi.org/https://doi.org/10.1016/j.watres.2019.02.054
- Kokalj, A. J., Horvat, P., Skalar, T., & Krzan, A. (2018). Plastic bag and facial cleanser derived microplastic do not affect feeding behaviour and energy reserves of terrestrial isopods. Science of the Total Environment, 615, 761–766. https://doi.org/https://doi.org/10.1016/j.scitotenv.2017.10.020
- Kolandhasamy, P., Su, L., Li, J., Qu, X., Jabeen, K., & Shi, H. (2018). Adherence of microplastics to soft tissue of mussels: A novel way to uptake microplastics beyond ingestion. The Science of the Total Environment, 610–611, 635–640. https://doi.org/https://doi.org/10.1016/j.scitotenv.2017.08.053
- Kooi, M., Nes, E. H. V., Scheffer, M., & Koelmans, A. A. (2017). Ups and downs in the ocean: Effects of biofouling on the vertical transport of microplastics. Environmental Science & Technology, 51(14), 7963–7971. https://doi.org/https://doi.org/10.1021/acs.est.6b04702
- Koongolla, J. B., Andrady, A. L., Kumara, P. B. T. P., & Gangabadage, C. S. (2018). Evidence of microplastics pollution in coastal beaches and waters in southern Sri Lanka. Marine Pollution Bulletin, 137, 277–284. https://doi.org/https://doi.org/10.1016/j.marpolbul.2018.10.031
- Korez, S., Gutow, L., & Saborowski, R. (2019). Microplastics at the strandlines of Slovenian beaches. Marine Pollution Bulletin, 145, 334–342. https://doi.org/https://doi.org/10.1016/j.marpolbul.2019.05.054
- Kosore, C., Ojwang, L., Maghanga, J., Kamau, J., Kimeli, A., Omukoto, J., Ngisiag’e, N., Mwaluma, J., Ong’ada, H., Magori, C., & Ndirui, E. (2018). Occurrence and ingestion of microplastics by zooplankton in Kenya’s marine environment: First documented evidence. African Journal of Marine Science, 40(3), 225–234. https://doi.org/https://doi.org/10.2989/1814232X.2018.1492969
- Krishnakumar, S., Srinivasalu, S., Saravanan, P., Vidyasakar, A., & Magesh, N. S. (2018). A preliminary study on coastal debris in Nallathanni Island, Gulf of Mannar Biosphere Reserve, Southeast coast of India. Marine Pollution Bulletin, 131, 547–551. https://doi.org/https://doi.org/10.1016/j.marpolbul.2018.04.026
- Kroon, F., Motti, C., Jensen, L. H., & Berry, K. L. E. (2018). Classification of marine microdebris: A review and case study on fish from the Great Barrier Reef, Australia. Scientific Reports, 8(1), 16422. https://doi.org/https://doi.org/10.1038/s41598-018-34590-6
- Kroon, F., Motti, C., Talbot, S., Sobral, P., & Puotinen, M. (2018). A workflow for improving estimates of microplastic contamination in marine waters: A case study from North-Western Australia. Environmental Pollution, 238, 26–38. https://doi.org/https://doi.org/10.1016/j.envpol.2018.03.010
- Kuhn, S., Oyen, A. V., Booth, A. M., Meijboom, A., & Franeker, J. A. V. (2018). Marine microplastic: Preparation of relevant test materials for laboratory assessment of ecosystem impacts. Chemosphere, 213, 103–113. https://doi.org/https://doi.org/10.1016/j.chemosphere.2018.09.032
- Kuhn, S., Schaafsma, F. L., Werven, B. V., Flores, H., Bergmann, M., Egelkraut-Holtus, M., Tekman, M. B., & Franeker, J. A. (2018). Plastic ingestion by juvenile polar cod (Boreogadus saida) in the Arctic Ocean. Polar Biology, 41(6), 1269–1278. https://doi.org/https://doi.org/10.1007/s00300-018-2283-8
- Kuklinski, P., Wicikowski, L., Koper, M., Grala, T., Leniec-Koper, H., Barasiński, M., Talar, M., Kamiński, I., Kibart, R., & Małecki, W. (2019). Offshore surface waters of Antarctica are free of microplastics, as revealed by a circum-Antarctic study. Marine Pollution Bulletin, 149, 110573. https://doi.org/https://doi.org/10.1016/j.marpolbul.2019.110573
- Kumar, V. E., Ravikumar, G., & Jeyasanta, K. I. (2018). Occurrence of microplastic in fishes from two landing sites in Tuticorin, South east coast of India. Marine Pollution Bulletin, 135, 889–894. https://doi.org/https://doi.org/10.1016/j.marpolbul.2018.08.023
- Kunz, A., Walther, B. A., Lowemark, L., & Lee, Y. C. (2016). Distribution and quantity of microplastic on sandy beaches along the northern coast of Taiwan. Marine Pollution Bulletin, 111(1–2), 126–135. https://doi.org/https://doi.org/10.1016/j.marpolbul.2016.07.022
- Lacerda, A. L. F., Rodrigues, L. S., van Sebille, E., Rodrigues, F. L., Ribeiro, L., Secchi, E. R., Kessler, F., & Proietti, M. C. (2019). Plastics in sea surface waters around the Antarctic Peninsula. Scientific Reports, 9(1), 3977. https://doi.org/https://doi.org/10.1038/s41598-019-40311-4
- Lagarde, F., Olivier, O., Zanella, M., Daniel, P., Hiard, S., & Caruso, A. (2016). Microplastic interactions with freshwater microalgae: Hetero-aggregation and changes in plastic density appear strongly dependent on polymer type. Environmental Pollution, 215, 331–339. https://doi.org/https://doi.org/10.1016/j.envpol.2016.05.006
- Lahens, L., Strady, E., Kieu-Le, T.-C., Dris, R., Boukerma, K., Rinnert, E., Gasperi, J., & Tassin, B. (2018). Macroplastic and microplastic contamination assessment of a tropical river (Saigon River, Vietnam) transversed by a developing megacity. Environmental Pollution, 236, 661–671. https://doi.org/https://doi.org/10.1016/j.envpol.2018.02.005
- Lares, M., Ncibi, M. C., Sillanpaa, M., & Sillanpaa, M. (2018). Occurrence, identification and removal of microplastic particles and fibers in conventional activated sludge process and advanced MBR technology. Water Research, 133, 236–246. https://doi.org/https://doi.org/10.1016/j.watres.2018.01.049
- Lares, M., Ncibi, M. C., Sillanpaa, M., & Sillanpaa, M. (2019). Inter-comparison study on commonly used methods to determine microplastics in wastewater and sludge samples. Environmental Science and Pollution Research, 26(12), 12109–12122. https://doi.org/https://doi.org/10.1007/s11356-019-04584-6
- Leads, R. R., & Weinstein, J. E. (2019). Occurrence of tire wear particles and other microplastics within the tributaries of the Charleston Harbor Estuary, South Carolina, USA. Marine Pollution Bulletin, 145, 569–582. https://doi.org/https://doi.org/10.1016/j.marpolbul.2019.06.061
- Lebreton, L., Slat, B., Ferrari, F., Sainte-Rose, B., Aitken, J., Marthouse, R., Hajbane, S., Cunsolo, S., Schwarz, A., Levivier, A., Noble, K., Debeljak, P., Maral, H., Schoeneich-Argent, R., Brambini, R., & Reisser, J. (2018). Evidence that the Great Pacific Garbage patch is rapidly accumulating plastic. Scientific Reports, 8(1), 4666. https://doi.org/https://doi.org/10.1038/s41598-018-22939-w
- Lee, H., & Kim, Y. (2018). Treatment characteristics of microplastics at biological sewage treatment facilities in Korea. Marine Pollution Bulletin, 137, 1–8. https://doi.org/https://doi.org/10.1016/j.marpolbul.2018.09.050
- Lee, H., Kunz, A., Shim, W. J., & Walther, B. A. (2019). Microplastic contamination of table salts from Taiwan, including a global review. Scientific Reports, 9(1), 10145. https://doi.org/https://doi.org/10.1038/s41598-019-46417-z
- Lefebvre, C., Saraux, C., Heitz, O., Nowaczyk, A., & Bonnet, D. (2019). Microplastics FTIR characterisation and distribution in the water column and digestive tracts of small pelagic fish in the Gulf of Lions. Marine Pollution Bulletin, 142, 510–519. https://doi.org/https://doi.org/10.1016/j.marpolbul.2019.03.025
- Lei, L., Wu, S., Lu, S., Liu, M., Song, Y., Fu, Z., Shi, H., Raley-Susman, K. M., & He, D. (2018). Microplastic particles cause intestinal damage and other adverse effects in zebrafish Danio rerio and nematode Caenorhabditis elegans. The Science of the Total Environment, 619–620, 1–8. https://doi.org/https://doi.org/10.1016/j.scitotenv.2017.11.103
- Leslie, H. A., Brandsma, S. H., van Velzen, M. J. M., & Vethaak, A. D. (2017). Microplastics en route: Field measurements in the Dutch river delta and Amsterdam canals, wastewater treatment plants, North Sea sediments and biota. Environmental International, 101, 133–142. https://doi.org/https://doi.org/10.1016/j.envint.2017.01.018
- Li, H.-X., Ma, L.-S., Lin, L., Ni, Z.-X., Xu, X.-R., Shi, H.-H., Yan, Y., Zheng, G.-M., & Rittschof, D. (2018). Microplastics in oysters Saccostrea cucullata along the Pearl river estuary, China. Environmental Pollution, 236, 619–625. https://doi.org/https://doi.org/10.1016/j.envpol.2018.01.083
- Li, J., Green, C., Reynolds, A., Shi, H., & Rotchell, J. M. (2018). Microplastics in mussels sampled from coastal waters and supermarkets in the United Kingdom. Environmental Pollution, 241, 35–44. https://doi.org/https://doi.org/10.1016/j.envpol.2018.05.038
- Li, J., Qu, X., Su, L., Zhang, W., Yang, D., Kolandhasamy, P., Li, D., & Shi, H. (2016). Microplastics in mussels along the coastal waters of China. Environmental Pollution, 214, 177–184. https://doi.org/https://doi.org/10.1016/j.envpol.2016.04.012
- Li, J., Yang, D., Li, L., Jabeen, K., & Shi, H. (2015). Microplastics in commercial bivalves from China. Environmental Pollution, 207, 190–195. https://doi.org/https://doi.org/10.1016/j.envpol.2015.09.018
- Li, J., Zhang, H., Zhang, K., Yang, R., Li, R., & Li, Y. (2018). Characterisation, source, and retention of microplastic in sandy beaches and mangrove wetlands of the Qinzhou Bay, China. Marine Pollution Bulletin, 136, 401–406. https://doi.org/https://doi.org/10.1016/j.marpolbul.2018.09.025
- Li, L., Su, L., Cai, H., Rochman, C. M., Li, Q., Kolandhasamy, P., Peng, J., & Shi, H. (2019). The uptake of microfibers by freshwater Asian clams (Corbicula fluminea) varies based upon physicochemical properties. Chemosphere, 221, 107–114. https://doi.org/https://doi.org/10.1016/j.chemosphere.2019.01.024
- Li, Q., Sun, C., Wang, Y., Cai, H., Li, L., Li, J., & Shi, H. (2019). Fusion of microplastics into the mussel byssus. Environmental Pollution, 252, 420–426. https://doi.org/https://doi.org/10.1016/j.envpol.2019.05.093
- Li, Q., Wu, J., Zhao, X., Gu, X., & Rong, J. (2019). Separation and identification of microplastics from soil and sewage sludge. Environmental Pollution, 254(Pt B), 113076. https://doi.org/https://doi.org/10.1016/j.envpol.2019.113076
- Li, X., Chen, L., Mei, Q., Dong, B., Dai, X., Ding, G., & Zeng, E. Y. (2018). Microplastics in sewage sludge from the wastewater treatment plants in China. Water Research, 142, 75–85. https://doi.org/https://doi.org/10.1016/j.watres.2018.05.034
- Li, X., Mei, Q., Chen, L., Zhang, H., Dong, B., Dai, X., He, C., & Zhou, J. (2019). Enhancement in adsorption potential of microplastics in sewage sludge for metal pollutants after the wastewater treatment process. Water Research, 157, 228–237. https://doi.org/https://doi.org/10.1016/j.watres.2019.03.069
- Li, Y., Wolanski, E., Dai, Z., Lambrechts, J., Tang, C., & Zhang, H. (2018). Trapping of plastics in semi-enclosed seas: Insight from the Bohai Sea, China. Marine Pollution Bulletin, 137, 509–517. https://doi.org/https://doi.org/10.1016/j.marpolbul.2018.10.038
- Lin, L., Zuo, L.-Z., Peng, J.-P., Cai, L.-Q., Fok, L., Yan, Y., Li, H.-X., & Xu, X.-R. (2018). Occurrence and distribution of microplastics in an urban river: A case study in the Pearl River along Guangzhou city, China. Science of the Total Environment, 644, 375–381. https://doi.org/https://doi.org/10.1016/j.scitotenv.2018.06.327
- Liu, C., Li, J., Zhang, Y., Wang, L., Deng, J., Gao, Y., Yu, L., Zhang, J., & Sun, H. (2019). Widespread distribution of PET and PC microplastics in dust in urban China and their estimated human exposure. Environmental International, 128, 116–124. https://doi.org/https://doi.org/10.1016/j.envint.2019.04.024
- Liu, F., Olesen, K. B., Borregaard, A. R., & Vollertsen, J. (2019). Microplastics in urban and highway stormwater retention ponds. Science of the Total Environment, 671, 992–1000. https://doi.org/https://doi.org/10.1016/j.scitotenv.2019.03.416
- Liu, K., Wang, X., Fang, T., Xu, P., Zhu, L., & Li, D. (2019). Source and potential risk assessment of suspended atmospheric microplastics in Shanghai. The Science of the Total Environment, 675, 462–471. https://doi.org/https://doi.org/10.1016/j.scitotenv.2019.04.110
- Liu, K., Wang, X., Wei, N., Song, Z., & Li, D. (2019). Accurate quantification and transport estimation of suspended atmospheric microplastics in megacities: Implications for human health. Environmental International, 132, 105127. https://doi.org/https://doi.org/10.1016/j.envint.2019.105127
- Liu, M., Lu, S., Song, Y., Lei, L., Hu, J., Lv, W., Zhou, W., Cao, C., Shi, H., Yang, X., & He, D. (2018). Microplastic and mesoplastic pollution in farmland soils in suburbs of Shanghai, China. Environmental Pollution, 242, 855–862. https://doi.org/https://doi.org/10.1016/j.envpol.2018.07.051
- Liu, M., Song, Y., Lu, S., Qiu, R., Hu, J., Li, X., Bigalke, M., Shi, H., & He, D. (2019). A method for extracting soil microplastics through circulation of sodium bromide solutions. The Science of the Total Environment, 691, 341–347. https://doi.org/https://doi.org/10.1016/j.scitotenv.2019.07.144
- Lo, H.-S., Xu, X., Wong, C.-Y., & Cheung, S.-G. (2018). Comparisons of microplastic pollution between mudflats and sandy beaches in Hong Kong. Environmental Pollution, 236, 208–217. https://doi.org/https://doi.org/10.1016/j.envpol.2018.01.031
- Loder, M. G. J., Kuczera, M., Mintenig, S., Lorenz, C., & Gerdts, G. (2015). Focal Plane Array detector based Micro-Fourier-Transform Infrared Imaging for the analysis of microplastics in environmental samples. Environmental Chemistry, 12(5), 563–581. https://doi.org/https://doi.org/10.1071/EN14205
- Lorenz, C., Roscher, L., Meyer, M. S., Hildebrandt, L., Prume, J., Loder, M. G. J., Primpke, S., & Gerdts, G. (2019). Spatial distribution of microplastics in sediments and surface waters of the southern North Sea. Environmental Pollution, 252, 1719–1729. https://doi.org/https://doi.org/10.1016/j.envpol.2019.06.093
- Lourenco, P. M., Serra-Goncalves, C., Ferreira, J. L., Catry, T., & Granadeiro, J. P. (2017). Plastic and other microfibers in sediments, macroinvertebrates and shorebirds from three intertidal wetlands of southern Europe and West Africa. Environmental Pollution, 231, 123–133. https://doi.org/https://doi.org/10.1016/j.envpol.2017.07.103
- Luo, W., Su, L., Craig, N. J., Du, F., Wu, C., & Shi, H. (2019). Comparison of microplastic pollution in different water bodies from urban creeks to coastal waters. Environmental Pollution, 246, 174–182. https://doi.org/https://doi.org/10.1016/j.envpol.2018.11.081
- Lusher, A. L., Hernandez-Milian, G., O'Brien, J., Berrow, S., O'Connor, I., & Officer, R. (2015). Microplastic and macroplastic ingestion by a deep diving, oceanic cetacean: The True’s beaked whale Mesoplodon mirus. Environmental Pollution, 199, 185–191. https://doi.org/https://doi.org/10.1016/j.envpol.2015.01.023
- Lusher, A. L., McHugh, M., & Thompson, R. C. (2013). Occurrence of microplastics in the gastrointestinal tract of pelagic and demersal fish from the English Channel. Marine Pollution Bulletin, 67(1–2), 94–99. https://doi.org/https://doi.org/10.1016/j.marpolbul.2012.11.028
- Lusher, A. L., Welden, N. A., Sobral, P., & Cole, M. (2017). Sampling, isolating and identifying microplastics ingested by fish and invertebrates. Analytical Methods, 9(9), 1346–1360. https://doi.org/https://doi.org/10.1039/C6AY02415G
- Lv, W., Zhou, W., Lu, S., Huang, W., Yuan, Q., Tian, M., Lv, W., & He, D. (2019). Microplastic pollution in rice-fish co-culture system: A report of three farmland stations in Shanghai, China. Science of the Total Environment, 652, 1209–1218. https://doi.org/https://doi.org/10.1016/j.scitotenv.2018.10.321
- Lv, X., Dong, Q., Zuo, Z., Liu, Y., Huang, X., & Wu, W.-M. (2019). Microplastics in a municipal wastewater treatment plant: Fate, dynamic distribution, removal efficiencies, and control strategies. Journal of Cleaner Production, 225, 579–586. https://doi.org/https://doi.org/10.1016/j.jclepro.2019.03.321
- Maes, T., Jessop, R., Wellner, N., Haupt, K., & Mayes, A. (2017). A rapid-screening approach to detect and quantify microplastics based on fluorescent tagging with Nile Red. Scientific Reports, 7, 44501. https://doi.org/https://doi.org/10.1038/srep44501
- Magni, S., Binelli, A., Pittura, L., Avio, C. G., Torre, C. D., Parenti, C. C., Gorbi, S., & Regoli, F. (2019). The fate of microplastics in an Italian Wastewater Treatment Plant. Science of the Total Environment, 652, 602–610. https://doi.org/https://doi.org/10.1016/j.scitotenv.2018.10.269
- Mahon, A. M., O'Connell, B., Healy, M. G., O'Connor, I., Officer, R., Nash, R., & Morrison, L. (2017). Microplastics in sewage sludge: Effects of treatment. Environmental Science & Technology, 51(2), 810–818. https://doi.org/https://doi.org/10.1021/acs.est.6b04048
- Mai, L., Bao, L.-J., Shi, L., Liu, L.-Y., & Zeng, E. Y. (2018). Polycyclic aromatic hydrocarbons affiliated with microplastics in surface waters of Bohai and Huanghai seas, China. Environmental Pollution, 241, 834–840. https://doi.org/https://doi.org/10.1016/j.envpol.2018.06.012
- Mai, L., You, S.-N., He, H., Bao, L.-J., Liu, L.-Y., & Zeng, E. Y. (2019). Riverine microplastic pollution in the Pearl River delta, China: Are modelled estimates accurate? Environmental Science & Technology, 53(20), 11810–11817. https://doi.org/https://doi.org/10.1021/acs.est.9b04838
- Majewsky, M., Bitter, H., Eiche, E., & Horn, H. (2016). Determination of microplastic polyethylene (PE) and polypropylene (PP) in environmental samples using thermal analysis (TGA-DSC). The Science of the Total Environment, 568, 507–511. https://doi.org/https://doi.org/10.1016/j.scitotenv.2016.06.017
- Mani, T., Hauk, A., Walter, U., & Burkhardt-Holm, P. (2015). Microplastics profile along the Rhine River. Scientific Reports, 5, 17988. https://doi.org/https://doi.org/10.1038/srep17988
- Mani, T., Blarer, P., Storck, F. R., Pittroff, M., Wernicke, T., & Burkhardt-Holm, P. (2019). Repeated detection of polystyrene microbeads in the Lower Rhine River. Environmental Pollution, 245, 634–641. https://doi.org/https://doi.org/10.1016/j.envpol.2018.11.036
- Mani, T., Primpke, S., Lorenz, C., Gerdts, G., & Burkhardt-Holm, P. (2019). Microplastic pollution in benthic midstream sediments of the Rhine river. Environmental Science & Technology, 53(10), 6053–6062. https://doi.org/https://doi.org/10.1021/acs.est.9b01363
- Markic, A., Gaertner, J.-C., Gaertner-Mazouni, N., & Koelmans, A. A. (2020). Plastic ingestion by marine fish in the wild. Critical Reviews in Environmental Science and Technology, 50(7), 657–697. https://doi.org/https://doi.org/10.1080/10643389.2019.1631990
- Markic, A., Niemand, C., Bridson, J. B., Mazouni-Gaertner, N., Gaertner, J.-C., Eriksen, M., & Bowen, M. (2018). Double trouble in the South Pacific subtropical gyre: Increased plastic ingestion by fish in the oceanic accumulation zone. Marine Pollution Bulletin, 136, 547–564. https://doi.org/https://doi.org/10.1016/j.marpolbul.2018.09.031
- Martins, J., & Sobral, P. (2011). Plastic marine debris on the Portuguese coastline: A matter of size? Marine Pollution Bulletin, 62(12), 2649–2653. https://doi.org/https://doi.org/10.1016/j.marpolbul.2011.09.028
- Martin, J., Lusher, A., Thompson, R. C., & Morley, A. (2017). The deposition and accumulation of microplastics in marine sediments and bottom water from the Irish continental shelf. Scientific Reports, 7(1), 10772. https://doi.org/https://doi.org/10.1038/s41598-017-11079-2
- Masia, P., Ardura, A., & Garcia-Vazquez, E. (2019). Microplastics in special protected areas for migratory birds in the Bay of Biscay. Marine Pollution Bulletin, 146, 993–1001. https://doi.org/https://doi.org/10.1016/j.marpolbul.2019.07.065
- Mason, S. A., Kammin, L., Eriksen, M., Aleid, G., Wilson, S., Box, C., Williamson, N., & Riley, A. (2016). Pelagic plastic pollution within the surface waters of Lake Michigan, USA. Journal of Great Lakes Research, 42(4), 753–759. https://doi.org/https://doi.org/10.1016/j.jglr.2016.05.009
- Matsuguma, Y., Takada, H., Kumata, H., Kanke, H., Sakurai, S., Suzuki, T., Itoh, M., Okazaki, Y., Boonyatumanond, R., Zakaria, M. P., Weerts, S., & Newman, B. (2017). Microplastics in sediment cores from Asia and Africa as indicators of temporal trends in plastic pollution. Archives of Environmental Contamination and Toxicology, 73(2), 230–239. https://doi.org/https://doi.org/10.1007/s00244-017-0414-9
- Mauro, R. D., Kupchik, M. J., & Benfield, M. C. (2017). Abundant plankton-sized microplastic particles in shelf waters of the northern Gulf of Mexico. Environmental Pollution, 230, 798–809. https://doi.org/https://doi.org/10.1016/j.envpol.2017.07.030
- McGoran, A., Cowie, P. R., Clark, P. F., McEvoy, J. P., & Morritt, D. (2018). Ingestion of plastic by fish: A comparison of Thames estuary and Fifth of Clyde populations. Marine Pollution Bulletin, 137, 12–23. https://doi.org/https://doi.org/10.1016/j.marpolbul.2018.09.054
- McGoran, A. R., Clark, P. F., & Morritt, D. (2017). Presence of microplastic in the digestive tracts of European flounder, Platichthys flesus, and European smelt, Osmerus eperlanus, from the River Thames. Environmental Pollution, 220, 744–751. https://doi.org/https://doi.org/10.1016/j.envpol.2016.09.078
- Mecozzi, M., Pietroletti, M., & Monakhova, Y. B. (2016). FTIR spectroscopy supported by statistical techniques for the structural characterisation of plastic debris in the marine environment: Application to monitoring studies. Marine Pollution Bulletin, 106(1–2), 155–161. https://doi.org/https://doi.org/10.1016/j.marpolbul.2016.03.012
- Miller, R. Z., Watts, A. J. R., Winslow, B. O., Galloway, T. S., & Barrows, A. P. W. (2017). Mountains to the sea: River study of plastic and non-plastic microfiber pollution in the northeast USA. Marine Pollution Bulletin, 124(1), 245–251. https://doi.org/https://doi.org/10.1016/j.marpolbul.2017.07.028
- Mintenig, S. M., Int-Veen, I., Loder, M. G. J., Primpke, S., & Gerdts, G. (2017). Identification of microplastic in effluents of waste water treatment plants using focal plane array-based micro-Fourier-transform infrared imagining. Water Research, 108, 365–372. https://doi.org/https://doi.org/10.1016/j.watres.2016.11.015
- Mintenig, S. M., Loder, M. G. J., Primpke, S., & Gerdts, G. (2019). Low numbers of microplastics detected in drinking water from ground water sources. The Science of the Total Environment, 648, 631–635. https://doi.org/https://doi.org/10.1016/j.scitotenv.2018.08.178
- Mistri, M., Infantini, V., Scoponi, M., Granata, T., Moruzzi, L., Massara, F., Donati, M. D., & Munari, C. (2017). Small plastic debris in sediments from the Central Adriatic Sea: Types, occurrence and distribution. Marine Pollution Bulletin, 124(1), 435–440. https://doi.org/https://doi.org/10.1016/j.marpolbul.2017.07.063
- Mistri, M., Infantini, V., Scoponi, M., Granata, T., Moruzzi, L., Massara, F., Donati, M. D., & Munari, C. (2018). Microplastics in marine sediments in the area of Pianosa Island (Central Adriatic Sea). Rendiconti Lincei. Scienze Fisiche e Naturali, 29(4), 805–809. https://doi.org/https://doi.org/10.1007/s12210-018-0736-1
- Mohd Khalik, W. M. A. W., Ibrahim, Y. S., Anuar, S. T., Govindasamy, S., & Baharuddin, N. F. (2018). Microplasics analysis in Malaysian marine waters: A field study of Kuala Nerus and Kuantan. Marine Pollution Bulletin, 135, 451–457. https://doi.org/https://doi.org/10.1016/j.marpolbul.2018.07.052
- Mohsen, M., Wang, Q., Zhang, L., Sun, L., Lin, C., & Yang, H. (2019). Heavy metals in sediment, microplastic and sea cucumber Apostichopus japonics from farms in China. Marine Pollution Bulletin, 143, 42–49. https://doi.org/https://doi.org/10.1016/j.marpolbul.2019.04.025
- Morgana, S., Ghigliotti, L., Estevez-Calvar, N., Stifanese, R., Wieckzorek, A., Doyle, T., Christiansen, J. S., Faimali, M., & Garaventa, F. (2018). Microplastics in Arctic: A case study with sub-surface water and fish samples off Northeast Greenland. Environmental Pollution, 242(Pt B), 1078–1086. https://doi.org/https://doi.org/10.1016/j.envpol.2018.08.001
- Mu, J., Qu, L., Jin, F., Zhang, S., Fang, C., Ma, X., Zhang, W., Huo, C., Cong, Y., & Wang, J. (2019). Abundance and distribution of microplastics in the surface sediments from the northern Bering and Chukchi Seas. Environmental Pollution, 245, 122–130. https://doi.org/https://doi.org/10.1016/j.envpol.2018.10.097
- Mu, J., Zhang, S., Qu, L., Jin, F., Fang, C., Ma, X., Zhang, W., & Wang, J. (2019). Microplastics abundance and characteristics in surface waters from the Northwest Pacific, the Bering Sea. Marine Pollution Bulletin, 143, 58–65. https://doi.org/https://doi.org/10.1016/j.marpolbul.2019.04.023
- Mugilarasan, M., Venkatachalapathy, R., Sharmila, N., & Gurumoorthi, K. (2017). Occurrence of microplastic resin pellets from Chennai and Tinnakkara Island: Towards the establishment of background level for plastic pollution. Indian Journal of Geo Marine Sciences, 46, 1210–1212.
- Muhlschlegel, P., Hauk, A., Walter, U., & Sieber, R. (2017). Lack of evidence for microplastic contamination in honey. Food Additives and Contaminants: Part A, 34(11), 1982–1989.
- Mukherjee, S., & Gowen, A. (2015). A review of recent trends in polymer characterization using non-destructive vibrational spectroscopic modalities and chemical imaging. Analytica Chimica Acta, 895, 12–34. https://doi.org/https://doi.org/10.1016/j.aca.2015.09.006
- Munari, C., Infantini, V., Scoponi, M., Rastelli, E., Corinaldesi, C., & Mistri, M. (2017). Microplastics in the sediments of Terra Nova Bay (Ross Sea, Antarctica). Marine Pollution Bulletin, 122(1–2), 161–165. https://doi.org/https://doi.org/10.1016/j.marpolbul.2017.06.039
- Murphy, F., Ewins, C., Carbonnier, F., & Quinn, B. (2016). Wastewater treatment works (WwTW) as a source of microplastics in the Aquatic Environment. Environmental Science & Technology, 50(11), 5800–5808. https://doi.org/https://doi.org/10.1021/acs.est.5b05416
- Murphy, F., Russell, M., Ewins, C., & Quinn, B. (2017). The uptake of macroplastics & microplastic by demersal & pelagic fish in the Northeast Atlantic around Scotland. Marine Pollution Bulletin, 122(1–2), 353–359. https://doi.org/https://doi.org/10.1016/j.marpolbul.2017.06.073
- Nabizadeh, R., Sajadi, M., Rastkari, N., & Yaghmaeian, K. (2019). Microplastic pollution on the Persian Gulf shoreline: A case study of Bandar Abbas city, Hormozgan Province, Iran. Marine Pollution Bulletin, 145, 536–546. https://doi.org/https://doi.org/10.1016/j.marpolbul.2019.06.048
- Naidoo, T., Glassom, D., & Smit, A. J. (2015). Plastic pollution in five urban estuaries of KwaZulu-Natal, South Africa. Marine Pollution Bulletin, 101(1), 473–480. https://doi.org/https://doi.org/10.1016/j.marpolbul.2015.09.044
- Naidoo, T., Goordiyal, K., & Glassom, D. (2017). Are nitric acid (HNO3) digestions efficient in isolating microplastics from Juvenile fish?. Water Air and Soil Pollution, 228, 470.
- Naji, A., Esmaili, Z., & Khan, F. R. (2017). Plastic debris and microplastics along the beaches of the Strait of Hormuz, Persian Gulf. Marine Pollution Bulletin, 114(2), 1057–1062. https://doi.org/https://doi.org/10.1016/j.marpolbul.2016.11.032
- Naji, A., Esmaili, Z., Mason, S. A., & Vethaak, A. D. (2017). The occurrence of microplastic contamination in littoral sediments of the Persian Gulf, Iran. Environmental Science and Pollution Research, 24(25), 20459–20468. https://doi.org/https://doi.org/10.1007/s11356-017-9587-z
- Naji, A., Nuri, M., & Vethaak, A. D. (2018). Microplastics contamination in molluscs from the northern part of the Persian Gulf. Environmental Pollution, 235, 113–120. https://doi.org/https://doi.org/10.1016/j.envpol.2017.12.046
- Naji, A., Nuri, M., Amiri, P., & Niyogi, S. (2019). Small microplastic particles (S-MPPs) in sediments of mangrove ecosystem on the northern coast of the Persian Gulf. Marine Pollution Bulletin, 146, 305–311. https://doi.org/https://doi.org/10.1016/j.marpolbul.2019.06.033
- Nakao, S., Ozaki, A., Yamazaki, K., Masumoto, K., Nakatani, T., & Sakiyama, T. (2020). Microplastics contamination in tidelands of the Osaka Bay area in western Japan. Water and Environment Journal, 34(3), 474–488. https://doi.org/https://doi.org/10.1111/wej.12541
- Nazareth, M., Marques, M. R. C., Leite, M. C. A., & Castro, I. B. (2019). Commercial plastics claiming biodegradable status: Is this also accurate for marine environments? Journal of Hazardous Materials, 366, 714–722. https://doi.org/https://doi.org/10.1016/j.jhazmat.2018.12.052
- Nelms, S. E., Barnett, J., Brownlow, A., Davison, N. J., Deaville, R., Galloway, T. S., Lindeque, P. K., Santillo, D., & Godley, B. J. (2019). Microplastics in marine mammals stranded around the British coast: Ubiquitous but transitory? Scientific Reports, 9(1), 1075. https://doi.org/https://doi.org/10.1038/s41598-018-37428-3
- Nelms, S. E., Galloway, T. S., Godley, B. J., Jarvis, D. S., & Lindeque, P. K. (2018). Investigating microplastic trophic transfer in marine top predators. Environmental Pollution, 238, 999–1007. https://doi.org/https://doi.org/10.1016/j.envpol.2018.02.016
- Nelms, S. E., Parry, H. E., Bennett, K. A., Galloway, T. S., Godley, B. J., Santillo, D., & Lindeque, P. K. (2019). What goes in, must come out: Combining scat-based molecular diet analysis and quantification of ingested microplastics in a marine top predator. Methods in Ecology and Evolution, 10(10), 1712–1711. https://doi.org/https://doi.org/10.1111/2041-210X.13271
- Neves, D., Sobral, P., Ferreira, J. L., & Pereira, T. (2015). Ingestion of microplastics by commercial fish off the Portuguese coast. Marine Pollution Bulletin, 101(1), 119–126. https://doi.org/https://doi.org/10.1016/j.marpolbul.2015.11.008
- Nishikida, K., & Coates, J. (2003). Infrared and Raman analysis of polymer. In H. Lobo, & J. V. Bonilla (Eds.), Handbook of plastics analysis (pp. 186–316). Marcel Dekker, Inc.
- Noda, I., Dowrey, A. E., Haynes, J. L., & Marcott, C. (2007). Group frequency assignments for major infrared bands observed in common synthetic polymers. In J. E. Mark (Ed.), Physical properties of polymers handbook (pp. 395–406). Springer.
- Nor, N. H. M., & Obbard, J. P. (2014). Microplastics in Singapore’s coastal mangrove ecosystems. Marine Pollution Bulletin, 79(1–2), 278–283. https://doi.org/https://doi.org/10.1016/j.marpolbul.2013.11.025
- O'Connor, J. D., Mahon, A. M., Ramsperger, A. F. R. M., Trotter, B., Redondo‐Hasselerharm, P. E., Koelmans, A. A., Lally, H. T., & Murphy, S. (2020). Microplastics in freshwater biota: A critical review of isolation, characterisation, and assessment methods. Global Challenges, 4(6), 1800118. https://doi.org/https://doi.org/10.1002/gch2.201800118
- Obbard, R. W., Sadri, S., Wong, Y. Q., Khitun, A. A., Baker, I., & Thompson, R. C. (2014). Global warming releases microplastic legacy frozen in Arctic Sea ice. Earth’s Future, 2(6), 315–320. https://doi.org/https://doi.org/10.1002/2014EF000240
- Olesen, K. B., Stephansen, D. A., Alst, N. V., & Vollertsen, J. (2019). Microplastics in a stormwater pond. Water, 11, 1466. https://doi.org/https://doi.org/10.3390/w11071466
- Olivatto, G. P., Martins, M. C. T., Montagner, C. C., Henry, T. B., & Carreira, R. S. (2019). Microplastic contamination in surface waters in Guanabara Bay, Rio de Janeiro, Brazil. Marine Pollution Bulletin, 139, 157–162. https://doi.org/https://doi.org/10.1016/j.marpolbul.2018.12.042
- Okoffo, E. D., O'Brien, S., O'Brien, J. W., Tscharke, B. J., & Thomas, K. V. (2019). Wastewater treatment plants as a source of plastics in the environment: A review of occurrence, methods for identification, quantification and fate. Environmental Science: Water Research & Technology, 5(11), 1908–1931. https://doi.org/https://doi.org/10.1039/C9EW00428A
- Ory, N., Chagnon, C., Felix, F., Fernandez, C., Ferreira, J. L., Gallardo, C., Ordonez, O. G., Henostroza, A., Laaz, E., Mizraji, R., Mojica, H., Haro, V. M., Medina, L. O., Preciado, M., Sobral, P., Urbina, M. A., & Thiel, M. (2018). Low prevalance of microplastic contamination in planktivorous fish species from the southeast Pacific Ocean. Marine Pollution Bulletin, 127, 211–216. https://doi.org/https://doi.org/10.1016/j.marpolbul.2017.12.016
- Ory, N. C., Sobral, P., Ferreira, J. L., & Thiel, M. (2017). Amberstripe scad Decapterus muroadsi (Carangidae) fish ingest blue microplastics resembling their copepod prey along the coast of Rapa Nui (Easter Island) in the South Pacific subtropical gyre. The Science of the Total Environment, 586, 430–437. https://doi.org/https://doi.org/10.1016/j.scitotenv.2017.01.175
- Pagter, E., Frias, J., & Nash, R. (2018). Microplastics in Galway Bay: A comparison of sampling and separation methods. Marine Pollution Bulletin, 135, 932–940. https://doi.org/https://doi.org/10.1016/j.marpolbul.2018.08.013
- Palombini, F. L., Demori, R., Cidade, M. K., Kindlein, W., Jr., & Jacques, J. J. (2018). Occurrence and recovery of small-sized plastic debris from a Brazilian beach: Characterisation, recycling, and mechanical analysis. Environmental Science and Pollution Research, 25(26), 26218–26227. https://doi.org/https://doi.org/10.1007/s11356-018-2678-7
- Pannetier, P., Cachot, J., Clerandeau, C., Faure, F., Arkel, K. V., Alencastro, L. F., Levasseur, C., Sciacca, F., Bourgeois, J.-P., & Morin, B. (2019). Toxicity assessment of pollutants sorbed on environmental sample microplastics collected on beaches: Part I-adverse effects on fish cell line. Environmental Pollution, 248, 1088–1097. https://doi.org/https://doi.org/10.1016/j.envpol.2018.12.091
- Patterson, J., Jeyasanta, K. I., Sathish, N., Booth, A. M., & Edward, J. K. P. (2019). Profiling microplastics in the Indian edible oyster, Magallana bilineata collected from the Tuticorin coast, Gulf of Mannar, Southeastern India. The Science of the Total Environment, 691, 727–735. https://doi.org/https://doi.org/10.1016/j.scitotenv.2019.07.063
- Pedrotti, M. L., Petit, S., Elineau, A., Bruzaud, S., Crebassa, J.-C., Dumontet, B., Marti, E., Gorsky, G., & Cozar, A. (2016). Changes in the floating plastic pollution of the Mediterranean Sea in relation to the distance to land. PLoS One, 11(8), e0161581. https://doi.org/https://doi.org/10.1371/journal.pone.0161581
- Peeken, I., Primpke, S., Beyer, B., Gutermann, J., Katlein, C., Krumpen, T., Bergmann, M., Hehemann, L., & Gerdts, G. (2018). Arctic Sea Ice is an important temporal sink and means of transport for microplastic. Nature Communications, 9(1), 1505. https://doi.org/https://doi.org/10.1038/s41467-018-03825-5
- Peez, N., Janiska, M.-C., & Imhof, W. (2019). The first of quantitative 1H NMR spectroscopy as a simple and fast method of identification and quantification of microplastic particles (PE, PET and PS). Analytical and Bioanalytical Chemistry, 411(4), 823–833. https://doi.org/https://doi.org/10.1007/s00216-018-1510-z
- Pegado, T. S. S., Schmid, K., Winemiller, K. O., Chelazzi, D., Cincinelli, A., Dei, L., & Giarrizzo, T. (2018). First evidence of microplastics ingestion by fishes from the Amazon River estuary. Marine Pollution Bulletin, 133, 814–821. https://doi.org/https://doi.org/10.1016/j.marpolbul.2018.06.035
- Peixoto, D., Pinheiro, C., Amorim, J., Oliva-Teles, L., Guilhermino, L., & Vieira, M. N. (2019). Microplastic pollution in commercial salt for human consumption: A review. Estuarine, Coastal and Shelf Science, 219, 161–168. https://doi.org/https://doi.org/10.1016/j.ecss.2019.02.018
- Pellini, G., Gomiero, A., Fortibuoni, T., Ferra, C., Grati, F., Tassetti, N., Polidori, P., Fabi, G., & Scarcella, G. (2018). Characterisation of microplastic litter in the gastrointestinal tract of Solea solea from the Adriatic Sea. Environmental Pollution, 234, 943–952. https://doi.org/https://doi.org/10.1016/j.envpol.2017.12.038
- Peng, G., Xu, P., Zhu, B., Bai, M., & Li, D. (2018). Microplastics in freshwater river sediments in Shanghi, China: A case study of risk assessment in mega-cities. Environmental Pollution, 234, 448–456. https://doi.org/https://doi.org/10.1016/j.envpol.2017.11.034
- Peng, G., Zhu, B., Yang, D., Su, L., Shi, H., & Li, D. (2017). Microplastics in sediments of the Changjiang estuary, China. Environmental Pollution, 225, 283–290. https://doi.org/https://doi.org/10.1016/j.envpol.2016.12.064
- Pham, C. K., Rodriguez, Y., Dauphin, A., Carrico, R., Frias, J. P. G. L., Vandeperre, F., Otero, V., Santos, M. R., Martins, H. R., Bolten, A. B., & Bjorndal, K. A. (2017). Plastic ingestion in oceanic-stage loggerhead sea turtles (Caretta caretta) off the North Atlantic subtropical gyre. Marine Pollution Bulletin, 121(1–2), 222–229. https://doi.org/https://doi.org/10.1016/j.marpolbul.2017.06.008
- Phillips, M. B., & Bonner, T. H. (2015). Occurrence and amount of microplastic ingested by fishes in watersheds of the Gulf of Mexico. Marine Pollution Bulletin, 100(1), 264–269. https://doi.org/https://doi.org/10.1016/j.marpolbul.2015.08.041
- Phuong, N. N., Poirier, L., Lagarde, F., Kamari, A., & Zalouk-Vergnoux, A. (2018). Microplastic abundance and characteristics in French Atlantic coastal sediments using a new extraction method. Environmental Pollution, 243, 228–237. https://doi.org/https://doi.org/10.1016/j.envpol.2018.08.032
- Phuong, N. N., Poirier, L., Pham, Q. T., Lagarde, F., & Zalouk-Vergnoux, A. (2018). Factors influencing the microplastic contamination of bivalves from the French Atlantic coast: Location, season and/or mode of life? Marine Pollution Bulletin, 129(2), 664–674. https://doi.org/https://doi.org/10.1016/j.marpolbul.2017.10.054
- Piarulli, S., Scapinello, S., Comandini, P., Magnusson, K., Granberg, M., Wong, J. X. W., Sciutto, G., Prati, S., Mazzeo, R., Booth, A. M., & Airoldi, L. (2019). Microplastic in wild populations of the omnivorous crab Carcinus aestuarii: A review and a regional-scale test of extraction methods, including microfibers. Environmental Pollution, 251, 117–127. https://doi.org/https://doi.org/10.1016/j.envpol.2019.04.092
- Picollo, M., Bartolozzi, G., Cucci, C., Galeotti, M., Marchiafava, V., & Pizzo, B. (2014). Comparative study of Fourier Transform Infrared spectroscopy in transmission, attenuated total reflection, and total reflection modes for the analysis of plastics im the cultural heritage field. Applied Spectroscopy, 68(4), 389–397. https://doi.org/https://doi.org/10.1366/13-07199
- Piehl, S., Mitterwallner, V., Atwood, E. C., Bochow, M., & Laforsch, C. (2019). Abundance and distribution of large microplastics (1–5 mm) within beach sediments at the Po River delta, northeast Italy. Marine Pollution Bulletin, 149, 110515. https://doi.org/https://doi.org/10.1016/j.marpolbul.2019.110515
- Pinon-Colin, T. J., Rodriguez-Jimenez, R., Pastrana-Corral, M. A., Rogel-Hernandez, E., & Wakida, F. T. (2018). Microplastics on sandy beaches of the Baja California Peninsula, Mexico. Marine Pollution Bulletin, 131, 63–71. https://doi.org/https://doi.org/10.1016/j.marpolbul.2018.03.055
- Piperagkas, O., Papageorgiou, N., & Karakassis, I. (2019). Qualitative and quantitative assessment of microplastics in three sandy Mediterranean beaches, including different methodological approaches. Estuarine Coastal and Shelf Science, 219, 169–175. https://doi.org/https://doi.org/10.1016/j.ecss.2019.02.016
- Pivokonsky, M., Cermakova, L., Novotna, K., Peer, P., Cajthaml, T., & Janda, V. (2018). Occurrence of microplastics in raw and treated drinking water. The Science of the Total Environment, 643, 1644–1651. https://doi.org/https://doi.org/10.1016/j.scitotenv.2018.08.102
- Pozo, K., Gomez, V., Torres, M., Vera, L., Nuñez, D., Oyarzún, P., Mendoza, G., Clarke, B., Fossi, M. C., Baini, M., Přibylová, P., & Klánová, J. (2019). Presence and characterisation of microplastics in fish of commercial importance from the Biobio region in central Chile. Marine Pollution Bulletin, 140, 315–319. https://doi.org/https://doi.org/10.1016/j.marpolbul.2019.01.025
- Primpke, S., Christiansen, S. H., Cowger, W., Frond, H. D., Deshpande, A., Fischer, M., Holland, E. B., Meyns, M., O’Donnell, B. A., Ossmann, B. E., Pittroff, M., Sarau, G., Scholz-Bottcher, B. M., & Wiggin, K. J. (2020). Critical assessment of analytical methods for the harmonized and cost-efficient analysis of microplastics. Applied Spectroscopy. https://doi.org/https://doi.org/10.1177/0003702820921465
- Primpke, S., Cross, R. K., Mintenig, S. M., Simon, M., Vianello, A., Gerdts, G., & Vollertsen, J. (2020). Toward the systematic identification of microplastics in the environment: Evaluation of a new independent software (siMPle) for spectroscopic analysis. Applied Spectroscopy. https://doi.org/https://doi.org/10.1177/0003702820917760
- Primpke, S., Dias, P. A., & Gerdts, G. (2019). Automated identification and quantification of microfibres and microplastics. Analytical Methods, 11(16), 2138–2147. https://doi.org/https://doi.org/10.1039/C9AY00126C
- Primpke, S., Lorenz, C., Rascher-Friesenhausen, R., & Gerdts, G. (2017). An automated approach for microplastics analysis using focal plane array (FPA) FTIR microscopy and image analysis. Analytical Methods, 9(9), 1499–1511. https://doi.org/https://doi.org/10.1039/C6AY02476A
- Primpke, S., Wirth, M., Lorenz, C., & Gerdts, G. (2018). Reflectance database design for the automated analysis of microplastic samples based on Fourier transform infrared (FTIR) spectroscopy. Analytical and Bioanalytical Chemistry, 410(21), 5131–5141. https://doi.org/https://doi.org/10.1007/s00216-018-1156-x
- Prokic, M. D., Radovanovic, T. B., Gavric, J. P., & Faggio, C. (2019). Ecotoxicological effects of microplastics: Examination of biomarkers, current state and future perspectives. Trac Trends in Analytical Chemistry, 111, 37–46. https://doi.org/https://doi.org/10.1016/j.trac.2018.12.001
- Qin, Y., Wang, Z., Li, W., Chang, X., Yang, J., & Yang, F. (2020). Microplastics in the sediment of Lake Ulansuhai of Yellow River basin, China. Water Environment Research, 92(6), 829–839. https://doi.org/https://doi.org/10.1002/wer.1275
- Qiu, Q., Peng, J., Yu, X., Chen, F., Wang, J., & Dong, F. (2015). Occurrence of microplastics in the coastal marine environment: First observation on sediment of China. Marine Pollution Bulletin, 98(1–2), 274–280. https://doi.org/https://doi.org/10.1016/j.marpolbul.2015.07.028
- Qu, X., Su, L., Li, H., Liang, M., & Shi, H. (2018). Assessing the relationship between the abundance and properties of microplastics in water and in mussels. The Science of the Total Environment, 621, 679–686. https://doi.org/https://doi.org/10.1016/j.scitotenv.2017.11.284
- Rajakumar, K., Sarasvathy, V., Thamarai Chelvan, A., Chitra, R., & Vijayakumar, C. T. (2009). Natural weathering studies of Polypropylene. Journal of Polymers and the Environment, 17(3), 191–202. https://doi.org/https://doi.org/10.1007/s10924-009-0138-7
- Reed, S., Clark, M., Thompson, R., & Hughes, K. A. (2018). Microplastics in marine sediments near Rothera Research Station, Antarctica. Marine Pollution Bulletin, 133, 460–463. https://doi.org/https://doi.org/10.1016/j.marpolbul.2018.05.068
- Reichert, J., Arnold, A. L., Hoogenboom, M. O., Schubert, P., & Wilke, T. (2019). Impacts of microplastics on growth and health of hermatypic corals are species-specific. Environmental Pollution, 254, 113074. https://doi.org/https://doi.org/10.1016/j.envpol.2019.113074
- Reisser, J., Shaw, J., Wilcox, C., Hardesty, B. D., Proietti, M., Thums, M., & Pattiaratchi, C. (2013). Marine plastic pollution in waters around Australia: Characteristics, concentrations, and pathways. PLoS One, 8 (11), e80466. https://doi.org/https://doi.org/10.1371/journal.pone.0080466
- Ren, L., Men, L., Zhang, Z., Guan, F., Tian, J., Wang, B., Wang, J., Zhang, Y., & Zhang, W. (2019). Biodegradation of polyethylene by Enterobacter sp. D1 from the Guts of wax moth Galleria mellonella. International Journal of Environmental Research and Public Health, 16(11), 1941. https://doi.org/https://doi.org/10.3390/ijerph16111941
- Renner, G., Nellessen, A., Schwiers, A., Wenzel, M., Schmidt, T. C., & Schram, J. (2019). Data preprocessing and evaluation used in the microplastics identification process: A critical review and practical guide. TrAC—Trends in Analytical Chemistry, 111, 229–238. https://doi.org/https://doi.org/10.1016/j.trac.2018.12.004
- Renner, G., Sauerbier, P., Schmidt, T. C., & Schram, J. (2019). Robust automatic identification of microplastics in environmental samples using FTIR microscopy. Analytical Chemistry, 91(15), 9656–9664. https://doi.org/https://doi.org/10.1021/acs.analchem.9b01095
- Renner, G., Schmidt, T. C., & Schram, J. (2016). Characterisation and quantification of microplastics by infrared spectroscopy. Comprehensive Analytical Chemistry, 75, 67–118.
- Renner, G., Schmidt, T. C., & Schram, J. (2017). A new chemometric approach for automatic identification of microplastics from environmental compartments based on FT-IR spectroscopy. Analytical Chemistry, 89(22), 12045–12053. https://doi.org/https://doi.org/10.1021/acs.analchem.7b02472
- Renner, G., Schmidt, T. C., & Schram, J. (2020). Automated rapid & intelligent microplastics mapping by FTIR microscopy: A python-based workflow. MethodsX, 7, 100742. https://doi.org/https://doi.org/10.1016/j.mex.2019.11.015
- Renzi, M., & Blaskovic, A. (2018). Litter & microplastics features in table salts from marine origin: Italian versus Croatian brands. Marine Pollution Bulletin, 135, 62–68. https://doi.org/https://doi.org/10.1016/j.marpolbul.2018.06.065
- Renzi, M., Grazioli, E., Bertacchini, E., & Blaskovic, A. (2019). Microparticles in Table Salt: Levels and Chemical composition of the smallest dimensional fraction. Journal of Marine Science and Engineering, 7(9), 310. https://doi.org/https://doi.org/10.3390/jmse7090310
- Renzi, M., Grazioli, E., & Blaskovic, A. (2019). Effects of different microplastic types and surfactant-Microplastic mixtures under fasting and feeding conditions: A case study on Daphnia magna. Bulletin of Environmental Contamination and Toxicology, 103(3), 367–373. https://doi.org/https://doi.org/10.1007/s00128-019-02678-y
- Renzi, M., Specchiulli, A., Blaskovic, A., Manzo, C., Mancinelli, G., & Cilenti, L. (2019). Marine litter in stomach content of small pelagic fishes from the Adriatic Sea: Sardines (Sardina pilchardus) and anchovies (Engraulis encrasicolus). Environmental Science and Pollution Research International, 26(3), 2771–2781. https://doi.org/https://doi.org/10.1007/s11356-018-3762-8
- Rezania, S., Park, J., Din, M. F. M., Taib, S. M., Talaiekhozani, A., Yadav, K. K., & Kamyab, H. (2018). Microplastics pollution in different aquatic environments and biota: A review of recent studies. Marine Pollution Bulletin, 133, 191–208. https://doi.org/https://doi.org/10.1016/j.marpolbul.2018.05.022
- Ribeiro, F., Garcia, A. R., Pereira, B. P., Fonseca, M., Mestre, N. C., Fonseca, T. G., Ilharco, L. M., & Bebianno, M. J. (2017). Microplastics effects in Scrobicularia plana. Marine Pollution Bulletin, 122(1–2), 379–391. https://doi.org/https://doi.org/10.1016/j.marpolbul.2017.06.078
- Rivers, M. L., Gwinnett, C., & Woodall, L. C. (2019). Quantification is more than counting: Actions required to accurately quantify and report isolated marine microplastics. Marine Pollution Bulletin, 139, 100–104. https://doi.org/https://doi.org/10.1016/j.marpolbul.2018.12.024
- Roch, S., & Brinker, A. (2017). Rapid and efficient method for the detection of microplastic in the Gastrointestinal tract of fishes. Environmental Science & Technology, 51(8), 4522–4530. https://doi.org/https://doi.org/10.1021/acs.est.7b00364
- Rochman, C. (2015). The complex mixture, fate and toxicity of chemicals associated with plastic debris in the marine environment. In M. Bergmann, L. Gutow & M. Klages (Eds.), Marine anthropogenic litter (pp 117–140). Springer.
- Rochman, C. M., Tahir, A., Williams, S. L., Baxa, D. V., Lam, R., Miller, J. T., Teh, F.-C., Werorilangi, S., & Teh, S. J. (2015). Anthropogenic debris in seafood: Plastic debris and fibers from textiles in fish and bivalves sold for human consumption. Scientific Reports, 5, 14340. https://doi.org/https://doi.org/10.1038/srep14340
- Rochman, C. M., Kurobe, T., Flores, I., & Teh, S. J. (2014). Early warning signs of endocrine disruption in adult fish from the ingestion of polyethylene with and without sorbed chemical pollutants from the marine environment. Science of the Total Environment, 493, 656–661. https://doi.org/https://doi.org/10.1016/j.scitotenv.2014.06.051
- Rodrigues, M. O., Abrantes, N., Goncalves, F. J. M., Nogueira, H., Marques, J. C., & Goncalves, A. M. M. (2018). Spatial and temporal distribution of microplastics in water and sediments of a freshwater system (Antua River, Portugal). Science of the Total Environment, 633, 1549–1559. https://doi.org/https://doi.org/10.1016/j.scitotenv.2018.03.233
- Rodrigues, M. O., Goncalves, A. M. M., Goncalves, F. J. M., Nogueira, H., Marques, J. C., & Abrantes, N. (2018). Effectiveness of a methodology of microplastics isolation for environmental monitoring in freshwater systems. Ecological Indicators, 89, 488–495. https://doi.org/https://doi.org/10.1016/j.ecolind.2018.02.038
- Rodriguez-Seijo, A., Costa, J. P., Rocha-Santos, T., Duarte, A. C., & Pereira, R. (2018). Oxidative stress, energy metabolism and molecular responses of earthworms (Eisenia Fetida) exposed to low-density polyethylene microplastics. Environmental Science and Pollution Research, 25(33), 33599–33610. https://doi.org/https://doi.org/10.1007/s11356-018-3317-z
- Rose, D., & Webber, M. (2019). Characterisation of microplastics in the surface waters of Kingston Harbour. Science of the Total Environment, 664, 753–760. https://doi.org/https://doi.org/10.1016/j.scitotenv.2019.01.319
- Rotter, G., & Ishida, H. (1992). FTIR separation of nylon-6 chain conformations: Clarification of the mesomorphous and γ-crystalline phases. Journal of Polymer Science Part B: Polymer Physics, 30(5), 489–495. https://doi.org/https://doi.org/10.1002/polb.1992.090300508
- Rudduck, O.-A., Lavers, J. L., Fischer, A. M., Stuckenbrock, S., Sharp, P. B., & Banati, R. B. (2017). Inter-annual variation in the density of anthropogenic debris in the Tasman Sea. Marine Pollution Bulletin, 124(1), 51–55. https://doi.org/https://doi.org/10.1016/j.marpolbul.2017.07.010
- Ruiz-Compean, P., Ellis, J., Curdia, J., Payumo, R., Langner, U., Jones, B., & Carvalho, S. (2017). Baseline evaluation of sediment contamination in the shallow coastal areas of Saudi Arabian Red Sea. Marine Pollution Bulletin, 123(1–2), 205–218. https://doi.org/https://doi.org/10.1016/j.marpolbul.2017.08.059
- Rummel, C. D., Loder, M. G. J., Fricke, N. F., Lang, T., Griebeler, E.-M., Janke, M., & Gerdts, G. (2016). Plastic ingestion by pelagic and demersal fish the North sea and Baltic sea. Marine Pollution Bulletin, 102(1), 134–141. https://doi.org/https://doi.org/10.1016/j.marpolbul.2015.11.043
- Sadri, S. S., & Thompson, R. C. (2014). On the quantity and composition of floating plastic debris entering and leaving the Tamar estuary, Southwest England. Marine Pollution Bulletin, 81(1), 55–60. https://doi.org/https://doi.org/10.1016/j.marpolbul.2014.02.020
- Sagawa, N., Kawaai, K., & Hinata, H. (2018). Abundance and size of microplastics in a coastal sea: Comparison among bottom sediment, beach sediment, and surface water. Marine Pollution Bulletin, 133, 532–542. https://doi.org/https://doi.org/10.1016/j.marpolbul.2018.05.036
- Saliu, F., Montano, S., Leoni, B., Lasagni, M., & Galli, P. (2019). Microplastics as a threat to coral reef environments: Detection of phthalate ester in neuston and scleractinian corals from the Faafu Atoll, Maldives. Marine Pollution Bulletin, 142, 234–241. https://doi.org/https://doi.org/10.1016/j.marpolbul.2019.03.043
- Saliu, F., Montano, S., Garavaglia, M. G., Lasagni, M., Seveso, D., & Galli, P. (2018). Microplastic and charred microplastic in the Faafu Atoll, Maldives. Marine Pollution Bulletin, 136, 464–471. https://doi.org/https://doi.org/10.1016/j.marpolbul.2018.09.023
- Sanchez-Vidal, A., Thompson, R. C., Canals, M., & de Haan, W. P. (2018). The imprint of microfibers in southern European deep seas. PLoS One, 13(11), e0207033. https://doi.org/https://doi.org/10.1371/journal.pone.0207033
- Sarkar, D. J., Sarkar, S. D., Das, B. K., Manna, R. K., Behera, B. K., & Samanta, S. (2019). Spatial distribution of meso and microplastics in the sediments of river Ganga at eastern India. Science of the Total Environment, 694, 133712. https://doi.org/https://doi.org/10.1016/j.scitotenv.2019.133712
- Sathish, N., Jeyasanta, K. I., & Patterson, J. (2019). Abundance, characteristics and surface degradation features of microplastics in beach sediments of five coastal areas in Tamil Nadu, India. Marine Pollution Bulletin, 142, 112–118. https://doi.org/https://doi.org/10.1016/j.marpolbul.2019.03.037
- Savoca, S., Capillo, G., Mancuso, M., Bottari, T., Crupi, R., Branca, C., Romano, V., Faggio, C., D'Angelo, G., & Spanò, N. (2019). Microplastics occurrence in the Tyrrhenian waters and in the gastrointestinal tract of two congener species of seaberms. Environmental Toxicology and Pharmacology, 67, 35–41. https://doi.org/https://doi.org/10.1016/j.etap.2019.01.011
- Scherer, C., Brennholt, N., Reifferscheid, G., & Wagner, M. (2017). Feeding type and development drive the ingestion of microplastics by freshwater invertebrates. Scientific Reports, 7(1), 17006. https://doi.org/https://doi.org/10.1038/s41598-017-17191-7
- Scheurer, M., & Bigalke, M. (2018). Microplastics in Swiss floodplain soils. Environmental Science & Technology, 52(6), 3591–3598. https://doi.org/https://doi.org/10.1021/acs.est.7b06003
- Schmidt, L. K., Bochow, M., Imhof, H. K., & Oswald, S. E. (2018). Multi-temporal surveys for microplastic particles enabled by a novel and fast application of SWIR imaging spectroscopy—Study of an urban watercourse traversing the city of Berlin, Germany. Environmental Pollution, 239, 579–589. https://doi.org/https://doi.org/10.1016/j.envpol.2018.03.097
- Scopetani, C., Chelazzi, D., Cincinelli, A., & Esterhuizen-Londt, M. (2019). Assessment of microplastic pollution: Occurrence and characterisation in Vesijarvi lake and Pikku Vesijarvi pond, Finland. Environmental Monitoring and Assessment, 191(11), 652. https://doi.org/https://doi.org/10.1007/s10661-019-7843-z
- Scott, N., Porter, A., Santillo, D., Simpson, H., Lloyd-Williams, S., & Lewis, C. (2019). Particle characteristics of microplastics contaminating the mussel Mytilus edulis and their surrounding environments. Marine Pollution Bulletin, 146, 125–133. https://doi.org/https://doi.org/10.1016/j.marpolbul.2019.05.041
- Seth, C. K., & Shriwastav, A. (2018). Contamination of Indian sea salts with microplastics and a potential prevention strategy. Environmental Science and Pollution Research, 25(30), 30122–30131. https://doi.org/https://doi.org/10.1007/s11356-018-3028-5
- Shim, W. J., Song, Y. K., Hong, S. H., & Jang, M. (2016). Identification and quantification of microplastics using Nile Red staining. Marine Pollution Bulletin, 113(1–2), 469–476. https://doi.org/https://doi.org/10.1016/j.marpolbul.2016.10.049
- Sighicelli, M., Pietrelli, L., Lecce, F., Iannilli, V., Falconieri, M., Coscia, L., Vito, S. D., Nuglio, S., & Zampetti, G. (2018). Microplastic pollution in the surface waters of Italian subalpine lakes. Environmental Pollution, 236, 645–651. https://doi.org/https://doi.org/10.1016/j.envpol.2018.02.008
- Simon, M., van Alst, N., & Vollertsen, J. (2018). Quantification of microplastic mass and removal rates at wastewater treatment plants applying Focal Plane Array (FPA)-based Fourier Transform Infrared (FTIR) imaging. Water Research, 142, 1–9. https://doi.org/https://doi.org/10.1016/j.watres.2018.05.019
- Simon-Sanchez, L., Grelaud, M., Garcia-Orellana, J., & Ziveri, P. (2019). River deltas as hotspots of microplastic accumulation: The case study of the Ebro River (NW Mediterranean). Science of the Total Environment, 687, 1186–1196. https://doi.org/https://doi.org/10.1016/j.scitotenv.2019.06.168
- Slootmaekers, B., Carteny, C. C., Belpaire, C., Saverwyns, S., Fremout, W., Blust, R., & Bervoets, L. (2019). Microplastic contamination in gudgeons (Gobio gobio) from Flemish rivers (Belgium). Environmental Pollution, 244, 675–684. https://doi.org/https://doi.org/10.1016/j.envpol.2018.09.136
- Smith, M., Love, D. C., Rochman, C. M., & Neff, R. A. (2018). Microplastics in seafood and the implications for human health. Current Environmental Health Reports, 5(3), 375–386. https://doi.org/https://doi.org/10.1007/s40572-018-0206-z
- So, W. K., Chan, K., & Not, C. (2018). Abundance of plastic microbeads in Hong Kong coastal water. Marine Pollution Bulletin, 133, 500–505. https://doi.org/https://doi.org/10.1016/j.marpolbul.2018.05.066
- Song, Y., Cao, C., Qiu, R., Hu, J., Liu, M., Lu, S., Shi, H., Raley-Susman, K. M., & He, D. (2019). Uptake and adverse effects of polyethylene terephthalate microplastics fibers on terrestrial snails (Achatina fulica) after soil exposure. Environmental Pollution, 250, 447–455. https://doi.org/https://doi.org/10.1016/j.envpol.2019.04.066
- Song, Y. K., Hong, S. H., Eo, S., Jang, M., Han, G. M., Isobe, A., & Shim, W. J. (2018). Horizontal and vertical distribution of microplastics in Korean coastal waters. Environmental Science & Technology, 52(21), 12188–12197. https://doi.org/https://doi.org/10.1021/acs.est.8b04032
- Song, Y. K., Hong, S. H., Jang, M., Han, G. M., Jung, S. W., & Shim, W. J. (2017). Combined effects of UV exposure duration and mechanical abrasion on microplastic fragmentation by polymer type. Environmental Science & Technology, 51(8), 4368–4376. https://doi.org/https://doi.org/10.1021/acs.est.6b06155
- Song, Y. K., Hong, S. H., Jang, M., Han, G. M., Rani, M., Lee, J., & Shim, W. J. (2015). A comparison of microscopic and spectroscopic identification methods for analysis of microplastics in environmental samples. Marine Pollution Bulletin, 93(1–2), 202–209. https://doi.org/https://doi.org/10.1016/j.marpolbul.2015.01.015
- Song, Y. K., Hong, S. H., Jang, M., Han, G. M., & Shim, W. J. (2015). Occurrence and distribution of microplastics in the sea surface microlayer in Jinhae Bay, South Korea. Archives of Environmental Contamination and Toxicology, 69(3), 279–287. https://doi.org/https://doi.org/10.1007/s00244-015-0209-9
- Song, Y. K., Hong, S. H., Jang, M., Kang, J.-H., Kwon, O. Y., Han, G. M., & Shim, W. J. (2014). Large accumulation of micro-sized synthetic polymer particles in the sea surface microlayer. Environmental Science & Technology, 48(16), 9014–9021. https://doi.org/https://doi.org/10.1021/es501757s
- Stark, N. M., & Matuana, L. M. (2004). Surface chemistry changes of weathered HDPE/wood-flour composites studied by XPS and FTIR spectroscopy. Polymer Degradation and Stability, 86(1), 1–9. https://doi.org/https://doi.org/10.1016/j.polymdegradstab.2003.11.002
- Steer, M., Cole, M., Thompson, R. C., & Lindeque, P. K. (2017). Microplastic ingestion in fish larvae in the western English channel. Environmental Pollution, 226, 250–259. https://doi.org/https://doi.org/10.1016/j.envpol.2017.03.062
- Su, L., Cai, H., Kolandhasamy, P., Wu, C., Rochman, C. M., & Shi, H. (2018). Using the Asian clam as an indicator of microplastic pollution in freshwater ecosystems. Environmental Pollution, 234, 347–355. https://doi.org/https://doi.org/10.1016/j.envpol.2017.11.075
- Su, L., Deng, H., Li, B., Chen, Q., Pettigrove, V., Wu, C., & Shi, H. (2019). The occurrence of microplastic in specific organs in commercially caught fishes from coast and estuary area of east China. Journal of Hazardous Materials, 365, 716–724. https://doi.org/https://doi.org/10.1016/j.jhazmat.2018.11.024
- Su, L., Nan, B., Hassell, K. L., Craig, N. J., & Pettigrove, V. (2019). Microplastics biomonitoring in Australian urban wetlands using a common noxious fish (Gambusia holbrooki). Chemosphere, 228, 65–74. https://doi.org/https://doi.org/10.1016/j.chemosphere.2019.04.114
- Su, L., Xue, Y., Li, L., Yang, D., Kolandhasamy, P., Li, D., & Shi, H. (2016). Microplastics in Taihu Lake, China. Environmental Pollution, 216, 711–719. https://doi.org/https://doi.org/10.1016/j.envpol.2016.06.036
- Su, Y., Zhang, Z., Wu, D., Zhan, L., Shi, H., & Xie, B. (2019). Occurrence of microplastics in landfill systems and their fate with landfill age. Water Research, 164, 114968. https://doi.org/https://doi.org/10.1016/j.watres.2019.114968
- Suaria, G., Avio, C. G., Mineo, A., Lattin, G. L., Magaldi, M. G., Belmonte, G., Moore, C. J., Regoli, F., & Aliani, S. (2016). The Mediterranean plastic soup: Synthetic polymers in Mediterranean surface waters. Scientific Reports, 6, 37551. https://doi.org/https://doi.org/10.1038/srep37551
- Sun, J., Dai, X., Wang, Q., van Loosdrecht, M. C. M., & Ni, B.-J. (2019). Microplastics in wastewater treatment plants: Detection, occurrence and removal. Water Research, 152, 21–37. https://doi.org/https://doi.org/10.1016/j.watres.2018.12.050
- Sun, X., Chen, B., Li, Q., Liu, N., Xia, B., Zhu, L., & Qu, K. (2018). Toxicities of polystyrene nano- and microplastics toward marine bacterium Halomonas alkaliphila. The Science of the Total Environment, 642, 1378–1385. https://doi.org/https://doi.org/10.1016/j.scitotenv.2018.06.141
- Sun, X., Liang, J., Zhu, M., Zhao, Y., & Zhang, B. (2018). Microplastics in seawater and zooplankton from the Yellow Sea. Environmental Pollution, 242, 585–595. https://doi.org/https://doi.org/10.1016/j.envpol.2018.07.014
- Sun, X., Li, Q., Shi, Y., Zhao, Y., Zheng, S., Liang, J., Liu, T., & Tian, Z. (2019). Characteristics and retention of microplastics in the digestive tracts of fish from the Yellow Sea. Environmental Pollution, 249, 878–885. https://doi.org/https://doi.org/10.1016/j.envpol.2019.01.110
- Sun, X., Li, Q., Zhu, M., Liang, J., Zheng, S., & Zhao, Y. (2017). Ingestion of microplastics by natural zooplankton groups in the northern South China Sea. Marine Pollution Bulletin, 115(1–2), 217–224. https://doi.org/https://doi.org/10.1016/j.marpolbul.2016.12.004
- Sun, X., Liu, T., Zhu, M., Liang, J., Zhao, Y., & Zhang, B. (2018). Retention and characteristics of microplastics in natural zooplankton taxa from the East China Sea. The Science of the Total Environment, 640–641, 232–242. https://doi.org/https://doi.org/10.1016/j.scitotenv.2018.05.308
- Syakti, A. D., Bouhroum, R., Hidayati, N. V., Koenawan, C. J., Boulkamh, A., Sulistyo, I., Lebarillier, S., Akhlus, S., Doumenq, P., & Wong-Wah-Chung, P. (2017). Beach macro-litter monitoring and floating microplastic in a coastal area of Indonesia. Marine Pollution Bulletin, 122(1–2), 217–225. https://doi.org/https://doi.org/10.1016/j.marpolbul.2017.06.046
- Syakti, A. D., Hidayati, N. V., Jaya, Y. V., Siregar, S. H., Yude, R., Suhendy, Asia, L., Wong-Wah-Chung, P., & Doumenq, P. (2018). Simultaneous grading of microplastic size sampling in the small islands of Bintan water, Indonesia. Marine Pollution Bulletin, 137, 593–600. https://doi.org/https://doi.org/10.1016/j.marpolbul.2018.11.005
- Syberg, K., Khan, F. R., Selck, H., Palmqvist, A., Banta, G. T., Daley, J., Sano, L., & Duhaime, M. B. (2015). Microplastics: Addressing ecological risk through lessons learned. Environmental Toxicology and Chemistry, 34(5), 945–953. https://doi.org/https://doi.org/10.1002/etc.2914
- Tagg, A. S., Sapp, M., Harrison, J. P., & Ojeda, J. J. (2015). Identification and quantification of microplastics in wastewater using focal plane array-based reflectance micro-FT-IR imaging. Analytical Chemistry, 87(12), 6032–6040. https://doi.org/https://doi.org/10.1021/acs.analchem.5b00495
- Talvitie, J., Mikola, A., Koistinen, A., & Setala, O. (2017). Solutions to microplastic pollution—Removal of microplastics from wastewater effluent with advanced wastewater treatment technologies. Water Research, 123, 401–407. https://doi.org/https://doi.org/10.1016/j.watres.2017.07.005
- Talvitie, J., Mikola, A., Setala, O., Heinonen, M., & Koistinen, A. (2017). How well is microliter purified from wastewater? A detailed study on the stepwise removal of microliter in a tertiary level wastewater treatment plant. Water Research, 109, 164–172. https://doi.org/https://doi.org/10.1016/j.watres.2016.11.046
- Tan, X., Yu, X., Cai, L., Wang, J., & Peng, J. (2019). Microplastics and associated PAHs in surface water from the Feilaixia reservoir in the Beijiang river, China. Chemosphere, 221, 834–840. https://doi.org/https://doi.org/10.1016/j.chemosphere.2019.01.022
- Tanaka, K., & Takada, H. (2016). Microplastic fragments and microbeads in digestive tracts of planktivorous fish from urban coastal waters. Scientific Reports, 6, 34351. https://doi.org/https://doi.org/10.1038/srep34351
- Tang, P. L., McCumskay, R., Rogerson, M., Waller, C., & Forster, R. (2019). Handheld FT-IR spectroscopy for the triage of micro- and meso-sized plastics in the marine environment incorporating an accelerated weathering study and an aging estimation. Spectroscopy, 34, 54–60.
- Tang, G., Liu, M., Zhou, Q., He, H., Chen, K., Zhang, H., Hu, J., Huang, Q., Luo, Y., Ke, H., Chen, B., Xu, X., & Cai, M. (2018). Microplastics and polycyclic aromatic hydrocarbons (PAHs) in Xiamen coastal areas: Implications for anthropogenic impacts. The Science of the Total Environment, 634, 811–820. https://doi.org/https://doi.org/10.1016/j.scitotenv.2018.03.336
- Teng, J., Wang, Q., Ran, W., Wu, D., Liu, Y., Sun, S., Liu, H., Cao, R., & Zhao, J. (2019). Microplastic in cultured oysters from different coastal areas of China. Science of the Total Environment, 653, 1282–1292. https://doi.org/https://doi.org/10.1016/j.scitotenv.2018.11.057
- ter Halle, A., Ladirat, L., Martignac, M., Mingotaud, A. F., Boyron, O., & Perez, E. (2017). To what extent are microplastics from the open ocean weathered? Environmental Pollution, 227, 167–174. https://doi.org/https://doi.org/10.1016/j.envpol.2017.04.051
- Thompson, R. C., Olsen, Y., Mitchell, R. P., Davis, A., Rowland, S. J., John, A. W. G., McGonigle, D., & Russell, A. E. (2004). Lost at Sea: Where is all the plastic? Science, 304(5672), 838–838. https://doi.org/https://doi.org/10.1126/science.1094559
- Tian, L., Kolvenbach, B., Corvini, N., Wang, S., Tavanaie, N., Wang, L., Ma, Y., Scheu, S., Corvini, P. F.-X., & Ji, R. (2017). Mineralization of 14C-labelled polystyrene plastics by Penicillium variable after ozonation pre-treatment. New Biotechnology, 38, 101–105. https://doi.org/https://doi.org/10.1016/j.nbt.2016.07.008
- Tiwari, M., Rathod, T. D., Ajmal, P. Y., Bhangare, R. C., & Sahu, S. K. (2019). Distribution and characterisation of microplastics in beach sand from three different Indian coastal environments. Marine Pollution Bulletin, 140, 262–273. https://doi.org/https://doi.org/10.1016/j.marpolbul.2019.01.055
- Tofa, T. S., Kunjali, K. K., Paul, S., & Dutta, J. (2019). Visible light photocatalytic degradation of microplastic residues with zinc oxide nanorods. Environmental Chemistry Letters, 17(3), 1341–1346. https://doi.org/https://doi.org/10.1007/s10311-019-00859-z
- Toumi, H., Abidli, S., & Bejaoui, M. (2019). Microplastics in freshwater environment: The first evaluation in sediments from seven water streams surrounding the lagoon of Bizerte (North Tunisia). Environmental Science and Pollution Research, 26(14), 14673–14682. https://doi.org/https://doi.org/10.1007/s11356-019-04695-0
- Tsang, Y. Y., Mak, C. W., Liebich, C., Lam, S. W., Sze, E. T.-P., & Chan, K. M. (2017). Microplastic pollution in the marine waters and sediments of Hong Kong. Marine Pollution Bulletin, 115(1–2), 20–28. https://doi.org/https://doi.org/10.1016/j.marpolbul.2016.11.003
- Tuncer, S., Artuz, O. B., Demirkol, M., & Artuz, M. L. (2018). First report of occurrence, distribution and composition of microplastics in surface waters of the Sea of Marmara, Turkey. Marine Pollution Bulletin, 135, 283–289. https://doi.org/https://doi.org/10.1016/j.marpolbul.2018.06.054
- Turner, A. (2018). Mobilisation kinetics of hazardous elements in marine plastics subject to an avian physiologically-based extraction test. Environmental Pollution, 236, 1020–1026. https://doi.org/https://doi.org/10.1016/j.envpol.2018.01.023
- Turner, A., & Holmes, L. (2011). Occurrence, distribution and characteristics of beached plastic production pellets on the island of Malta (central Mediterranean). Marine Pollution Bulletin, 62(2), 377–381. https://doi.org/https://doi.org/10.1016/j.marpolbul.2010.09.027
- Turner, A., Wallerstein, C., & Arnold, R. (2019). Identification, origin and characteristics of bio-bead microplastics from beaches in western Europe. The Science of the Total Environment, 664, 938–947. https://doi.org/https://doi.org/10.1016/j.scitotenv.2019.01.281
- Tziourrou, P., Megalovasilis, P., Tsounia, M., & Karapanagioti, H. K. (2019). Characteristics of microplastics on two beaches affected by different land uses in Salamina Island in Saronikos Gulf, East Mediterranean. Marine Pollution Bulletin, 149, 110531. https://doi.org/https://doi.org/10.1016/j.marpolbul.2019.110531
- Ugolini, A., Ungherese, G., Ciofini, M., Lapucci, A., & Camaiti, M. (2013). Microplastic debris in sandhoppers. Estuarine Coastal and Shelf Science, 129, 19–22. https://doi.org/https://doi.org/10.1016/j.ecss.2013.05.026
- Uurasjarvi, E., Hartikainen, S., Setala, O., Lehtiniemi, M., & Koistinen, A. (2020). Microplastic concentrations, size distribution, and polymer types in the surface waters of a northern European lake. Water Environment Research, 92(1), 149–156. https://doi.org/https://doi.org/10.1002/wer.1229
- Valente, T., Sbrana, A., Scacco, U., Jacomini, C., Bianchi, J., Palazzo, L., Lucia, G. A., Silvestri, C., & Matiddi, M. (2019). Exploring microplastic ingestion by three deep-water elasmobranch species: A case study from the Tyrrhenian Sea. Environmental Pollution, 253, 342–350. https://doi.org/https://doi.org/10.1016/j.envpol.2019.07.001
- Vaughan, R., Turner, S. D., & Rose, N. L. (2017). Microplastics in the sediments of a UK urban lake. Environmental Pollution, 229, 10–18. https://doi.org/https://doi.org/10.1016/j.envpol.2017.05.057
- Veerasingam, S., Mugilarasan, M., Venkatachalapathy, R., & Vethamony, P. (2016). Influence of 2015 flood on the distribution and occurrence of microplastic pellets along the Chennai coast, India. Marine Pollution Bulletin, 109(1), 196–204. https://doi.org/https://doi.org/10.1016/j.marpolbul.2016.05.082
- Veerasingam, S., Saha, M., Suneel, V., & Vethamony, P. (2017). Microplastic pollution: A serious threat to the marine ecosystem. Blue Waters: Newsletter on Marine Environment Protection, 18, 6–9.
- Veerasingam, S., Saha, M., Suneel, V., Vethamony, P., Rodrigues, A. C., Bhattacharyya, S., & Naik, B. G. (2016). Characteristics seasonal distribution and surface degradation features of microplastic pellets along the Goa coast, India. Chemosphere, 159, 496–505. https://doi.org/https://doi.org/10.1016/j.chemosphere.2016.06.056
- Velez, N., Zardi, G. I., Savio, R. L., McQuaid, C. D., Valbusa, U., Sabour, B., & Nicastro, K. R. (2019). A baseline assessment of beach macrolitter and microplastics along northeastern Atlantic shores. Marine Pollution Bulletin, 149, 110649. https://doi.org/https://doi.org/10.1016/j.marpolbul.2019.110649
- Verlaan, M. P., Banta, G. T., Khan, F. R., & Syberg, K. (2019). Abundance of microplastics in the gastrointestinal tracts of the eelpout (Zoacres viviparous L.) collected in Roskilde Fjord, Denmark: Implications for use as a monitoring species under the Marine Strategy Framework Directive. Regional Studies in Marine Science, 32, 100900. https://doi.org/https://doi.org/10.1016/j.rsma.2019.100900
- Verleye, G. A., Roeges, N. P., & De Moor, M. O. (2001). Easy identification of plastics and rubbers (pp. 174). Rapra Technology Limited.
- Vianello, A., Boldrin, A., Guerriero, P., Moschino, V., Rella, R., Sturaro, A., & Da Ros, L. (2013). Microplastic particles in sediments of Lagoon of Venice, Italy: First observations on occurrence, spatial patterns and identification. Estuarine, Coastal and Shelf Science, 130, 54–61. https://doi.org/https://doi.org/10.1016/j.ecss.2013.03.022
- Vianello, A., Jensen, R. L., Liu, L., & Vollertsen, J. (2019). Simulating human exposure to indoor airborne microplastics using a breathing thermal manikin. Scientific Reports, 9(1), 8670. https://doi.org/https://doi.org/10.1038/s41598-019-45054-w
- Vianello, A., Ros, L. D., Boldrin, A., Marceta, T., & Moschino, V. (2018). First evaluation of floating microplastics in the Northwestern Adriatic Sea. Environmental Science and Pollution Research International, 25(28), 28546–28561. https://doi.org/https://doi.org/10.1007/s11356-018-2812-6
- Vidyasakar, A., Neelavannan, K., Krishnakumar, S., Prabaharan, G., Priyanka, T. S. A., Magesh, N. S., Godson, P. S., & Srinivasalu, S. (2018). Macrodebris and microplastic distribution in the beaches of Rameswaram coral island, Gulf of Mannar, Southeast coast of India: A first report. Marine Pollution Bulletin, 137, 610–616. https://doi.org/https://doi.org/10.1016/j.marpolbul.2018.11.007
- Virsek, M. K., Lovsin, M. N., Koren, S., Krzan, A., & Peterlin, M. (2017). Microplastics as a vector for the transport of the bacterial fish pathogen species Aeromonas salmonicida. Marine Pollution Bulletin, 125(1–2), 301–309. https://doi.org/https://doi.org/10.1016/j.marpolbul.2017.08.024
- von Friesen, L. W., Granberg, M. E., Hassellov, M., Gabrielsen, G. W., & Magnusson, K. (2019). An efficient and gentle enzymatic digestion protocol for the extraction of microplastics from bivalve tissue. Marine Pollution Bulletin, 142, 129–134. https://doi.org/https://doi.org/10.1016/j.marpolbul.2019.03.016
- Wagner, J., Wang, Z.-M., Ghosal, S., Murphy, M., Wall, S., Cook, A.-M., Robberson, W., & Allen, H. (2019). Non-destructive extraction and identification of microplastics from freshwater sport fish stomachs. Environmental Science & Technology, 53(24), 14496–14506. https://doi.org/https://doi.org/10.1021/acs.est.9b05072
- Wagner, J., Wang, Z.-M., Ghosal, S., Rochman, C., Gassel, M., & Wall, S. (2017). Novel method for the extraction and identification of microplastics in ocean trawl and fish gut matrices. Analytical Methods, 9(9), 1479–1490. https://doi.org/https://doi.org/10.1039/C6AY02396G
- Wang, J., Peng, J., Tan, Z., Gao, Y., Zhan, Z., Chen, Q., & Cai, L. (2017). Microplastics in the surface sediments from the Beijiang River littoral zone: Composition, abundance, surface textures and interaction with heavy metals. Chemosphere, 171, 248–258. https://doi.org/https://doi.org/10.1016/j.chemosphere.2016.12.074
- Wang, J., Wang, M., Ru, S., & Liu, X. (2019). High levels of microplastic pollution in the sediments and benthic organisms of the South Yellow Sea, China. Science of the Total Environment, 651, 1661–1669. https://doi.org/https://doi.org/10.1016/j.scitotenv.2018.10.007
- Wang, T., Zou, X., Li, B., Yao, Y., Li, J., Hui, H., Yu, W., & Wang, C. (2018). Microplastics in a wind farm area: A case study at the Rudong Offshore wind farm, Yellow Sea, China. Marine Pollution Bulletin, 128, 466–474. https://doi.org/https://doi.org/10.1016/j.marpolbul.2018.01.050
- Wang, T., Zou, X., Li, B., Yao, Y., Zang, Z., Li, Y., Yu, W., & Wang, W. (2019). Preliminary study of the source apportionment and diversity of microplastics: Taking floating microplastics in the South China Sea as an example. Environmental Pollution, 245, 965–974. https://doi.org/https://doi.org/10.1016/j.envpol.2018.10.110
- Wang, W., Ndungu, A. W., Li, Z., & Wang, J. (2017). Microplastics pollution in inland freshwaters of China: A case study in urban surface waters of Wuhan, China. Science of the Total Environment, 575, 1369–1374. https://doi.org/https://doi.org/10.1016/j.scitotenv.2016.09.213
- Wang, X., Li, C., Liu, K., Zhu, L., Song, Z., & Li, D. (2020). Atmospheric microplastic over the South China Sea and East Indian Ocean: Abundance, distribution and source. Journal of Hazardous Materials, 389, 121846. https://doi.org/https://doi.org/10.1016/j.jhazmat.2019.121846
- Wang, Y., Mao, Z., Zhang, M., Ding, G., Sun, J., Du, M., Liu, Q., Cong, Y., Jin, F., Zhang, W., & Wang, J. (2019). The uptake and elimination of polystyrene microplastics by the brine shrimp, Artemia parthenogenetica, and its impact on its feeding behavior and intestinal histology. Chemosphere, 234, 123–131. https://doi.org/https://doi.org/10.1016/j.chemosphere.2019.05.267
- Wang, Z., Qin, Y., Li, W., Yang, W., Meng, Q., & Yang, J. (2019). Microplastic contamination in freshwater: First observation in Lake Ulansuhai, Yellow River basin, China. Environmental Chemistry Letters, 17(4), 1821–1830. https://doi.org/https://doi.org/10.1007/s10311-019-00888-8
- Wang, Z., Su, B., Xu, X., Di, D., Huang, H., Mei, K., Dahlgren, R. A., Zhang, M., & Shang, X. (2018). Preferential accumulation of small (<300 µm) microplastics in the sediments of a coastal plain river network in eastern China. Water Research, 144, 393–401.
- Wang, Z.-M., Wagner, J., Ghosal, S., Bedi, G., & Wall, S. (2017). SEM/EDS and optical microscopy analyses of microplastics in ocean trawl and fish guts. The Science of the Total Environment, 603–604, 616–626. https://doi.org/https://doi.org/10.1016/j.scitotenv.2017.06.047
- Watermann, B. T., Loder, M., Herlyn, M., Daehne, B., Thomsen, A., & Gall, K. (2017). Long-term 2007–2013 monitoring of reproductive disturbance in the dun sentinel Assiminea grayana with regard to polymeric materials pollution at the coast of Lower Saxony, North Sea, Germany. Environmental Science and Pollution Research International, 24(4), 3352–3362. https://doi.org/https://doi.org/10.1007/s11356-016-8058-2
- Webb, S., Ruffell, H., Marsden, I., Pantos, O., & Gaw, S. (2019). Microplastics in the New Zealand green lipped mussel Perna canaliculus. Marine Pollution Bulletin, 149, 110641. https://doi.org/https://doi.org/10.1016/j.marpolbul.2019.110641
- Weber, A., Scherer, C., Brennholt, N., Reifferscheid, G., & Wagner, M. (2018). PET microplastics do not negatively affect the survival, development, metabolism and feeding activity of the freshwater invertebrate Gammarus pulex. Environmental Pollution, 234, 181–189. https://doi.org/https://doi.org/10.1016/j.envpol.2017.11.014
- Welden, N. A., Abylkhani, B., & Howarth, L. M. (2018). The effects of trophic transfer and environmental factors on microplastic uptake by plaice, Pleuronectes platessa, and spider carb, Maja squinado. Environmental Pollution, 239, 351–358. https://doi.org/https://doi.org/10.1016/j.envpol.2018.03.110
- Welden, N. A. C., & Cowie, P. R. (2016). Environment and gut morphology influence microplastic retention in langoustine, Nephrops norvegics. Environmental Pollution, 214, 859–865. https://doi.org/https://doi.org/10.1016/j.envpol.2016.03.067
- Wen, B., Jin, S.-R., Chen, Z.-Z., Gao, J.-Z., Liu, Y.-N., Liu, J.-H., & Feng, X.-S. (2018). Single and combined effects of microplastics and cadmium on the cadmium accumulation, antioxidant defence and innate immunity of the discus fish (Symphysodon aequifasciatus). Environmental Pollution, 243, 462–471. https://doi.org/https://doi.org/10.1016/j.envpol.2018.09.029
- Wesch, C., Barthel, A.-K., Braun, U., Klein, R., & Paulus, M. (2016). No microplastics in benthic eelpout (Zoarces viviparus): An urgent need for spectroscopic analyses in microplastic detection. Environmental Research, 148, 36–38. https://doi.org/https://doi.org/10.1016/j.envres.2016.03.017
- Wesch, C., Elert, A. M., Worner, M., Braun, U., Klein, R., & Paulus, M. (2017). Assessing quality in microplastic monitoring: About the value of clean-air devices as essentials for verified data. Scientific Reports, 7(1), 5424. https://doi.org/https://doi.org/10.1038/s41598-017-05838-4
- Whitaker, J. M., Garza, T. N., & Janosik, A. M. (2019). Sampling with Niskin bottles and microfiltration reveals a high prevalence of microfibers. Limnologica, 78, 125711. https://doi.org/https://doi.org/10.1016/j.limno.2019.125711
- Woodall, L. C., Sanchez-Vidal, A., Canals, M., Paterson, G. L. J., Coppock, R., Sleight, V., Calafat, A., Rogers, A. D., Narayanaswamy, B. E., & Thompson, R. C. (2014). The deep sea is a major sink for microplastic debris. Royal Society Open Science, 1(4), 140317. https://doi.org/https://doi.org/10.1098/rsos.140317
- Wu, N., Zhang, Y., Zhang, X., Zhao, Z., He, J., Li, W., Ma, Y., & Niu, Z. (2019). Occurrence and distribution of microplastics in the surface water and sediment of two typical estuaries in Bohai Bay, China. Environmental Science: Processes & Impacts, 21(7), 1143–1152. https://doi.org/https://doi.org/10.1039/C9EM00148D
- Wu, Q., Tao, H., & Wong, M. H. (2019). Feeding and metabolism effects of three common microplastics on Tenebrio molitor L. Environmental Geochemistry and Health, 41(1), 17–26. https://doi.org/https://doi.org/10.1007/s10653-018-0161-5
- Xu, B., Liu, F., Cryder, Z., Huang, D., Lu, Z., He, Y., Wang, H., Lu, Z., Brookes, P. C., Tang, C., Gan, J., & Xu, J. (2019). Microplastics in the soil environment: Occurrence, risks, interactions and fate—A review. Critical Reviews in Environmental Science and Technology, 50, 2175–2222. https://doi.org/https://doi.org/10.1080/10643389.2019.1694822
- Xu, J. L., & Gowen, A. A. (2019). Investigation of plasticizer aggregation problem in case in based biopolymer using chemical imaging. Talanta, 193, 128–138. https://doi.org/https://doi.org/10.1016/j.talanta.2018.09.094
- Xu, J. L., Thomas, K. V., Luo, Z., & Gowen, A. A. (2019). FTIR and Raman imaging for microplastics analysis: State of the art, challenges and prospects. TrAC Trends in Analytical Chemistry, 119, 115629. https://doi.org/https://doi.org/10.1016/j.trac.2019.115629
- Xu, P., Peng, G., Su, L., Gao, Y., Gao, L., & Li, D. (2018). Microplastic risk assessment in surface waters: A case study in the Changjiang Estuary, China. Marine Pollution Bulletin, 133, 647–654. https://doi.org/https://doi.org/10.1016/j.marpolbul.2018.06.020
- Xu, X., Jian, Y., Xue, Y., Hou, Q., & Wang, L. (2019). Microplastics in the wastewater treatment plants (WWTPs): Occurrence and removal. Chemosphere, 235, 1089–1096. https://doi.org/https://doi.org/10.1016/j.chemosphere.2019.06.197
- Yabanlı, M., Yozukmaz, A., Şener, İ., & Ölmez, Ö. T. (2019). Microplastic pollution at the intersection of the Aegean and Mediterranean seas: A study of the Datca Peninsula (Turkey). Marine Pollution Bulletin, 145, 47–55. https://doi.org/https://doi.org/10.1016/j.marpolbul.2019.05.003
- Yang, D., Shi, H., Li, L., Li, J., Jabeen, K., & Kolandhasamy, P. (2015). Microplastic pollution in Table salts from China. Environmental Science & Technology, 49(22), 13622–13627. https://doi.org/https://doi.org/10.1021/acs.est.5b03163
- Yang, L., Li, K., Cui, S., Kang, Y., An, L., & Lei, K. (2019). Removal of microplastics in municipal sewage from China’s largest water reclamation plant. Water Research, 155, 175–181. https://doi.org/https://doi.org/10.1016/j.watres.2019.02.046
- Yao, W., Di, D., Wang, Z., Liao, Z., Huang, H., Mei, K., Dahlgren, R. A., Zhang, M., & Shang, X. (2019). Micro- and microplastic accumulation in a newly formed Spartina alterniflora colonized estuarine saltmarsh in southeast China. Marine Pollution Bulletin, 149, 110636. https://doi.org/https://doi.org/10.1016/j.marpolbul.2019.110636
- Yu, J., Wang, P., Ni, F., Cizdziel, J., Wu, D., Zhao, Q., & Zhou, Y. (2019). Characterisation of microplastics in environment by thermal gravimetric analysis coupled with Fourier transform infrared spectroscopy. Marine Pollution Bulletin, 145, 153–160. https://doi.org/https://doi.org/10.1016/j.marpolbul.2019.05.037
- Yu, P., Liu, Z., Wu, D., Chen, M., Lv, W., & Zhao, Y. (2018). Accumulation of polystyrene microplastics in juvenile Eriocheir sinensis and oxidative stress effects in the liver. Aquatic Toxicology, 200, 28–36. https://doi.org/https://doi.org/10.1016/j.aquatox.2018.04.015
- Yu, X., Peng, J., Wang, J., Wang, K., & Bao, S. (2016). Occurrence of microplastics in the beach sand of the Chinese inner sea: The Bohai Sea. Environmental Pollution, 214, 722–730. https://doi.org/https://doi.org/10.1016/j.envpol.2016.04.080
- Zarfl, C. (2019). Promising techniques and open challenges for microplastic identification and quantification in environmental matrices. Analytical and Bioanalytical Chemistry, 411(17), 3743–3756. https://doi.org/https://doi.org/10.1007/s00216-019-01763-9
- Zbyszewski, M., Corcoran, P. L., & Hockin, A. (2014). Comparison of the distribution and degradation of plastic debris along shorelines of the Great Lakes, North America. Journal of Great Lakes Research, 40(2), 288–299. https://doi.org/https://doi.org/10.1016/j.jglr.2014.02.012
- Zeri, C., Adamopoulou, A., Varezic, D. B., Fortibuoni, T., Virsek, M. K., Krzan, A., Mandic, M., Mazziotti, C., Palatinus, A., Peterlin, M., Prvan, M., Ronchi, F., Siljic, J., Tutman, P., & Vlachogianni, T. (2018). Floating plastics in Adriatic waters (Mediterranean Sea): From the macro- to the micro-scale. Marine Pollution Bulletin, 136, 341–330. https://doi.org/https://doi.org/10.1016/j.marpolbul.2018.09.016
- Zhang, B., Wu, D., Yang, X., Teng, J., Liu, Y., Liu, Y., Zhang, C., Zhao, J., Yin, X., You, L., Liu, Y., & Wang, Q. (2019). Microplastic pollution in the surface sediments collected from Sishili Bay, North Yellow Sea, China. Marine Pollution Bulletin, 141, 9–15. https://doi.org/https://doi.org/10.1016/j.marpolbul.2019.02.021
- Zhang, C., Zhou, H., Cui, Y., Wang, C., Li, Y., & Zhang, D. (2019). Microplastics in offshore sediment in the Yellow Sea and East China Sea, China. Environmental Pollution, 244, 827–833. https://doi.org/https://doi.org/10.1016/j.envpol.2018.10.102
- Zhang, F., Man, Y. B., Mo, W. Y., Man, K. Y., & Wong, M. H. (2019). Direct and indirect effects of microplastics on bivalves, with a focus on edible species: A mini-review. Critical Reviews of Environmental Science and Technology, 1–35.
- Zhang, F., Wang, X., Xu, J., Zhu, L., Peng, G., Xu, P., & Li, D. (2019). Food-web transfer of microplastics between wild caught fish and crustaceans in East China Sea. Marine Pollution Bulletin, 146, 173–182. https://doi.org/https://doi.org/10.1016/j.marpolbul.2019.05.061
- Zhang, H., Zhou, Q., Xie, Z., Zhou, Y., Tu, C., Fu, C., Mi, W., Ebinghaus, R., Christie, P., & Luo, Y. (2018). Occurrence of organophosphorus esters and phthalates in the microplastics from the coastal beaches in north China. Science of the Total Environment, 616–617, 1505–1512. https://doi.org/https://doi.org/10.1016/j.scitotenv.2017.10.163
- Zhang, J., Zhang, C., Deng, Y., Wang, R., Ma, E., Wang, J., Bai, J., Wu, J., & Zhou, Y. (2019). Microplastics in the surface water of small-scale estuaries in Shanghai. Marine Pollution Bulletin, 149, 110569. https://doi.org/https://doi.org/10.1016/j.marpolbul.2019.110569
- Zhang, K., Gong, W., Lv, J., Xiong, X., & Wu, C. (2015). Accumulation of floating microplastics behind the Three Gorges Dam. Environmental Pollution, 204, 117–123. https://doi.org/https://doi.org/10.1016/j.envpol.2015.04.023
- Zhang, M., Zhao, Y., Qin, X., Jia, W., Chai, L., Huang, M., & Huang, Y. (2019). Microplastics from mulching film is a distinct habitat for bacteria in farmland soil. The Science of the Total Environment, 688, 470–478. https://doi.org/https://doi.org/10.1016/j.scitotenv.2019.06.108
- Zhang, W., Zhang, S., Wang, J., Wang, Y., Mu, J., Wang, P., Lin, X., & Ma, D. (2017). Microplastic pollution in the surface waters of the Bohai Sea, China. Environmental Pollution, 231(Pt 1), 541–548. https://doi.org/https://doi.org/10.1016/j.envpol.2017.08.058
- Zhang, Y., Kang, S., Allen, S., Allen, D., Gao, T., & Sillanpaa, M. (2020). Atmospheric microplastics: A review on current status and perspectives. Earth-Science Reviews, 203, 103118. https://doi.org/https://doi.org/10.1016/j.earscirev.2020.103118
- Zhao, J., Ran, W., Teng, J., Liu, Y., Liu, H., Yin, X., Cao, R., & Wang, Q. (2018). Microplastic pollution in sediments from the Bohai Sea and the Yellow Sea, China. Science of the Total Environment, 640–641, 637–645. https://doi.org/https://doi.org/10.1016/j.scitotenv.2018.05.346
- Zhao, S., Wang, T., Zhu, L., Xu, P., Wang, X., Gao, L., & Li, D. (2019). Analysis of suspended microplastics in the Changjiang Estuary: Implications for riverine plastic load to the ocean. Water Research, 161, 560–569. https://doi.org/https://doi.org/10.1016/j.watres.2019.06.019
- Zheng, Y., Li, J., Cao, W., Liu, X., Jiang, F., Ding, J., Yin, X., & Sun, C. (2019). Distribution characteristics of microplastics in the seawater and sediment: A case study in Jiaozhou Bay, China. The Science of the Total Environment, 674, 27–35. https://doi.org/https://doi.org/10.1016/j.scitotenv.2019.04.008
- Zhou, Q., Zhang, H., Fu, C., Zhou, Y., Dai, Z., Li, Y., Tu, C., & Luo, Y. (2018). The distribution and morphology of microplastics in coastal soils adjacent to the Bohai sea and the Yellow sea. Geoderma, 322, 201–208. https://doi.org/https://doi.org/10.1016/j.geoderma.2018.02.015
- Zhu, C., Li, D., Sun, Y., Zheng, X., Peng, X., Zheng, K., Hu, B., Luo, X., & Mai, B. (2019). Plastic debris in marine birds from an island located in the South China Sea. Marine Pollution Bulletin, 149, 110566. https://doi.org/https://doi.org/10.1016/j.marpolbul.2019.110566
- Zhu, D., Chen, Q.-L., An, X.-L., Yang, X.-R., Christie, P., Ke, X., Wu, L.-H., & Zhu, Y.-G. (2018). Exposure of soil collembolans to microplastics perturbs their gut microbiota and alter their isotopic composition. Soil Biology and Biochemistry, 116, 302–310. https://doi.org/https://doi.org/10.1016/j.soilbio.2018.05.031
- Zhu, J., Yu, X., Zhang, Q., Li, Y., Tan, S., Li, D., Yang, Z., & Wang, J. (2019). Cetaceans and microplastics: First report of microplastic ingestion by a coastal delphinid, Sousa chinensis. The Science of the Total Environment, 659, 649–654. https://doi.org/https://doi.org/10.1016/j.scitotenv.2018.12.389
- Zhu, J., Zhang, Q., Li, Y., Tan, S., Kang, Z., Yu, X., Lan, W., Cai, L., Wang, J., & Shi, H. (2019). Microplastic pollution in the Maowei Sea, a typical mariculture bay of China. Science of the Total Environment, 658, 62–68. https://doi.org/https://doi.org/10.1016/j.scitotenv.2018.12.192
- Zhu, L., Bai, H., Chen, B., Sun, X., Qu, K., & Xia, B. (2018). Microplastic pollution in North Yellow Sea, China: Observations on occurrence, distribution and identification. Science of the Total Environment, 636, 20–29. https://doi.org/https://doi.org/10.1016/j.scitotenv.2018.04.182
- Zhu, L., Wang, H., Chen, B., Sun, X., Qu, K., & Xia, B. (2019). Microplastic ingestion in deep-sea fish from the South China Sea. Science of the Total Environment, 677, 493–501. https://doi.org/https://doi.org/10.1016/j.scitotenv.2019.04.380
- Ziajahromi, S., Neale, P. A., Rintoul, L., & Leusch, F. D. L. (2017). Wastewater treatment plants as a pathway for microplastics: Development of a new approach to sample wastewater-based microplastics. Water Research, 112, 93–99. https://doi.org/https://doi.org/10.1016/j.watres.2017.01.042