 ?Mathematical formulae have been encoded as MathML and are displayed in this HTML version using MathJax in order to improve their display. Uncheck the box to turn MathJax off. This feature requires Javascript. Click on a formula to zoom.
Abstract
Mercury is a toxin that causes neurological impairments in adults, is particularly harmful for fetuses and children, and is deadly in severe cases, making it a worldwide health concern. Methylmercury (MeHg) is the environmentally relevant form of mercury (Hg) because it biomagnifies along the food chain. Methylmercury is mainly produced in aquatic sediments via methylation of inorganic Hg (Hg(II)) and transformed back via demethylation. Because transformation rates determine MeHg concentrations, quantification of methylation and demethylation rates is needed to inform management of MeHg. Published rate constants for Hg(II) methylation () and MeHg demethylation (
) vary greatly, stemming partly from differences in experimental methods. We conducted a comprehensive review of rate laws, evaluated published rate constants, and performed biogeochemical simulations to assess variability in reported
and
Based on selected studies employing the same pseudo-first-order rate law and similar experimental methods, we found that
is a reasonable range for wetland sediments. Over a number of environments, maximum
was smaller at sites without Hg source (
) than at sites with identified Hg source (
). Larger variability and higher uncertainty in
compared to
highlight the need for more research on MeHg demethylation rates. This critical review: (a) aids the design of future experimental studies of
and
(b) provides guidance for comparing rate constants from different studies; (c) presents a biogeochemical reaction model to assess rate constants; and (d) informs selection of
and
values from the literature for use in model simulations.
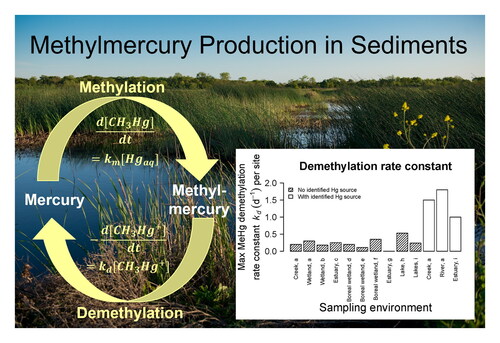
Graphical abstract
HANDLING EDITORS:
1. Introduction
Mercury (Hg) in the environment is mostly present as elemental mercury (Hg(0)) and inorganic mercury (usually as Hg(II) species), but the most toxic forms are methylated Hg species, referred to as methylmercury (MeHg). Monomethylmercury ( and its aqueous complexes are the dominant forms in freshwater aquatic systems, with dimethylmercury (
) also observed in marine systems (Loux, Citation2007; Morel et al., Citation1998). In contrast to Hg(II), MeHg bioaccumulates and biomagnifies in the food chain (Morel et al., Citation1998). Human uptake of neurotoxic MeHg via fish consumption (Malm et al., Citation1995), and in some regions of the world by rice consumption (Feng et al., Citation2008), results in toxic MeHg concentrations that are particularly detrimental to the development of fetuses and children but can also cause serious neurological impairments in adults (Clarkson, Citation1997; Lim et al., Citation2013; Mergler et al., Citation2007).
Methylmercury is produced from Hg(II) via methylation facilitated by microorganisms under anaerobic conditions (Gilmour et al., Citation2018; Podar et al., Citation2015), which was suspected to be a key step in transformation of inorganic and organic Hg species in early studies (Jensen & Jernelöv, Citation1969; Wood et al., Citation1968). Methylmercury is transformed back to inorganic Hg by demethylation processes (also called MeHg degradation) under aerobic and anaerobic conditions (Fleck et al., Citation2014; Lu et al., Citation2017; West et al., Citation2020). Aquatic sediments are hotspots for MeHg production (Fleck et al., Citation2016), from where MeHg may partition to the water column and become more bioavailable, and thus increase its potential for biomagnification (Mason et al., Citation2005; Morel et al., Citation1998). Total Hg(II) concentration and Hg(II) methylation and MeHg demethylation rates determine MeHg concentrations in aquatic sediments, which might be a reason why elevated MeHg concentrations are found in both contaminated and pristine environments (Hintelmann et al., Citation2000; Schaefer et al., Citation2004). The lack of a simple correlation between Hg(II) and MeHg concentrations emphasizes the importance of lowering MeHg concentrations by decreasing Hg(II) methylation rates (Eckley et al., Citation2017; Fuhrmann et al., Citation2021; Schwartz et al., Citation2019; Vlassopoulos et al., Citation2018) or increasing MeHg demethylation rates (Hsu-Kim et al., Citation2018). However, Hg(II) methylation and MeHg demethylation rates depend on a myriad of biogeochemical processes (Bigham et al., Citation2017), making it difficult to determine the best management practice for a particular site (Eckley et al., Citation2020). Speciation and bioavailability of Hg(II) and MeHg are dependent on the reduction-oxidation (redox) potential of an aquatic system and the rate at which it changes, which are determined by coupling of the microbial community and abiotic environmental factors (Graham et al., Citation2012; Ravichandran, Citation2004; Schaefer & Morel, Citation2009; Schartup et al., Citation2013; W. Zhu et al., Citation2018). Because Hg and MeHg transformation rates are largely controlled by microbial processes, the amount of labile organic matter (OM) is probably a more important driver of net methylation than the supply of electron accepting species, concentration, or pH in many environments (Beckers et al., Citation2019; Frohne et al., Citation2012). To understand controls on net MeHg production and manage MeHg concentrations, it is desirable to separately quantify methylation and demethylation rates and relate them to cycling of OM and redox-sensitive species such as sulfur and iron.
Rate constants for Hg(II) methylation () and MeHg demethylation (
) are typically determined experimentally with isotope-tracer assays. Although Hg(II) and MeHg isotope-tracer assays are laborious and time-consuming, rate constants derived from experimental data are useful for quantitative assessment of Hg cycling and development of management strategies to mitigate bioaccumulation, particularly using model simulations that are becoming increasingly popular as decision-making tools (S. Zhu et al., Citation2018). Published
and
values derived using isotope tracers vary among studies of different systems and using different experimental conditions. In recent years, several studies tried to theoretically (Olsen et al., Citation2016) and experimentally (Johnson et al., Citation2015; Jonsson et al., Citation2012; Lehnherr et al., Citation2011; Olsen et al., Citation2018; Rodrı́guez Martı́n-Doimeadios et al., Citation2004; Zhang et al., Citation2021) elucidate reasons for the large variability when determining
and
but there are no recent compilations or critical evaluations of published rate constants. A recent critical review (Regnell & Watras, Citation2019) discussed derivation of Hg(II) methylation rates from isotope-tracer assays but focused mainly on interpreting field and laboratory studies to better understand pathways of cellular Hg(II) uptake. A prior compilation of Hg(II) methylation rate constants was reported by Merritt and Amirbahman (Citation2009), but they did not evaluate the data or discuss MeHg demethylation rates.
This critical review aims to determine whether variability in and
reported in the literature is related to the experimental method or assumed rate law used in different studies and to provide values or ranges of
and
associated with low uncertainty for application to aquatic sediments. This information is also useful for designing new isotope-tracer assays to avoid pitfalls and improve consistency. Thus, the goals and outcomes of this review are: (1) review of commonly used rate laws for Hg(II) methylation and MeHg demethylation; (2) compilation and critical evaluation of published rate constants; and (3) assessment of the applicability of
and
values using biogeochemical reaction simulations compared to experimental data.
2. Hg(II) methylation and MeHg demethylation processes
Here, we briefly summarize processes and reactions relevant to the formulation of overall rate expressions. In-depth reviews of Hg(II) methylation and MeHg demethylation mechanisms can be found elsewhere (Barkay et al., Citation2003; Beckers & Rinklebe, Citation2017; Du et al., Citation2019; Hsu-Kim et al., Citation2013; Ma et al., Citation2019; Ullrich et al., Citation2001).
Detailed knowledge about Hg(II) methylation mechanisms within microbial cells is limited (Hsu-Kim et al., Citation2013) and the mechanism for transport of Hg(II) into the cell remains a topic of debate (Adediran et al., Citation2019). Early on it was found that Hg(II) methylation is promoted by sulfate-reducing bacteria (Compeau & Bartha, Citation1985; Gilmour et al., Citation1992; Pak & Bartha, Citation1998; Wood et al., Citation1968). Later it was discovered that iron-reducing bacteria (Fleming et al., Citation2006; Kerin et al., Citation2006; Lu et al., Citation2016; Si et al., Citation2015; Yang et al., Citation2016) and methanogenic archaea (Avramescu et al., Citation2011; Correia et al., Citation2012; Gilmour et al., Citation2013, Citation2018; Parks et al., Citation2013; Podar et al., Citation2015; Rothenberg et al., Citation2016) are also capable of equally high rates of methylation. However, only the relatively recent discovery of the hgcA and hgcB gene pair has allowed somewhat better understanding of biochemical mechanisms within the cell (Parks et al., Citation2013). Direct measurement of hgcAB activity could provide valuable information but is still under development (Bravo & Cosio, Citation2020).
In contrast to methylation, genes associated with MeHg demethylation were discovered early (Schottel, Citation1978; Summers & Sugarman, Citation1974), but for a biotic pathway that is likely not the dominant mode of demethylation (Lu et al., Citation2017). Although MeHg demethylation may proceed abiotically by photolysis (Fleck et al., Citation2014) and reaction with sulfide (Deacon, Citation1978; West et al., Citation2020), and by at least two microbially mediated pathways (Marvin-DiPasquale et al., Citation2000), the latter reactions dominate under light-deprived conditions found in soils and sediments. Discovery of genes (mer operon) (Foster et al., Citation1979) for an active detoxification mechanism—reductive demethylation—provided insight into biochemical mechanisms within the cell. Reductive demethylation results in production of methane and volatile elemental mercury (Barkay et al., Citation2003; Schaefer et al., Citation2004), which may evade the local methylation-demethylation cycle in sediments. Transcription of the gene merB, which produces an enzyme that breaks the C-Hg bond, was found to be activated by an increase in Hg(II) concentration and suggests that reductive demethylation is activated when a threshold Hg(II) concentration is reached. Another biotic pathway—oxidative demethylation—was found to be a cometabolic process that transforms MeHg to Hg(II), which is again available for methylation (Oremland et al., Citation1995). Marvin-DiPasquale and Oremland (Citation1998) proposed oxidative demethylation as an overall reaction that is analogous to acetate oxidation by sulfate-reducing bacteria:
(1)
(1)
or analogous to monomethylamine degradation by methanogenic archaea:
(2)
(2)
Genes involved in oxidative demethylation have not been identified, and biochemical mechanisms are not well understood. However, oxidative demethylation might be more common than reductive demethylation because highly contaminated sites are rare (Lu et al., Citation2017).
3. Review of rate laws for Hg(II) methylation and MeHg demethylation
Currently used rate laws for Hg(II) methylation and MeHg demethylation are empirical and based on knowledge about overall reactions. Microbially mediated processes (i.e., linked to organic-matter degradation) such as methylation and demethylation can be described with empirical rate laws based on overall reactions (Berner, Citation1964, Citation1980). A theoretical justification was presented by Boudreau (Citation1997). Rate laws based on elementary reactions are unlikely to be practical for the complex mechanisms involved in Hg(II) methylation and MeHg demethylation, but knowledge about reactions and rate-limiting steps can help to determine the best mathematical forms for empirical rate laws. Efforts to determine rate-limiting steps have been made (Kritee et al., Citation2009, Citation2013), but there are still many unknowns.
The use of an irreversible pseudo-first-order rate law for empirical fitting of experimental data to determine Hg(II) methylation and MeHg demethylation rates was first presented by Hintelmann et al. (Citation2000), Marvin-Dipasquale et al. (Citation2000), and Marvin-DiPasquale and Agee (Citation2003). This approach has been followed by most subsequent studies (see Supporting Information Table S1). Among the reviewed studies, rates of methylation and demethylation are typically investigated via isotope-tracer assays using two different mercury isotopes to label Hg(II) and MeHg. This dual isotope method allows separate determination of each rate within the same sample (Ramlal et al., Citation1986), which enables assessment of the relative magnitude of each process. Radioisotopes of Hg were initially used (Furutani & Rudd, Citation1980; Ramlal et al., Citation1986) but were not considered true tracer experiments because the radioisotope, such as had low specific activity (Hintelmann et al., Citation2000). This problem was solved by preparing
with high specific activity (Gilmour & Riedel, Citation1995). With improvements in the sensitivity of mass spectrometers, the use of stable Hg isotopes for rate studies has become common practice since the early study by Hintelmann et al. (Citation1995). In the next sections, we present derivations of first-order rate laws for Hg(II) methylation and MeHg demethylation to clarify differences in application when different assumptions or isotopes were used experimentally.
Table 1. Reported and recommended rate constants for mercury methylation ( and methylmercury demethylation (
for aquatic sediments.
3.1. Irreversible pseudo-first-order rate law for Hg(II) methylation
The majority of studies employed the approach proposed by Hintelmann et al. (Citation2000) to calculate the Hg(II) methylation rate and rate constant. They assumed an irreversible pseudo-first-order rate law for Hg(II) methylation over the time of the incubation experiment, here shown with the stable isotope
(3)
(3)
The differential rate law for an irreversible pseudo-first-order rate can be written in terms of the reactant or the product. Hintelmann et al. (Citation2000) described the rate as the change of product concentration over time:
(4)
(4)
where
is the concentration of the isotope tracer
(
) added at the start of the experiment,
is the concentration of
(
) newly generated from the
tracer,
is the methylation rate constant (
), and t is incubation time (
). The approach assumes that the reaction in Eq. (3) is irreversible and that the concentration of the product depends only on the concentration of the reactant, and not on other constituents in the system. Hintelmann et al. (Citation2000) also assumed that the concentration of
added at the start of the experiment (denoted
in the following equations) remains approximately constant over the time of the experiment. With these assumptions, EquationEq. (4)
(4)
(4) can be rearranged to:
(5)
(5)
Equation (5) can be integrated from to some later time (
):
(6)
(6)
Integrating and applying these limits results in:
(7)
(7)
Assuming that Eq. (7) reduces to:
(8)
(8)
Equation (8) can be rearranged to calculate directly:
(9)
(9)
With Eq. (9), the methylation rate constant can be determined minimally with only two measurements—the Hg(II) tracer concentration added at the beginning of the experiment and the MeHg generated from methylation at time t. Most reviewed studies used two measurements. The disadvantage of only two measurements is that it is not possible to assess whether the assumption of a first-order rate law is valid, resulting in potential over- or underestimation, which is discussed later.
The differential rate law for Eq. (3) can be also written in terms of change in concentration of the reactant
(10)
(10)
Integration over time using the reactant concentration is a common approach for evaluating first-order rate laws and was done in several Hg(II) methylation kinetic studies. The approach was first presented by Marvin-DiPasquale and Agee (Citation2003); rearranging Eq. (10):
(11)
(11)
and then integrating from the initial
concentration at time
to the concentration of
at some time (
) gives:
(12)
(12)
Integrating and applying these limits results in:
(13)
(13)
Considering natural logarithm rules, Eq. (13) can be written as:
(14)
(14)
Marvin-DiPasquale and Agee (Citation2003) further adapted Eq. (14) because the concentration of the product rather than reactant
was measured. Because all product
is derived from reactant
mass balance requires:
(15)
(15)
Solving Eq. (15) for and substituting into Eq. (14) can be written:
(16)
(16)
Simplifying Eq. (16), Marvin-DiPasquale and Agee (Citation2003) directly calculated
(17)
(17)
Note that Eq. (17) is an exact solution of the rate law with no assumptions, whereas Eq. (9) assumed a constant concentration of initial Equation (9) approximates Eq. (17) if a Taylor series expansion is applied:
(18)
(18)
Truncating after the first-order term gives:
(19)
(19)
Assuming that Eq. (17) can be rewritten as:
(20)
(20)
which reduces to Eq. (9) when the approximation in Eq. (19) is applied. Hintelmann et al.'s (Citation2000) Eq. (9) agrees with Marvin-DiPasquale and Agee's (Citation2003) Eq. (17) only when the amount of Hg(II) that is transformed to MeHg is small (below
see Supporting Information Fig. S1).
3.2. Irreversible pseudo-first-order rate law for MeHg demethylation
The approach used by most studies for demethylation of MeHg to Hg(II) assumes an irreversible pseudo-first-order rate law over the course of the experiment, shown here with the isotope
(21)
(21)
This approach was first presented by Hintelmann et al. (Citation2000) and Marvin-DiPasquale et al. (Citation2000). Hintelmann et al. (Citation2000) described the differential rate law in terms of the change in reactant concentration:
(22)
(22)
where
is the concentration of isotope tracer
(
),
is the demethylation rate constant (
), and t is incubation time (
). The rate equation can be rearranged and integrated similarly to the Hg(II) methylation equations above:
(23)
(23)
(24)
(24)
(25)
(25)
EquationEquation (25)(25)
(25) can be rearranged to:
(26)
(26)
EquationEquation (26)(26)
(26) has the form of an equation for a straight line. Hintelmann et al. (Citation2000) derived
from the slope of a plot of
over time (
).
Slightly different equations were used by Marvin-DiPasquale et al. (Citation2000) because they isotopically labeled the carbon (C) atom with instead of Hg in
Marvin-DiPasquale et al. (Citation2000) rearranged EquationEq. (25)
(25)
(25) to:
(27)
(27)
They assumed a rate law based on:
(28)
(28)
and applied mass balance for 14C species, where:
(29)
(29)
This approach is based on the assumption that all of the labeled carbon of the methyl group is transformed into or
and all other intermediate carbon species are negligible. Ignoring intermediates, solving Eq. (29) for
and substituting into Eq. (27) gives:
(30)
(30)
Simplifying Eq. (30) yields the final equation used by Marvin-DiPasquale et al. (Citation2000) to calculate
(31)
(31)
The approach of Marvin-DiPasquale et al. (Citation2000) (labeling C in ) uses a different tracer for MeHg than Hintelmann et al. (Citation2000) (labeling Hg in
), but the mathematical approach is the same and the
values are equivalent as long as the added tracer is demethylated only to CH4 and/or CO2.
3.3. Variations on first-order (de)methylation rate laws
A few studies varied the assumed rate laws, mathematical solutions, and/or their experimental set-up to improve precision of the derived rate constants and to quantify under- or overestimation connected with applying the first-order rate to two time-point measurements. Four of the reviewed studies (Johnson et al., Citation2015; Jonsson et al., Citation2012; Olsen et al., Citation2016; Rodrı́guez Martı́n-Doimeadios et al., Citation2004) combined the first-order rate laws for Hg(II) methylation and MeHg demethylation into one equation and derived rate constants from a time series instead of two time points. Rodrı́guez Martı́n-Doimeadios et al. (Citation2004) found higher rate constants when using a time series compared to two time points, whereas Olsen et al. (Citation2016) found lower rate constants. Jonsson et al. (Citation2012) and Johnson et al. (Citation2015) did not compare rate constants from different approaches. Two of the reviewed studies (Lehnherr et al., Citation2011; Olsen et al., Citation2018) added additional terms to the rate laws based on measured availability of the Hg(II) and/or MeHg tracers over time. Tracers were added in dissolved form, which is generally more bioavailable for methylation or demethylation than solid tracer (Hintelmann et al., Citation2000; Jonsson et al., Citation2012; W. Zhu et al., Citation2018) because Hg(II) must be able to pass into bacterial cells. Variation in methylation rate depending on Hg(II) species were observed by Hintelmann et al. (Citation2000), who reasoned that adsorption and dissociation kinetics could be a factor depending on the charge of the tracer species and possible binding to strong adsorption sites. Most Hg methylation studies added the tracer as Cl2 or
The tracer for MeHg demethylation studies is typically supplied as
Cl and sometimes as
Dissolved species may become less available with time by sorption onto sediment organic matter (Qian et al., Citation2002; Skyllberg et al., Citation2003). Both Lehnherr et al. (Citation2011) and Olsen et al. (Citation2018) measured a strong decline of bioavailable Hg(II) over 24 hr. Olsen et al. (Citation2018) compared the approach assuming first-order rates and using two time points with their approach of taking into account the decline of tracer due to sorption and using a time series. They found rate constants in periphyton biofilms that were three times higher for Hg(II) methylation and either lower or higher for MeHg demethylation, depending on the interval between the two time points selected compared with the entire time series over 72 hr.
4. Critical evaluation of Hg(II) methylation and MeHg demethylation rate constants
In this review, we considered literature published up until and including 2020. We initially compiled data from 62 studies that reported observed rates and rate constants for Hg(II) methylation and/or MeHg demethylation in various types of samples. Importance was given to retrieving all relevant publications. An initial screening was conducted in which a subset of 28 studies reporting and 17 studies reporting
was selected (see Supporting Information Tables S1 and S2) based on the following criteria: (1) experiments used at least one stable Hg isotope or radioactive Hg or C tracer; (2) reported rate constants assumed irreversible first-order reactions and followed the approaches presented above by Hintelmann et al. (Citation2000) and Marvin-DiPasquale et al. (Citation2000); (3) assumptions and incubation conditions were reported in sufficient detail; (4) rate constants were reported. Several studies reported the percentage of Hg tracer converted to product, either MeHg or Hg(II), which is not directly comparable to rate constants. Rate constants could be calculated from the percentage with Eq. (9) and knowledge of the incubation time. However, reporting of rate constants would make comparison easier. Among the subset were 22 Hg(II) methylation and 17 MeHg demethylation studies that measured product formation once at the end of the incubation time and six Hg(II) methylation studies that measured product formation at multiple time points during incubation. Incubation times varied between 2 hr and 456 hr. Two studies included separate measurements of the bioavailable Hg(II) tracer in addition to the use of a time series (see previous section). The subset was further narrowed based on assessment of uncertainty. Only studies that measured product formation once were considered for further assessment because this was the most common approach, and the goal was to find trends among studies. Sample type and incubation time were found to add uncertainty and are discussed further below. A summary of compiled rate constants and recommended values for Hg(II) methylation and MeHg demethylation for aquatic sediments are given in and discussed in detail in the next sections.
4.1. Difference due to sample type
Rate constants differed among sample types, which included water samples, pure cell cultures, phytoplankton, marine snow, and sediments (Supporting Information Table S1). The lowest was found in phytoplankton (
(Olsen et al., Citation2016) and was half as large as the lowest
in sediment
) (Kronberg et al., Citation2012; Marvin-DiPasquale et al., Citation2003). The highest
was found for sediment (1.5 d−1) (Marvin-DiPasquale et al., Citation2014) and was approximately 20 times higher than the highest value for other types of samples (0.09 d−1) (Eckley et al., Citation2005). The lowest
was found in sediment (0.002 d−1) (Marvin-DiPasquale & Oremland, Citation1998) whereas the lowest
in other sample types was found in marine snow (0.01 d−1) (Ortiz et al., Citation2015). The highest
value was two orders-of-magnitude higher in sediment (63 d−1) (Liu et al., Citation2015) than in other sample types (0.51 d−1) (Lehnherr et al., Citation2011). Differences between sample types can be partially explained in that methylation and demethylation rates are affected by interactions between bacteria (Xu et al., Citation2019; Yu et al., Citation2018), organic material, and minerals (Zhang et al., Citation2019). In considering the variability of rate constants among sample types, further assessment was limited to aquatic sediment samples ().
4.2. Uncertainty related to incubation time
Methylation and demethylation rate constants tended to be larger with shorter incubation times when an irreversible pseudo-first-order reaction was assumed. Because the effect was expected to be most pronounced for larger values, the median of the maximum values reported in all studies of aquatic sediments was calculated (). Maximum reported values tended to be more than three times higher for 2–5 hr incubation time than those incubated for 48 hr. The difference was even larger for
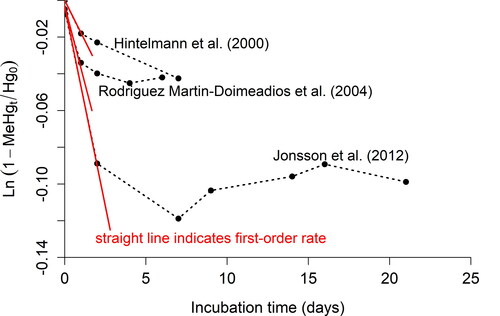
for which the median for 2–5 hr incubation time was more than 40 times higher than those incubated for 48 hr. This observation points to systematic under- or overestimation of rate constants as a function of incubation time. Considering the integrated first-order rate law for Hg(II) methylation, Eq. (17) can be rearranged to an equation with the form of a straight line:
(32)
(32)
A plot of the left side of Eq. (32) versus time t can be used to assess if experimental data support the use of a first-order rate; if so, the rate constant can be determined from the slope. Data from three studies that published raw data for time series experiments (Hintelmann et al., Citation2000; Jonsson et al., Citation2012; Rodrı́guez Martı́n-Doimeadios et al., Citation2004) do not fit a straight line (). As pointed out and discussed by Olsen et al. (Citation2016, Citation2018), deviation from linear behavior can be attributed to reactions other than Hg(II) methylation that influence MeHg concentration during longer incubation times. Possible reactions besides Hg(II) methylation are: (1) MeHg demethylation; and (2) adsorption and precipitation of dissolved Hg(II) tracer that make the tracer less bioavailable. Occurrence of one or both processes will result in underestimation of by Eq. (32). Therefore, the shorter the incubation time, the smaller the uncertainty that is associated with
when assuming a first-order rate. We did not find published time-series data for MeHg demethylation. However, it is likely that the occurrence of back reactions and reduction of tracer bioavailability adds uncertainty to MeHg demethylation rate constants as well during longer measurement periods.
Figure 1. Experimental data from Hintelmann et al. (Citation2000), Rodrı́guez Martı́n-Doimeadios et al. (Citation2004), and Jonsson et al. (Citation2012) for Hg measured at time = 0 and MeHg measured at time = t (black circles) superimposed with integrated first-order rate law for Hg methylation shown as the equation for a straight line y = mx + b: where m = –km and b = 0.
4.3. Hg(II) methylation rate constants
A linear least-squares fit of from selected 2-hr incubation experiments (Hollweg et al., Citation2010; Kim et al., Citation2006; Marvin-DiPasquale et al., Citation2014; Mitchell & Gilmour, Citation2008) with sediment total Hg (THg) indicated that
values were almost constant at around
(95% confidence interval of
) over the considered range of sediment THg (). Studies with a 2-hr incubation time were selected because they were found to be associated with the lowest uncertainty when assuming a pseudo-first-order rate law. However,
values had considerable scatter at higher sediment THg concentrations, resulting in a low coefficient of determination. When separated by study, the coefficient of determination was still low (0.06 for Hollweg et al. (Citation2010), 0.17 for Kim et al. (Citation2006), 0.1 for Mitchell and Gilmour (Citation2008), 0.0003 for Marvin-DiPasquale et al. (Citation2014)). The range of
was largest for data from Marvin-DiPasquale et al. (Citation2014)—small values were one order of magnitude smaller and large values were one order of magnitude larger than in the other three studies. Among the studies compared in , a significant difference is that Marvin-DiPasquale et al. (Citation2014) examined agricultural and nonagricultural wetlands in the San Francisco Bay-Delta, whereas the three other studies assessed estuarine and marine sediments, or salt marshes, in Chesapeake Bay. Agricultural wetlands and estuaries both have high potentials for environmental fluctuations (Singer et al., Citation2016; Windham-Myers et al., Citation2014) due to cultivation/irrigation and tidal variation, respectively. However, both environments are different in terms of redox cycling (complete drying once a year in seasonal wetlands), organic carbon input (plant residues in agricultural wetlands), and sulfur concentrations. A number of factors such as hydrology, bioavailable organic matter concentration, temperature, and electron-acceptor supply (
) are thought to affect Hg(II) methylation, probably by influencing the activity of bacteria that promote methylation (Marvin-DiPasquale et al., Citation2014; Olsen et al., Citation2016). The effect of environmental conditions on Hg methylation are discussed further in Supporting Information (Sec. S4.3). Correlation analyses with data from all four studies were conducted to identify trends in
due to environmental conditions (Supporting Information Table S3 and Figs. S2–S6). Data from Marvin-DiPasquale et al. (Citation2014), for which the range of incubation temperature was largest from the four assessed studies, support the idea that there is a weak dependence of km on temperature, which partially explains the scatter in . Rate data compiled for temperature and other parameters did not show sufficiently strong trends to justify a statistical dependence (Supporting Information Figs. S2–S6). Quantifying the effect of temperature based on published rate constants is particularly difficult because many studies perform tracer incubations at room temperature. Tracer assays that systematically vary one parameter while holding all other parameters constant would be better suited to quantify the effect of environmental conditions on rates. No further statistical analysis was applied because an integral aspect of this study was to assess the utility of literature rate constants to reproduce experimental data using biogeochemical reaction simulations (Section 5). As discussed later, simulations supported a value of
as a good estimate for wetland sediments with low levels of Hg contamination.
Figure 2. Mercury methylation rate constant ( as a function of total sediment mercury concentration [Hg]tot reported by Kim et al. (Citation2006); Mitchell and Gilmour (Citation2008); Hollweg et al. (Citation2010); Marvin-DiPasquale et al. (Citation2014). Error bars on data are uncertainties reported in studies. All studies assumed a pseudo-first-order rate and used single time point measurements after a 2-hr incubation time to calculate
The solid line represents the linear least-squares best fit for all data points, and the dashed line represents the 95% confidence interval.
![Figure 2. Mercury methylation rate constant (km) as a function of total sediment mercury concentration [Hg]tot reported by Kim et al. (Citation2006); Mitchell and Gilmour (Citation2008); Hollweg et al. (Citation2010); Marvin-DiPasquale et al. (Citation2014). Error bars on data are uncertainties reported in studies. All studies assumed a pseudo-first-order rate and used single time point measurements after a 2-hr incubation time to calculate km. The solid line represents the linear least-squares best fit for all data points, and the dashed line represents the 95% confidence interval.](/cms/asset/4122ed3a-0486-4457-9f8f-4d53e49f0f74/best_a_2013073_f0002_c.jpg)
4.4. Methylmercury demethylation rate constants
Published MeHg demethylation rate constants were associated with more variability and more uncertainty than Hg(II) methylation rate constants. The difference between the calculated median of maximum observed rate constants from 2–5 hr and 48 hr incubation time was significantly larger for demethylation than for methylation (reported median in ), which supports the notion of additional uncertainties in As was shown for Hg(II) methylation, uncertainties associated with assuming a first-order rate law can be decreased by using short incubation times. However, MeHg analytical limitations and the existence of multiple pathways limit the usefulness of this approach for estimating demethylation rates. Studies with short, 2-hr incubations (Hollweg et al., Citation2010; Kim et al., Citation2006; Liu et al., Citation2015) required spiking isotopically labeled MeHg tracer at concentrations of 2 to 97 times the ambient MeHg concentration to produce measurable demethylation rates. The use of tracer concentrations that are very different from ambient concentrations could lead to over- or underestimation of rates, as discussed by Olsen et al. (Citation2018). Drott et al. (Citation2008b) found positive or negative correlations between
and MeHg tracer concentration depending on ambient MeHg concentration, but only when the tracer concentration was higher than ambient MeHg. Marvin-DiPasquale and Oremland (Citation1998) found a negative correlation between
and MeHg tracer in uncontaminated wetlands for tracer concentrations that were 4 to 100 times larger than ambient concentrations. Studies with 6–48 hr incubation time () have been shown to be long enough to allow MeHg tracer concentrations at ambient levels (Hintelmann et al., Citation2000; Kronberg et al., Citation2012, Citation2018; Tjerngren et al., Citation2012). Moreover, incubation times of many days generally added uncertainty to rate estimates due to depletion of electron acceptors and nutrients (Levenspiel, Citation1980). As discussed later, biogeochemical reaction simulations indicate that studies with 6–48 hr incubation time are best suited to estimate
Figure 3. Maximum observed methylmercury demethylation rate constants () per site (one or more samples per site) from selected publications. Studies assumed a pseudo-first-order rate and used 6–48 hr incubation times. With identified Hg source means that a Hg-emitting mine or industry lies within approximately 70 km upstream of the site, and no identified Hg source means that no source is present or lies more than 70 km upstream. Sources: a (Marvin-DiPasquale et al., Citation2000), b (Marvin-DiPasquale and Oremland, Citation1998), c (Marvin-DiPasquale et al., Citation2003), d (Tjerngren et al., Citation2012), e (Kronberg et al., Citation2012), f (Kronberg et al., Citation2018), g (Rodrı́guez Martı́n-Doimeadios et al., Citation2004), h (Hintelmann et al., Citation2000), i (Drott et al., Citation2008b).
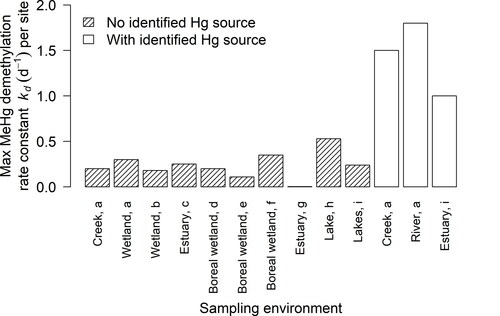
Maximum demethylation rate constants differed with proximity to a Hg contamination source regardless of other environmental conditions. shows that maximum values (6–48 hr incubation time) tended to be considerably larger when an identified industrial or mining-related Hg source was present within approximately 70 km. In the absence of an identified Hg source, lower
values were found for an array of environments (), a trend previously highlighted by Marvin-Dipasquale et al. (Citation2000). Although the number of sites with an identified Hg source is limited, the consistently smaller rate constants among the ten sites with no identified Hg source is striking. The question arises whether the observed rate constants may reflect different biotic demethylation pathways. Schaefer et al. (Citation2004) found that reductive demethylation tends to be faster than oxidative demethylation and that microbial communities at highly contaminated sites might be enriched in Hg-resistant strains. Early on it was found that reductive demethylation is activated by an increasing Hg(II) concentration (Schaefer et al., Citation2004; Silver & Phung, Citation1996; Yu et al., Citation1996). Schaefer et al. (Citation2002) hypothesized that redox conditions indirectly decrease activation of reductive demethylation by decreasing transport of Hg(II) into the cell due to changes in cell-wall composition. Sediment oxidation potential might be a reason for the poor correlation between demethylation rate constants and Hg(II) concentrations observed in the field, perhaps due to the extent of complexation of MeHg with either organic matter or dissolved sulfide (Drott et al., Citation2008b). The poor correlation and the limited knowledge about biochemical mechanisms of oxidative demethylation make it difficult to determine the dominant biotic demethylation pathway under specific environmental conditions.
5. Assessment of selected literature values with biogeochemical reaction simulations
Constrained values for and
in aquatic sediments are useful if they can be applied generally in laboratory or field settings where rates are dependent on many environmental and biogeochemical factors. Due to the complex nature of Hg cycling, a statistical analysis of field and laboratory data for rates of Hg(II) methylation and MeHg demethylation does not always yield conclusive results. Computational simulations can be useful in interpreting field and laboratory data, improving our general understanding, and quantifying Hg cycling. Biogeochemical Hg reaction simulations to date have focused on speciation and transport of Hg (Johannesson & Neumann, Citation2013; Leterme & Jacques, Citation2015; Leterme et al., Citation2014; Liem-Nguyen et al., Citation2017; Richard et al., Citation2016), but less on transformation of Hg (Bessinger et al., Citation2012; Blanc et al., Citation2018). In this section, we expand on the thermodynamic-kinetic model presented by Bessinger et al. (Citation2012) by coupling microbially mediated Hg(II) methylation to degradation of organic matter (OM) and comparing model results to experimental data. The model used here was developed using PHREEQC (Parkhurst & Appelo, Citation2013) and runs as a batch reactor. The goals of the simulations were to: (1) test the sensitivity of the model results to variation in the absolute values of
and
(2) assess the ability of
and
values derived from literature review to reproduce experimental data from incubation experiments by Schwartz and Gilmour (Citation2017); and (3) compare the performance of literature-derived
and
values with
and
values calculated by Schwartz and Gilmour (Citation2017).
5.1. Model formulation
The model presented by Bessinger et al. (Citation2012) and used in this study applied Berner's (Citation1964) early diagenesis model with adaptations made by Van Cappellen and Wang (Citation1996) and Hunter et al. (Citation1998). See Supporting Information (Sec. S5.1) for details of this general approach in which kinetic rates for electron-acceptor reactions are linked to the degradation of OM. Linearized rate expressions for primary redox reactions, second-order (bimolecular) rate laws for secondary reactions, and rate laws for mineral dissolution or precipitation are included in the model (see Supporting Information Table S4) and form a network of kinetic reactions (Hunter et al., Citation1998) in which the methylation and demethylation rates were integrated as two separate reactions. The overall reaction for methylation is assumed to be:
(33)
(33)
The overall reaction assumed for demethylation is:
(34)
(34)
The methylation rate is coupled to OM degradation via the fraction of sulfate reduction
(35)
(35)
where
is the methylation rate constant and
is the concentration of total aqueous Hg(II) (see Supporting Information Sec. S5.2). The simplified approach that all aqueous Hg(II) is assumed to be available for methylation was supported by the finding that simulated aqueous Hg(II) concentrations matched filtered THg (FTHg) concentrations observed by Schwartz and Gilmour (Citation2017) for the study site. However, FTHg is an operational definition dependent on filter size and may consist of dissolved Hg(II) and Hg(II) adsorbed to particulate OM or associated with colloidal or nanoscale
(Liem-Nguyen et al., Citation2017), the latter of which was found in some studies to be available for methylation (Pham et al., Citation2014; Zhang et al., Citation2012). The fraction of Hg(II) that is potentially bioavailable from sediment is sometimes estimated based on extraction with stannous chloride and referred to as “reactive” Hg (
(Johnson et al., Citation2015; Marvin-DiPasquale et al., Citation2008, Citation2014).
is typically a small percentage of THg in sediment. Similarly, a thiol-based extraction suggested that the bioavailable Hg(II) fraction is often less than half a percent of THg (Ticknor et al., Citation2015). A simplified approach of making all dissolved Hg(II) available for methylation was chosen here because quantifying the bioavailability of different Hg(II) species and fractions for model simulations is difficult, as discussed in detail by Hsu-Kim et al. (Citation2013), but could be tested in simulations if data are available.
Coupling of methylation to iron reduction and methanogenesis will be included in future model simulations but was not considered necessary for the current simulations because sulfate reduction was dominant at the modeled site, as discussed in Supporting Information (Sec. S5.2). The demethylation rate is given by:
(36)
(36)
where
is the demethylation rate constant and
is the total aqueous MeHg concentration. Model parameters for kinetic reactions are listed in Supporting Information Table S5. Thermodynamic constants for Hg(II) species that were added to the default LLNL database are listed in Supporting Information Table S6.
5.2. Application and assessment of rate constants
Published data from incubation experiments with salt marsh sediments from Chesapeake Bay (NJ, USA) conducted by Schwartz and Gilmour (Citation2017) were used to set initial conditions, evaluate model performance, and test the sensitivity of model results to variation in and
Schwartz and Gilmour (Citation2017) performed comprehensive measurements of geochemical parameters and measured THg and MeHg concentrations in soil and porewater at five time points over 28 days. Rate constants were calculated from isotope tracer additions. Simulation output from our PHREEQC model was compared to experimental incubation data up to day 20 (see Supporting Information Sec. S5.2 for details of the incubation experiments and model simulations).
In model simulations, the initial aqueous solution and solid phase composition (Supporting Information Table S7) were based on conditions measured at the beginning of the incubation experiment. One model parameter—the OM degradation rate constant (—was determined by fitting to the change in measured sulfate concentration (see ), assuming that OM degradation proceeded primarily via sulfate reduction. The simplified approach to estimate
based on sulfate reduction was considered sufficient to assess
and
selected from the literature because no quantifiable trends associated with specific redox conditions emerged from the literature review, and no major changes in redox conditions were observed during the simulations. All other model parameters were estimated based on independent studies (see Supporting Information Tables S5 and S6). Adsorption of Hg(II) and MeHg on dissolved and particulate OM was not included in the model simulation because it was assumed that sorbed species reached steady state rapidly (<24 hr) and did not significantly change the availability of Hg(II) and MeHg over the incubation time. Adsorption will be included in future studies and is important for model simulations that aim to determine drivers of net MeHg production at a specific site or to assess management options for decreasing bioavailable Hg(II).
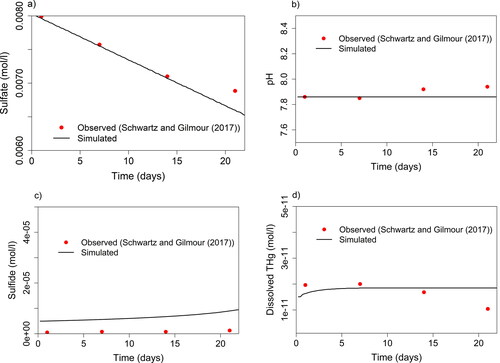
Figure 4. Parameters sulfate (a), pH (b), sulfide (c), and dissolved THg (d) measured (red dots) by Schwartz and Gilmour (Citation2017) during incubation experiments with controlled conditions in comparison to PHREEQC simulation performed in this study (solid lines). Initial conditions of the simulation (Supporting Information Table S7) were based on initial conditions of the incubation.
5.3. Simulation results and discussion
Concentrations of simulated Hg and non-Hg species agreed well with measured concentrations (Schwartz & Gilmour, Citation2017). The observed pH was replicated in the model simulations and did not vary significantly over the incubation time (). The OM degradation rate constant was adjusted such that the simulated and observed decrease in sulfate concentration matched each other (). The simulation slightly overpredicted sulfide concentrations by to
(). Simulated dissolved THg matched observed FTHg well when assuming supersaturation of nano-HgS and setting the maximum initial amount that can dissolve to zero (). Some of the observed FTHg might have been colloidal Hg(II) and is likely associated with OM. It is unlikely that observed and simulated data fit accidentally because the degrees of freedom in the model are reduced by the strong dependence of kinetic reactions on each other, as described by Van Cappellen and Wang (Citation1996). Therefore, the good match for multiple species supports the validity of both the underlying reaction network and the choice of model parameter values.
A sensitivity analysis showed that the average Hg(II) methylation rate constant () selected from 2-hr incubations (see ) reproduced MeHg/FTHg ratios observed in marsh soils by Schwartz and Gilmour (Citation2017) between 6 and 20 days (). At the initial time step, the experimental MeHg/FTHg ratio was approximately
then decreased to approximately 10
at day 6, and remained at this ratio until day 20. Values of
were varied to cover a representative range. The demethylation rate constant was fixed to
based on assessment of reported values () and a sensitivity analysis of
(see below). Simulated dissolved MeHg/THg matched experimental MeHg/FTHg in porewater well. The smallest value of
tested in the simulation resulted in underestimation of MeHg/THg and a small absolute deviation of simulated MeHg from observed MeHg concentrations (Supporting Information Fig. S7). The small deviation illustrates that variations of
have a negligible effect on simulated MeHg concentrations. Simulations with
resulted in a close match of simulated and measured MeHg/THg. Simulations with
and
resulted in overestimation of MeHg/THg, with the first value approximately marking the upper limit of the 95% confidence interval from and the latter value being larger than the majority of
values reported in the literature and considered to be an upper limit. Reconciling observations from the sensitivity analysis leads to
as a good literature-based estimate for the simulated site, and potentially for sites with similar characteristics. Environmental conditions will likely affect the value of
although quantification of those effects was not possible based on the reviewed literature.
Figure 5. Sensitivity of simulated MeHg/Dissolved THg ratio (black line) to Hg methylation rate constant (a) and MeHg demethylation rate constant
(b). MeHg/Filtered THg ratios observed in porewater in incubation experiments by Schwartz and Gilmour (Citation2017) shown by red dots.
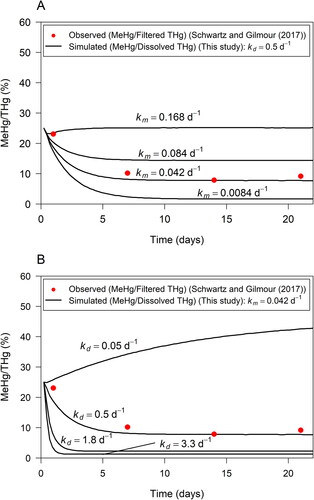
Simulations showed that demethylation rate constants estimated from studies with 6–48 hr incubation time resulted in a good match between simulated and observed MeHg/THg (). For a sensitivity analysis of the methylation rate constant was fixed to
from above. The maximum value from studies with 6–48 hr incubation time without an identified Hg point source,
resulted in the best match of simulated and measured MeHg/THg ratios. Other values for kd, including an average of 2-hr incubations (
Supporting Information Fig. S8) and the maximum
for sites with an identified Hg point source (
), resulted in underestimation of MeHg/THg. The value
chosen to examine a lower limit, resulted in a large overestimation of MeHg/THg ratios and absolute MeHg concentrations. Due to lack of data, we were not able to determine numerical values for uncertainty of
The ratio of and aqueous (porewater) MeHg/THg at approximately steady-state concentrations was used to estimate a lower boundary for
Hg(II) methylation would be strongly favored when
exceeds one considering that the first-order rate is calculated by multiplying the rate constant with the reactant concentration (Hg(II) or MeHg) and that
at steady-state conditions. Porewater MeHg/THg is often less than 0.01, but considerably higher values have been observed (e.g., 0.16 in Mitchell et al., Citation2008; 0.7 in Bailey et al., Citation2017). Based on the optimum
determined in our simulations, we estimated a lower boundary at
However, it should be noted that total bioavailable concentrations of MeHg and Hg(II) in sediments, not just MeHg/Hg(II) in porewater, need to be considered when assessing net MeHg production for a particular site (Skyllberg, Citation2008), and that Hg(II) speciation at non-equilibrium conditions might differ from speciation at equilibrium (steady-state) conditions (Hsu-Kim et al., Citation2013).
The rate constants and
determined from literature values and rate constants
and
determined experimentally by Schwartz and Gilmour (Citation2017) using Hg(II) isotope tracers result in similar MeHg/THg under steady state conditions because the ratio of
is similar (Supporting Information Fig. S9). The data illustrate that steady state conditions are reached faster when the absolute values are larger. It is important to note that the rate laws and assumptions were the same for measured and literature-based values and that incubation times for
were short (2 hr for literature-derived, 24 hr for
calculated by Schwartz and Gilmour (Citation2017)). There was a larger difference in incubation times for
but its effect is difficult to assess because there is generally more variability and uncertainty in
values. The simulations suggest that the rate constants chosen from the literature can be applied generally to aquatic sediments, although simulations with more sites should be conducted to confirm results.
6. Summary and recommendations for application
This study assessed published Hg(II) methylation rate constants ( and MeHg demethylation rate constants (
with the goal of providing general estimates for
and
in aquatic sediments. Similar rate constants were reported for Hg(II) methylation within the water column (Eckley et al., Citation2005), but MeHg produced within the water column might be significant only in systems with a high water/sediment ratio such as reservoirs, lakes, and coastal waters (Eckley et al., Citation2005; He et al., Citation2008; Monperrus et al., Citation2007). Rate laws for Hg(II) methylation and MeHg demethylation were reviewed, published rate constants were compiled and critically evaluated, and biogeochemical reaction simulations based on published data from an incubation experiment (Schwartz & Gilmour, Citation2017) were conducted. This critical review has the following uses and benefits:
Guiding the design of future isotope tracer studies: This review highlights some factors to consider when choosing incubation conditions and experimental variables (Hintelmann et al., Citation2000; Marvin-DiPasquale & Agee, Citation2003; Marvin-Dipasquale et al., Citation2000) for isotope-tracer studies, thereby expanding on previous research (Johnson et al., Citation2015; Jonsson et al., Citation2012; Lehnherr et al., Citation2011; Olsen et al., Citation2016, Citation2018; Regnell & Watras, Citation2019; Rodrı́guez Martı́n-Doimeadios et al., Citation2004). Longer incubation times can lead to underestimation of
and
Comparing rate constants from new studies with existing literature: In this review, we showed that rate constants calculated with the same rate law and based on experiments with similar incubation conditions can be compared to each other. Sensitivity of simulated MeHg and MeHg/Hg(II) was low for
Implementation and testing of experimentally determined rate constants with a biogeochemical model: Reaction simulations are a valuable tool to assess
Provide estimates of
Our recommended values
The difficulty in quantifying the effects of environmental conditions, the high variability of and the high uncertainty when deriving
from measurements pose limitations on predicting net MeHg production. More research is needed on MeHg demethylation rates in particular and in differentiating and quantifying rates of demethylation pathways under different biogeochemical conditions. Whether relatively fast methylation or slow demethylation causes high net MeHg production under a particular set of conditions is important for informing best management practices or mitigation measures to reduce the potential for MeHg biomagnification. This review provides observations and tools that bring us closer to achieving this goal.
Supplemental Material
Download MS Word (926.3 KB)Supplemental Material
Download MS Word (728.5 KB)Acknowledgments
Any opinions, findings, and conclusions or recommendations expressed in this material are those of the authors and do not necessarily reflect the views of the Delta Stewardship Council. This journal article has been peer reviewed and approved for publication consistent with USGS Fundamental Science Practices (https://pubs.usgs.gov/circ/1367/). We thank C. Gilmour and G. Schwartz for providing experimental data. We thank C. Gilmour, M. Marvin-DiPasquale, and three anonymous reviewers for their helpful reviews of this manuscript. Any use of trade, firm, or product names is for descriptive purposes only and does not imply endorsement by the U.S. government.
Disclosure statement
No potential conflict of interest was reported by the authors.
Additional information
Funding
References
- Adediran, G. A., Liem-Nguyen, V., Song, Y., Schaefer, J. K., Skyllberg, U., & Björn, E. (2019). Microbial biosynthesis of thiol compounds: Implications for speciation, cellular uptake, and methylation of Hg(II). Environmental Science & Technology, 53(14), 8187–8196. https://doi.org/10.1021/acs.est.9b01502
- Avramescu, M. L., Yumvihoze, E., Hintelmann, H., Ridal, J., Fortin, D., & R.S. Lean, D. (2011). Biogeochemical factors influencing net mercury methylation in contaminated freshwater sediments from the St. Lawrence River in Cornwall, Ontario, Canada. The Science of the Total Environment, 409(5), 968–978. https://doi.org/10.1016/j.scitotenv.2010.11.016
- Bailey, L. T., Mitchell, C. P. J., Engstrom, D. R., Berndt, M. E., Coleman Wasik, J. K., & Johnson, N. W. (2017). Influence of porewater sulfide on methylmercury production and partitioning in sulfate-impacted lake sediments. The Science of the Total Environment, 580, 1197–1204. https://doi.org/10.1016/j.scitotenv.2016.12.078
- Barkay, T., Miller, S. M., & Summers, A. O. (2003). Bacterial mercury resistance from atoms to ecosystems. FEMS Microbiology Reviews, 27(2–3), 355–384. https://doi.org/10.1016/S0168-6445(03)00046-9
- Beckers, F., Mothes, S., Abrigata, J., Zhao, J., Gao, Y., & Rinklebe, J. (2019). Mobilization of mercury species under dynamic laboratory redox conditions in a contaminated floodplain soil as affected by biochar and sugar beet factory lime. The Science of the Total Environment, 672, 604–617. https://doi.org/10.1016/j.scitotenv.2019.03.401
- Beckers, F., & Rinklebe, J. (2017). Cycling of mercury in the environment: Sources, fate, and human health implications: A review. Critical Reviews in Environmental Science and Technology, 47(9), 693–794. https://doi.org/10.1080/10643389.2017.1326277
- Benoit, J. M. J., Gilmour, C. C., Heyes, A., Mason, R., & Miller, C. (2003). Geochemical and biological controls over methylmercury production and degradation in aquatic ecosystems. ACS Symposium, 835, 1–33. https://doi.org/10.1021/bk-2003-0835.ch019
- Berner, R. A. (1964). An idealized model of dissolved sulfate distribution in recent sediments. Geochimica et Cosmochimica Acta, 28(9), 1497–1503. https://doi.org/10.1016/0016-7037(64)90164-4
- Berner, R. A. (1980). Early diagenesis: A theoretical approach. Princeton University Press.
- Bessinger, B. A., Vlassopoulos, D., Serrano, S., & O'Day, P. A. (2012). Reactive transport modeling of subaqueous sediment caps and implications for the long-term fate of arsenic, mercury, and methylmercury. Aquatic Geochemistry, 18(4), 297–326. https://doi.org/10.1007/s10498-012-9165-4
- Bigham, G. N., Murray, K. J., Masue-Slowey, Y., & Henry, E. A. (2017). Biogeochemical controls on methylmercury in soils and sediments: Implications for site management. Integrated Environmental Assessment and Management, 13(2), 249–214. https://doi.org/10.1002/ieam.1822
- Blanc, P., Burnol, A., Marty, N., Hellal, J., Guérin, V., & Laperche, V. (2018). Methylmercury complexes: Selection of thermodynamic properties and application to the modelling of a column experiment. The Science of the Total Environment, 621, 368–375. https://doi.org/10.1016/j.scitotenv.2017.11.259
- Boudreau, B. P. (1997). Diagenetic models and their implementation. Springer. http://linkinghub.elsevier.com/retrieve/pii/S0264817298800056
- Bravo, A. G., & Cosio, C. (2020). Biotic formation of methylmercury: A bio-physico-chemical conundrum. Limnology and Oceanography, 65(5), 1010–1027. https://doi.org/10.1002/lno.11366
- Chen, C., Herr, J. W., & Tsai, W. (2006). Enhancement of Watershed Analysis Risk Management Framework (WARMF) for mercury watershed management and total maximum daily loads (TMDLs). Electric Power Research Institute.
- Clarkson, T. W. (1997). The toxicology of mercury. Critical Reviews in Clinical Laboratory Sciences, 34(4), 369–403. https://doi.org/10.3109/10408369708998098
- Compeau, G. C., & Bartha, R. (1985). Sulfate-reducing bacteria: Principal methylators of mercury in anoxic estuarine sediment. Applied and Environmental Microbiology, 50(2), 498–502. https://doi.org/10.1128/AEM.50.2.498-502.1985
- Correia, R. R. S., Miranda, M. R., & Guimarães, J. R. D. (2012). Mercury methylation and the microbial consortium in periphyton of tropical macrophytes: Effect of different inhibitors. Environmental Research, 112, 86–91. https://doi.org/10.1016/j.envres.2011.11.002
- Deacon, G. (1978). Volatilisation of methyl-mercuric chloride by hydrogen sulphide. Nature, 275(5678), 344–344. https://doi.org/10.1038/275344a0
- Drott, A., Lambertsson, L., Björn, E., & Skyllberg, U. (2007a). Effects of oxic and anoxic filtration on determined methyl mercury concentrations in sediment pore waters. Marine Chemistry, 103(1–2), 76–83. https://doi.org/10.1016/j.marchem.2006.06.004
- Drott, A., Lambertsson, L., Björn, E., & Skyllberg, U. (2007b). Importance of dissolved neutral mercury sulfides for methyl mercury production in contaminated sediments. Environmental Science & Technology, 41(7), 2270–2276. https://doi.org/10.1021/es061724z
- Drott, A., Lambertsson, L., Björn, E., & Skyllberg, U. (2008a). Do potential methylation rates reflect accumulated methyl mercury in contaminated sediments? Environmental Science & Technology, 42(1), 153–158. https://doi.org/10.1021/es0715851
- Drott, A., Lambertsson, L., Björn, E., & Skyllberg, U. (2008b). Potential demethylation rate determinations in relation to concentrations of MeHg, Hg and pore water speciation of MeHg in contaminated sediments. Marine Chemistry, 112(1–2), 93–101. https://doi.org/10.1016/j.marchem.2008.07.002
- Du, H., Ma, M., Igarashi, Y., & Wang, D. (2019). Biotic and abiotic degradation of methylmercury in aquatic ecosystems: A review. Bulletin of Environmental Contamination and Toxicology, 102(5), 605–611. https://doi.org/10.1007/s00128-018-2530-2
- Eckley, C. S., Gilmour, C. C., Janssen, S., Luxton, T. P., Randall, P. M., Whalin, L., & Austin, C. (2020). The assessment and remediation of mercury contaminated sites: A review of current approaches. The Science of the Total Environment, 707(December), 136031. https://doi.org/10.1016/j.scitotenv.2019.136031
- Eckley, C. S., Luxton, T. P., Goetz, J., & McKernan, J. (2017). Water-level fluctuations influence sediment porewater chemistry and methylmercury production in a flood-control reservoir. Environmental Pollution, 222, 32–41. https://doi.org/10.1016/j.envpol.2017.01.010
- Eckley, C. S., Watras, C. J., Hintelmann, H., Morrison, K., Kent, A. D., & Regnell, O. (2005). Mercury methylation in the hypolimnetic waters of lakes with and without connection to wetlands in northern Wisconsin. Canadian Journal of Fisheries and Aquatic Sciences, 62(2), 400–411. https://doi.org/10.1139/f04-205
- Feng, X., Li, P., Qiu, G., Wang, S., Li, G., Shang, L., Meng, B., Jiang, H., Bai, W., Li, Z., & Fu, X. (2008). Human exposure to methylmercury through rice intake in mercury mining areas, Guizhou province, China. Environmental Science & Technology, 42(1), 326–332. https://doi.org/10.1021/es071948x
- Fleck, J. A., Gill, G., Bergamaschi, B. A., Kraus, T. E. C., Downing, B. D., & Alpers, C. N. (2014). Concurrent photolytic degradation of aqueous methylmercury and dissolved organic matter. The Science of the Total Environment, 484(1), 263–275. https://doi.org/10.1016/j.scitotenv.2013.03.107
- Fleck, J. A., Marvin-DiPasquale, M., Eagles-Smith, C. A., Ackerman, J. T., Lutz, M. A., Tate, M., Alpers, C. N., Hall, B. D., Krabbenhoft, D. P., & Eckley, C. S. (2016). Mercury and methylmercury in aquatic sediment across western North America. The Science of the Total Environment, 568, 727–738. https://doi.org/10.1016/j.scitotenv.2016.03.044
- Fleming, E. J., Mack, E. E., Green, P. G., & Nelson, D. C. (2006). Mercury methylation from unexpected sources: Molybdate-inhibited freshwater sediments and an iron-reducing bacterium. Applied and Environmental Microbiology, 72(1), 457–464. https://doi.org/10.1128/AEM.72.1.457-464.2006
- Foster, T. J., Nakahara, H., Weiss, A. A., & Silver, S. (1979). Transposon A-generated mutations in the mercuric resistance genes of plasmid R100-1. Journal of Bacteriology, 140(1), 167–181. https://doi.org/10.1128/jb.140.1.167-181.1979
- Frohne, T., Rinklebe, J., Langer, U., Du Laing, G., Mothes, S., & Wennrich, R. (2012). Biogeochemical factors affecting mercury methylation rate in two contaminated floodplain soils. Biogeosciences, 9(1), 493–507. https://doi.org/10.5194/bg-9-493-2012
- Fuhrmann, B. C., Beutel, M. W., O’Day, P. A., Tran, C., Funk, A., Brower, S., Pasek, J., & Seelos, M. (2021). Effects of mercury, organic carbon, and microbial inhibition on methylmercury cycling at the profundal sediment-water interface of a sulfate-rich hypereutrophic reservoir. Environmental Pollution, 268, 115853. https://doi.org/10.1016/j.envpol.2020.115853
- Furutani, A., & Rudd, J. W. M. (1980). Measurement of mercury methylation in lake water and sediment samples. Applied and Environmental Microbiology, 40(4), 770–776. https://aem.asm.org/content/40/4/770 https://doi.org/10.1128/aem.40.4.770-776.1980
- Gilmour, C. C., Bullock, A. L., Mcburney, A., & Podar, M. (2018). Robust mercury methylation across diverse methanogenic archaea. American Society for Microbiology, 9(2), 1–13. https://mbio.asm.org/content/9/2/e02403-17.full.pdf
- Gilmour, C. C., Henry, E. A., & Mitchell, R. (1992). Sulfate stimulation of mercury methylation in freshwater sediments. Environmental Science & Technology, 26(11), 2281–2287. https://doi.org/10.1021/es00035a029
- Gilmour, C. C., Podar, M., Bullock, A. L., Graham, A. M., Brown, S. D., Somenahally, A. C., Johs, A., Hurt, R. A., Bailey, K. L., & Elias, D. A. (2013). Mercury methylation by novel microorganisms from new environments. Environmental Science & Technology, 47(20), 11810–11820. https://doi.org/10.1021/es403075t
- Gilmour, C. C., & Riedel, G. (1995). Measurement of Hg methylation in sediments using high specific-activity Hg and ambient incubation. Water, Air, & Soil Pollution, 80(1–4), 747–756. http://www.springerlink.com/index/G301128043174570.pdf https://doi.org/10.1007/BF01189726
- Graham, A. M., Aiken, G. R., & Gilmour, C. C. (2012). Dissolved organic matter enhances microbial mercury methylation under sulfidic conditions. Environmental Science & Technology, 46(5), 2715–2723. https://doi.org/10.1021/es203658f
- He, T., Feng, X., Guo, Y., Qiu, G., Li, Z., Liang, L., & Lu, J. (2008). The impact of eutrophication on the biogeochemical cycling of mercury species in a reservoir: A case study from Hongfeng Reservoir, Guizhou, China. Environmental Pollution (Barking, Essex: 1987), 154(1), 56–67. https://doi.org/10.1016/j.envpol.2007.11.013
- Hintelmann, H., Evans, D., & Villeneuve, J. Y. (1995). Measurement of mercury methylation in sediments by using enriched stable mercury isotopes combined with methylmercury determination by gas chromatography-inductively coupled plasma mass spectrometry. Journal of Analytical Atomic Spectrometry, 10(9), 619–624. https://doi.org/10.1039/JA9951000619
- Hintelmann, H., Keppel-Jones, K., & Evans, D. (2000). Constants of mercury methylation and demethylation rates in sediments and comparison of tracer and ambient mercury availability. Environmental Toxicology and Chemistry, 19(9), 2204–2211. https://doi.org/10.1002/etc.5620190909
- Hoggarth, C. G. J., Hall, B. D., & Mitchell, C. P. J. (2015). Mercury methylation in high and low-sulphate impacted wetland ponds within the prairie pothole region of North America. Environmental Pollution (Barking, Essex: 1987), 205, 269–277. https://doi.org/10.1016/j.envpol.2015.05.046
- Hollweg, T. A., Gilmour, C. C., & Mason, R. P. (2009). Methylmercury production in sediments of Chesapeake Bay and the mid-Atlantic continental margin. Marine Chemistry, 114(3–4), 86–101. https://doi.org/10.1016/j.marchem.2009.04.004
- Hollweg, T. A., Gilmour, C. C., & Mason, R. P. (2010). Mercury and methylmercury cycling in sediments of the mid-Atlantic continental shelf and slope. Limnology and Oceanography, 55(6), 2703–2722. https://doi.org/10.4319/lo.2010.55.6.2703
- Hsu-Kim, H., Eckley, C. S., Achá, D., Feng, X., Gilmour, C. C., Jonsson, S., & Mitchell, C. P. J. (2018). Challenges and opportunities for managing aquatic mercury pollution in altered landscapes. Ambio, 47(2), 141–169. https://doi.org/10.1007/s13280-017-1006-7
- Hsu-Kim, H., Kucharzyk, K. H., Zhang, T., & Deshusses, M. A. (2013). Mechanisms regulating mercury bioavailability for methylating microorganisms in the aquatic environment: A critical review. Environmental Science & Technology, 47(6), 2441–2456. https://doi.org/10.1021/es304370g
- Hunter, K. S., Wang, Y., & Van Cappellen, P. (1998). Kinetic modeling of microbially-driven redox chemistry of subsurface environments: Coupling transport, microbial metabolism and geochemistry. Journal of Hydrology, 209(1–4), 53–80. https://doi.org/10.1016/S0022-1694(00)00219-5 https://doi.org/10.1016/S0022-1694(98)00157-7
- Jensen, S., & Jernelöv, A. (1969). Biological methylation of mercury in aquatic organisms. Nature, 223(5207), 753–754. https://doi.org/10.1038/223753a0
- Johannesson, K. H., & Neumann, K. (2013). Geochemical cycling of mercury in a deep, confined aquifer: Insights from biogeochemical reactive transport modeling. Geochimica et Cosmochimica Acta, 106, 25–43. https://doi.org/10.1016/j.gca.2012.12.010
- Johnson, W. P., Swanson, N., Black, B., Rudd, A., Carling, G., Fernandez, D. P., Luft, J., Van Leeuwen, J., & Marvin-DiPasquale, M. (2015). Total- and methyl-mercury concentrations and methylation rates across the freshwater to hypersaline continuum of the Great Salt Lake, Utah, USA. The Science of the Total Environment, 511, 489–500. https://doi.org/10.1016/j.scitotenv.2014.12.092
- Jonsson, S., Skyllberg, U., Nilsson, M. B., Lundberg, E., Andersson, A., & Björn, E. (2014). Differentiated availability of geochemical mercury pools controls methylmercury levels in estuarine sediment and biota. Nature Communications, 5(1), 4624. https://doi.org/10.1038/ncomms5624
- Jonsson, S., Skyllberg, U., Nilsson, M. B., Westlund, P., Shchukarev, A., Lundberg, E., & Bjo, E. (2012). Mercury methylation rates for geochemically relevant Hg(II) species in sediments. Environmental Science & Technology, 46(21), 11653–11659. https://doi.org/10.1021/es3015327%0A https://doi.org/10.1021/es3015327
- Kerin, E. J., Gilmour, C. C., Roden, E., Suzuki, M. T., Coates, J. D., & Mason, R. P. (2006). Mercury methylation by dissimilatory iron-reducing bacteria. Applied and Environmental Microbiology, 72(12), 7919–7921. https://doi.org/10.1128/AEM.01602-06
- Kim, E. H., Mason, R. P., Porter, E. T., & Soulen, H. L. (2006). The impact of resuspension on sediment mercury dynamics, and methylmercury production and fate: A mesocosm study. Marine Chemistry, 102(3–4), 300–315. https://doi.org/10.1016/j.marchem.2006.05.006
- Kritee, K., Barkay, T., & Blum, J. D. (2009). Mass dependent stable isotope fractionation of mercury during mer mediated microbial degradation of monomethylmercury. Geochimica et Cosmochimica Acta, 73(5), 1285–1296. https://doi.org/10.1016/j.gca.2008.11.038
- Kritee, K., Blum, J. D., Reinfelder, J. R., & Barkay, T. (2013). Microbial stable isotope fractionation of mercury: A synthesis of present understanding and future directions. Chemical Geology, 336, 13–25. https://doi.org/10.1016/j.chemgeo.2012.08.017
- Kronberg, R., Schaefer, J. K., Björn, E., & Skyllberg, U. (2018). Mechanisms of methyl mercury net degradation in alder swamps: The role of methanogens and abiotic processes. Environmental Science & Technology Letters, 5(4), 220–225. https://doi.org/10.1021/acs.estlett.8b00081
- Kronberg, R. M., Tjerngren, I., Drott, A., Björn, E., & Skyllberg, U. (2012). Net degradation of methyl mercury in alder swamps. Environmental Science & Technology, 46(24), 13144–13151. https://doi.org/10.1021/es303543k
- Lehnherr, I., Louis, V. L. S., Hintelmann, H., & Kirk, J. L. (2011). Methylation of inorganic mercury in polar marine waters. Nature Geoscience, 4(5), 298–302. https://doi.org/10.1038/ngeo1134
- Leterme, B., Blanc, P., & Jacques, D. (2014). A reactive transport model for mercury fate in soil-application to different anthropogenic pollution sources. Environmental Science and Pollution Research International, 21(21), 12279–12293. https://doi.org/10.1007/s11356-014-3135-x
- Leterme, B., & Jacques, D. (2015). A reactive transport model for mercury fate in contaminated soil-sensitivity analysis. Environmental Science and Pollution Research International, 22(21), 16830–16842. https://doi.org/10.1007/s11356-015-4876-x
- Levenspiel, O. (1980). The monod equation: A revisit and a generalization to product inhibition situations. Biotechnology and Bioengineering, 22(8), 1671–1687. https://doi.org/10.1002/bit.260220810
- Liem-Nguyen, V., Skyllberg, U., & Björn, E. (2017). Thermodynamic modeling of the solubility and chemical speciation of mercury and methylmercury driven by organic thiols and micromolar sulfide concentrations in boreal wetland soils. Environmental Science & Technology, 51(7), 3678–3686. https://doi.org/10.1021/acs.est.6b04622
- Lim, L., Brodberg, R., Gassel, M., & Klasing, S. (2013). Statewide health advisory and guidelines for eating fish from California’s lakes and reservoirs without site-specific advice. California Environmental Protection Agency.
- Liu, B., Schaider, L. A., Mason, R. P., Shine, J. P., Rabalais, N. N., & Senn, D. B. (2015). Controls on methylmercury accumulation in northern Gulf of Mexico sediments. Estuarine, Coastal and Shelf Science, 159, 50–59. https://doi.org/10.1016/j.ecss.2015.03.030
- Loux, N. T. (2007). An assessment of thermodynamic reaction constants for simulating aqueous environmental monomethylmercury speciation. Chemical Speciation & Bioavailability, 19(4), 183–196. https://doi.org/10.3184/095422907X255947
- Lu, X., Gu, W., Zhao, L., Ul Haque, M. F., DiSpirito, A. A., Semrau, J. D., & Gu, B. (2017). Methylmercury uptake and degradation by methanotrophs. Science Advances, 3(5), 1–6. https://doi.org/10.1126/sciadv.1700041
- Lu, X., Liu, Y., Johs, A., Zhao, L., Wang, T., Yang, Z., Lin, H., Elias, D. A., Pierce, E. M., Liang, L., Barkay, T., & Gu, B. (2016). Anaerobic mercury methylation and demethylation by Geobacter bemidjiensis Bem. Environmental Science & Technology, 50(8), 4366–4373. https://doi.org/10.1021/acs.est.6b00401
- Ma, M., Du, H., & Wang, D. (2019). Mercury methylation by anaerobic microorganisms: A review. Critical Reviews in Environmental Science and Technology, 49(20), 1893–1936. https://doi.org/10.1080/10643389.2019.1594517
- Malm, O., Branches, J. F., Akagi, H., Castro, M. B., Pfeiffer, W. C., Harada, M., Bastos, W. R., & Kato, H. (1995). Mercury and methylmercury in fish and human hair from the Tapajós river basin, Brazil. The Science of the Total Environment, 175(2), 141–150. https://doi.org/10.1016/0048-9697(95)04910-X
- Marvin-DiPasquale, M., Lutz, M. A., Krabbenhoft, D. P., Aiken, G. R., Orem, W. H., Hall, B. D., DeWild, J. F., & Brigham, M. (2008). Total mercury, methylmercury, methylmercury production potential, and ancillary streambed-sediment and pore- water data for selected streams in Oregon, Wisconsin, and Florida, 2003–04, U.S. Geological Survey. Reston, VA (Data Series 375). https://pubs.usgs.gov/ds/375
- Marvin-DiPasquale, M., & Agee, J. L. (2003). Microbial mercury cycling in sediments of the San Francisco Bay-Delta. Estuaries, 26(6), 1517–1528. https://doi.org/10.1007/BF02803660
- Marvin-DiPasquale, M., Agee, J. L., Bouse, R. M., & Jaffe, B. E. (2003). Microbial cycling of mercury in contaminated pelagic and wetland sediments of San Pablo Bay, California. Environmental Geology, 43(3), 260–267. https://doi.org/10.1007/s00254-002-0623-y
- Marvin-DiPasquale, M., Agee, J., McGowan, C., Oremland, R. S., Thomas, M., Krabbenhoft, D., & Gilmour, C. C. (2000). Methyl-mercury degradation pathways: A comparison among three mercury impacted ecosystems. Environmental Science & Technology, 34(23), 4908–4916. https://doi.org/10.1021/es0013125
- Marvin-DiPasquale, M., & Oremland, R. S. (1998). Bacterial methylmercury degradation in Florida everglades peat sediment. Environmental Science & Technology, 32(17), 2556–2563. https://doi.org/10.1021/es971099l
- Marvin-DiPasquale, M., Windham-Myers, L., Agee, J. L., Kakouros, E., Kieu, L. H., Fleck, J. A., Alpers, C. N., & Stricker, C. A. (2014). Methylmercury production in sediment from agricultural and non-agricultural wetlands in the Yolo Bypass, California, USA. The Science of the Total Environment, 484(1), 288–299. https://doi.org/10.1016/j.scitotenv.2013.09.098
- Mason, R. P., Abbott, M. L., Bodaly, R. A., Bullock, O. R., Driscoll, C. T., Evers, D., Lindberg, S. E., Murray, M., & Swain, E. B. (2005). Monitoring the response to changing mercury deposition. Environmental Science & Technology, 39(1), 14A–22A. https://www.osti.gov/biblio/912319 https://doi.org/10.1021/es053155l
- Mergler, D., Anderson, H. A., Chan, L. H. M., Mahaffey, K. R., Murray, M., Sakamoto, M., & Stern, A. H. (2007). Methylmercury exposure and health effects in humans: A worldwide concern. Ambio, 36(1), 3–11. https://doi.org/10.1579/0044-7447(2007)36[3:MEAHEI]2.0.CO;2
- Merritt, K. A., & Amirbahman, A. (2009). Mercury methylation dynamics in estuarine and coastal marine environments - A critical review. Earth-Science Reviews, 96(1–2), 54–66. https://doi.org/10.1016/j.earscirev.2009.06.002
- Mitchell, C. P. J., Branfireun, B. A., & Kolka, R. K. (2008). Assessing sulfate and carbon controls on net methylmercury production in peatlands: An in situ mesocosm approach. Applied Geochemistry, 23(3), 503–518. https://doi.org/10.1016/j.apgeochem.2007.12.020
- Mitchell, C. P. J., & Gilmour, C. C. (2008). Methylmercury production in a Chesapeake Bay salt marsh. Journal of Geophysical Research, 113(G2). https://doi.org/10.1029/2008JG000765
- Monperrus, M., Tessier, E., Amouroux, D., Leynaert, A., Huonnic, P., & Donard, O. F. X. (2007). Mercury methylation, demethylation and reduction rates in coastal and marine surface waters of the Mediterranean Sea. Marine Chemistry, 107(1), 49–63. https://doi.org/10.1016/j.marchem.2007.01.018
- Morel, F. M. M., Kraepiel, A. M. L., & Amyot, M. (1998). The chemical cycle and bioaccumulation of mercury. Annual Review of Ecology and Systematics, 29(1), 543–566. https://doi.org/10.1146/annurev.ecolsys.29.1.543
- Olsen, T. A., Brandt, C. C., & Brooks, S. C. (2016). Periphyton biofilms influence net methylmercury production in an industrially contaminated system. Environmental Science & Technology, 50(20), 10843–10850. https://doi.org/10.1021/acs.est.6b01538
- Olsen, T. A., Muller, K. A., Painter, S. L., & Brooks, S. C. (2018). Kinetics of methylmercury production revisited. Environmental Science & Technology, 52(4), 2063–2070. https://doi.org/10.1021/acs.est.7b05152
- Oremland, R. S., Miller, L. G., Dowdle, P., Connell, T., & Barkay, T. (1995). Methylmercury oxidative degradation potentials in contaminated and pristine sediments of the Carson River, Nevada. Applied and Environmental Microbiology, 61(7), 2745–2753. https://aem.asm.org/content/61/7/2745 https://doi.org/10.1128/aem.61.7.2745-2753.1995
- Ortiz, V. L., Mason, R. P., & Evan Ward, J. (2015). An examination of the factors influencing mercury and methylmercury particulate distributions, methylation and demethylation rates in laboratory-generated marine snow. Marine Chemistry, 177, 753–762. https://doi.org/10.1016/j.marchem.2015.07.006
- Pak, K.-R., & Bartha, R. (1998). Mercury methylation and demethylation in anoxic lake sediments and by strictly anaerobic bacteria. Applied and Environmental Microbiology, 64(3), 1013–1017. https://aem.asm.org/content/64/3/1013 https://doi.org/10.1128/AEM.64.3.1013-1017.1998
- Parkhurst, D. L., & Appelo, C. A. J. (2013). Description of input and examples for PHREEQC Version 3 — A computer program for speciation, batch-reaction, one-dimensional transport, and inverse geochemical calculations. In U.S. Geological Survey Techniques and Methods, Book 6, Chapter A43. Denver, CO: U.S. Geological Survey. https://pubs.usgs.gov/tm/06/a43/
- Parks, J. M., Johs, A., Podar, M., Bridou, R., Hurt, R. A ., Smith, S. D., Tomanicek, S. J., Qian, Y., Brown, S. D., Brandt, C. C., Palumbo, A. V., Smith, J. C., Wall, J. D., Elias, D. A., & Liang, L. (2013). The genetic basis for bacterial mercury methylation. Science (New York, N.Y.), 339(6125), 1332–1335. https://doi.org/10.1126/science.1230667
- Pham, A. L. T., Morris, A., Zhang, T., Ticknor, J., Levard, C., & Hsu-Kim, H. (2014). Precipitation of nanoscale mercuric sulfides in the presence of natural organic matter: Structural properties, aggregation, and biotransformation. Geochimica et Cosmochimica Acta, 133, 204–215. https://doi.org/10.1016/j.gca.2014.02.027
- Podar, M., Gilmour, C. C., Brandt, C. C., Soren, A., Brown, S. D., Crable, B. R., Palumbo, A. V., Somenahally, A. C., & Elias, D. A. (2015). Global prevalence and distribution of genes and microorganisms involved in mercury methylation. Science Advances, 1(9), 1–13. https://doi.org/10.1126/sciadv.1500675
- Qian, J., Skyllberg, U., Frech, W., Bleam, W. F., Bloom, P. R., & Petit, P. E. (2002). Bonding of methyl mercury to reduced sulfur groups in soil and stream organic matter as determined by X-ray absorption spectroscopy and binding affinity studies. Geochimica et Cosmochimica Acta, 66(22), 3873–3885. https://doi.org/10.1016/S0016-7037(02)00974-2
- Ramlal, P. S., Rudd, J. W. M., & Hecky, R. E. (1986). Methods for measuring specific rates of mercury methylation and degradation and their use in determining factors controlling net rates of mercury methylation. Applied and Environmental Microbiology, 51(1), 110–114. https://aem.asm.org/content/51/1/110 https://doi.org/10.1128/aem.51.1.110-114.1986
- Ravichandran, M. (2004). Interactions between mercury and dissolved organic matter-A review. Chemosphere, 55(3), 319–331. https://doi.org/10.1016/j.chemosphere.2003.11.011
- Regnell, O., & Watras, C. J. (2019). Microbial mercury methylation in aquatic environments: A critical review of published field and laboratory studies. Environmental Science & Technology, 53(1), 4–19. https://doi.org/10.1021/acs.est.8b02709
- Richard, J.-H., Bischoff, C., & Biester, H. (2016). Comparing modeled and measured mercury speciation in contaminated groundwater: Importance of dissolved organic matter composition. Environmental Science & Technology, 50(14), 7508–7516. https://doi.org/10.1021/acs.est.6b00500
- Rodrı́guez Martı́n-Doimeadios, R. C., Tessier, E., Amouroux, D., Guyoneaud, R., Duran, R., Caumette, P., & Donard, O. F. X., (2004). Mercury methylation/demethylation and volatilization pathways in estuarine sediment slurries using species-specific enriched stable isotopes. Marine Chemistry, 90(1–4), 107–123. https://doi.org/10.1016/j.marchem.2004.02.022
- Rothenberg, S. E., Anders, M., Ajami, N. J., Petrosino, J. F., & Balogh, E. (2016). Water management impacts rice methylmercury and the soil microbiome. Science of the Total Environment, 572, 608–617. https://doi.org/10.1016/j.scitotenv.2016.07.017
- Schaefer, J. K., Letowski, J., & Barkay, T. (2002). mer-mediated resistance and volatilization of Hg (II) under anaerobic conditions. Geomicrobiology Journal, 19(1), 87–102. https://doi.org/10.1080/014904502317246192
- Schaefer, J. K., & Morel, F. M. M. (2009). High methylation rates of mercury bound to cysteine by Geobacter sulfurreducens. Nature Geoscience, 2(2), 123–126. https://doi.org/10.1038/ngeo412
- Schaefer, J. K., Yagi, J., Reinfelder, J. R., Cardona, T., Ellickson, K. M., Tel-Or, S., & Barkay, T. (2004). Role of the bacterial organomercury lyase (MerB) in controlling methylmercury accumulation in mercury-contaminated natural waters. Environmental Science & Technology, 38(16), 4304–4311. https://doi.org/10.1021/es049895w
- Schartup, A. T., Mason, R. P., Balcom, P. H., Hollweg, T. A., & Chen, C. Y. (2013). Methylmercury production in estuarine sediments: Role of organic matter. Environmental Science & Technology, 47(2), 695–700. https://doi.org/10.1021/es302566w
- Schottel, J. L. (1978). The mercuric and organomercurial detoxifying enzymes from a plasmid-bearing strain of Escherichia coli. Journal of Biological Chemistry, 253(12), 4341–4349. https://doi.org/10.1016/S0021-9258(17)34725-7
- Schwartz, G., & Gilmour, C. (2017). Geochemical controls on activated carbon effectiveness in remediating mercury and methylmercury-contaminated soils [Paper presentation]. Ninth International Conference on the Remediation and Management of Contaminated Sediment, New Orleans, LA.
- Schwartz, G. E., Sanders, J. P., McBurney, A. M., Brown, S. S., Ghosh, U., & Gilmour, C. C. (2019). Impact of dissolved organic matter on mercury and methylmercury sorption to activated carbon in soils: Implications for remediation. Environmental Science: Processes & Impacts, 21(3), 485–496. https://doi.org/10.1039/c8em00469b
- Shen, X., Lampert, D., Ogle, S., & Reible, D. (2018). A software tool for simulating contaminant transport and remedial effectiveness in sediment environments. Environmental Modelling & Software, 109(August), 104–113. https://doi.org/10.1016/j.envsoft.2018.08.014
- Si, Y., Zou, Y., Liu, X., Si, X., & Mao, J. (2015). Mercury methylation coupled to iron reduction by dissimilatory iron-reducing bacteria. Chemosphere, 122, 206–212. https://doi.org/10.1016/j.chemosphere.2014.11.054
- Silver, S., & Phung, L. T. (1996). Bacterial heavy metal resistance: New surprises. Annual Review of Microbiology, 50(1), 753–789. https://doi.org/10.1146/annurev.micro.50.1.753
- Singer, M. B., Harrison, L. R., Donovan, P. M., Blum, J. D., & Marvin-DiPasquale, M. (2016). Hydrologic indicators of hot spots and hot moments of mercury methylation potential along river corridors. The Science of the Total Environment, 568, 697–711. https://doi.org/10.1016/j.scitotenv.2016.03.005
- Skyllberg, U. (2008). Competition among thiols and inorganic sulfides and polysulfides for Hg and MeHg in wetland soils and sediments under suboxic conditions: Illumination of controversies and implications for MeHg net production. Journal of Geophysical Research, 113(G2). https://doi.org/10.1029/2008JG000745
- Skyllberg, U., Qian, J., Frech, W., Xia, K., & Bleam, W. F. (2003). Distribution of mercury, methyl mercury and organic sulphur species in soil, soil solution and stream of a boreal forest catchment. Biogeochemistry, 64(1), 53–76. https://doi.org/10.1023/A:1024904502633
- Summers, A. O., & Sugarman, L. I. (1974). Cell-free mercury (II)-reducing activity in a plasmid-bearing strain of Escherichia coli. Journal of Bacteriology, 119(1), 242–249. https://doi.org/10.1128/jb.119.1.242-249.1974
- Ticknor, J. L., Kucharzyk, K. H., Porter, K. A., Deshusses, M. A., & Hsu-Kim, H. (2015). Thiol-based selective extraction assay to comparatively assess bioavailable mercury in sediments. Environmental Engineering Science, 32(7), 564–573. https://doi.org/10.1089/ees.2014.0526
- Tjerngren, I., Karlsson, T., Björn, E., & Skyllberg, U. (2012). Potential Hg methylation and MeHg demethylation rates related to the nutrient status of different boreal wetlands. Biogeochemistry, 108(1–3), 335–350. https://doi.org/10.1007/s10533-011-9603-1
- Ullrich, S. M., Tanton, T. W., & Abdrashitova, S. A. (2001). Mercury in the aquatic environment: A review of factors affecting methylation. Critical Reviews in Environmental Science and Technology, 31(3), 241–293. https://doi.org/10.1080/20016491089226
- Van Cappellen, P., & Wang, Y. (1996). Cycling of iron and manganese in surface and sediments: A general theory for the coupled transport and reaction of carbon, oxygen, nitrogen, sulfur, iron, and manganese. American Journal of Science, 296(3), 197–243. https://doi.org/10.1126/science.3.53.32 https://doi.org/10.2475/ajs.296.3.197
- Vlassopoulos, D., Kanematsu, M., Henry, E. A., Goin, J., Leven, A., Glaser, D., Brown, S. S., & O'Day, P. A. (2018). Manganese(IV) oxide amendments reduce methylmercury concentrations in sediment porewater. Environmental Science. Processes & Impacts, 20(12), 1746–1760. https://doi.org/10.1039/c7em00583k
- West, J., Graham, A. M., Liem-Nguyen, V., & Jonsson, S. (2020). Dimethylmercury degradation by dissolved sulfide and mackinawite. Environmental Science & Technology, 54(21), 13731–13738. https://doi.org/10.1021/acs.est.0c04134
- Windham-Myers, L., Marvin-Dipasquale, M., Krabbenhoft, D. P., Agee, J. L., Cox, M. H., Heredia-Middleton, P., Coates, C., & Kakouros, E. (2009). Experimental removal of wetland emergent vegetation leads to decreased methylmercury production in surface sediment. Journal of Geophysical Research: Biogeosciences, 114(G2). https://doi.org/10.1029/2008JG000815
- Windham-Myers, L., Marvin-DiPasquale, M., Stricker, C. A., Agee, J. L., Kieu, L. H., & Kakouros, E. (2014). Mercury cycling in agricultural and managed wetlands of California, USA: Experimental evidence of vegetation-driven changes in sediment biogeochemistry and methylmercury production. The Science of the Total Environment, 484, 300–307. https://doi.org/10.1016/j.scitotenv.2013.05.028
- Wood, J. M., Kennedy, F. S., & Rosen, C. G. (1968). Synthesis of Methyl-mercury compounds by extracts of a methanogenic bacterium. Nature, 220(5163), 173–174. https://doi.org/10.1038/220173a0
- Xu, J., Buck, M., Eklöf, K., Ahmed, O. O., Schaefer, J. K., Bishop, K., Skyllberg, U., Björn, E., Bertilsson, S., & Bravo, A. G. (2019). Mercury methylating microbial communities of boreal forest soils. Scientific Reports, 9(1), 518. https://doi.org/10.1038/s41598-018-37383-z
- Yang, Z., Fang, W., Lu, X., Sheng, G. P., Graham, D. E., Liang, L., Wullschleger, S. D., & Gu, B. (2016). Warming increases methylmercury production in an Arctic soil. Environmental Pollution (Barking, Essex: 1987), 214, 504–509. https://doi.org/10.1016/j.envpol.2016.04.069
- Yu, H., Chu, L., & Misra, T. K. (1996). Intracellular inducer Hg2+ concentration is rate determining for the expression of the mercury-resistance operon in cells. Journal of Bacteriology, 178(9), 2712–2714. https://doi.org/10.1128/jb.178.9.2712-2714.1996
- Yu, R. Q., Reinfelder, J. R., Hines, M. E., & Barkay, T. (2018). Syntrophic pathways for microbial mercury methylation. The ISME Journal, 12(7), 1826–1810. https://doi.org/10.1038/s41396-018-0106-0
- Zhang, L., Liang, X., Wang, Q., Zhang, Y., Yin, X., Lu, X., Pierce, E. M., & Gu, B. (2021). Isotope exchange between mercuric [Hg(II)] chloride and Hg(II) bound to minerals and thiolate ligands: Implications for enriched isotope tracer studies. Geochimica et Cosmochimica Acta, 292, 468–481. https://doi.org/10.1016/j.gca.2020.10.013
- Zhang, L., Wu, S., Zhao, L., Lu, X., Pierce, E. M., Gu, B., Wu, S., Zhao, L., Lu, X., Pierce, E. M., & Gu, B. (2019). Mercury sorption and desorption on organo-mineral particulates as a source for microbial methylation. Environmental Science & Technology, 53(5), 2426–2433. https://doi.org/10.1021/acs.est.8b06020
- Zhang, T., Kim, B., Levard, C., Reinsch, B. C., Lowry, G. V., Deshusses, M. A., & Hsu-Kim, H. (2012). Methylation of mercury by bacteria exposed to dissolved, nanoparticulate, and microparticulate mercuric sulfides. Environmental Science & Technology, 46(13), 6950–6958. https://doi.org/10.1021/es203181m
- Zhu, S., Zhang, Z., & Liu, X. (2017). Enhanced two dimensional hydrodynamic and water quality model (CE-QUAL-W2) for simulating mercury transport and cycling in water bodies. Water, 9(9), 643. https://doi.org/10.3390/w9090643
- Zhu, S., Zhang, Z., & Žagar, D. (2018). Mercury transport and fate models in aquatic systems: A review and synthesis. The Science of the Total Environment, 639, 538–549. https://doi.org/10.1016/j.scitotenv.2018.04.397
- Zhu, W., Song, Y., Adediran, G. A., Jiang, T., Reis, A. T., Pereira, E., Skyllberg, U., & Björn, E. (2018). Mercury transformations in resuspended contaminated sediment controlled by redox conditions, chemical speciation and sources of organic matter. Geochimica et Cosmochimica Acta, 220, 158–179. https://doi.org/10.1016/j.gca.2017.09.045