
 ?Mathematical formulae have been encoded as MathML and are displayed in this HTML version using MathJax in order to improve their display. Uncheck the box to turn MathJax off. This feature requires Javascript. Click on a formula to zoom.
Abstract
Composting is an aerobic process that transforms organic wastes into valuable agricultural product, but the composting process frequently results in losses of nitrogen (N) through NH3 volatilization. We evaluated the potential for high-temperature, wood-based biochar to reduce N loss when included as a compost feedstock. Biochar was composted with wood shavings and poultry manure (4:1 v/v) at rates of 0, 20 and 40% (v/v) in replicated, actively aerated 1.43 m3 in-vessel compost piles. Biochar addition caused more rapid temperature increase and truncated thermophilic phase. N loss from the entire compost mass was reduced with 40% and 20% biochar addition compared to the control (29.9, 32.3, and 35.6% N loss, respectively; P value = 0.027). However, assuming no N was lost from the added biochar, difference in N loss was less significant (P value = 0.100). With 40% biochar addition, finished compost had greater NO3--N concentration, lower electrical conductivity, greater carbon to nitrogen ratio, and greater total carbon content. Compost products were amended to soil at rates of 7 or 15 Mg C ha−1 in potato production. Relative to an unamended control, the high application rates tended to decrease bulk density and increase total N in soil, but no differences were detected between the compost or composted biochar treatments. Tuber weights were increased 40% with application of composted biochar (biochar 40% v/v). Biochar is a promising bulking agent for composting which may reduce N loss and increase nitrification. Future studies should examine how specific biochar products affect the compost process, nutrient retention, and crop production.
Introduction
The physical and chemical properties of biochar make it appealing as both an organic soil amendment and compost additive. Wood wastes, manure, paper wastes, municipal sludge, and other organic materials can be converted to a valuable high carbon amendment through pyrolysis, the burning of biomass in an oxygen-limited environment. Biochar properties vary based on feedstocks and pyrolysis temperature, but are generally characterized by large surface area, porosity, cation exchange capacity, and water holding capacity (Lehmann and Joseph Citation2015). Composting is an aerobic, thermophilic, biological processes that increases decomposition rates of organic material. When combined with compost feedstocks, biochar porosity, surface area, surface charge, and other properties can cooperatively enhance the composting environment, influence gas exchange and nutrient cycling, and potentially lead to a superior soil amendment (Steiner et al. Citation2010; Kammann et al. Citation2015; Awasthi et al. Citation2016; Zhou et al. Citation2022). Similarly, the nutrient rich composting environment can enhance the beneficial properties of biochar by loading the surface with nutrients (Prost et al. Citation2013; Zhou et al. Citation2023).
Application of biochar to soils may alter soil properties that can improve production and also sequester carbon. The effects of pure biochar to soil productivity are biochar type- dose-, and soil-specific (Suliman, Gamarra, and Garcia-Perez Citation2018). Positive yield responses are most often associated with mineral-rich biochars made from manure and straw or when used to amend soils with low productivity, especially acidic soils (Baigorri et al. Citation2020; Kammann et al. Citation2015). Loading biochar with nutrients prior to soil application improves plant response (Gao et al. Citation2016) and reflects traditional uses of biochar to improve agricultural soils where char was mixed with manures and other organic wastes to amend poor soils (Kammann et al. Citation2015). Compared to raw organic material, or even compost, biochar carbon is resistant to decomposition and stable in the soil for decades (Paustian et al. Citation2016; Woolf et al. Citation2010). Biochar stability in soil increases with increasing temperature during biochar production because higher temperatures decrease oxygen content and oxygen functional groups and increases carbon content, hydrogen to carbon ratio, and aromatic compounds (Suliman et al. Citation2016). Conversely, biochar produced at lower temperature has more surface oxygenated functional groups which provide polarity, acidity, and wettability and are responsible for many of the beneficial properties associated with biochar (Suliman, Gamarra, and Garcia-Perez Citation2018; Shin, Iwabuchi, and Itoh Citation2024).
When compost pile oxygen concentration is above 5%, organic matter decomposition remains primarily aerobic, is more rapid, and reduces production of methane, nitrous oxide, and odor compounds (Dougherty Citation1999). Initial compost pile porosity will influence oxygen concentration and should be targeted to >40% (Dougherty Citation1999). Actively aerated piles can overcome low porosity to a degree, but anaerobic microsites are more likely with suboptimal porosity even with aeration. Researchers utilizing biochar as an additive have not reported initial pile porosity of amended or control piles, but Sánchez-García et al. (Citation2015) determined that 3% biochar added to a poultry manure and barley straw mix decreased clumps larger than 70 mm diameter, decreasing anaerobic microsites. Several studies have demonstrated that biochar amended piles reduce the time necessary to reach thermophilic conditions (Chaher et al. Citation2020; López-Cano et al. Citation2016; Malinowski, Wolny-Koładka, and Vaverková Citation2019), result in a higher maximum temperature (Chaher et al. Citation2020; Czekała et al. Citation2016; Waqas et al. Citation2018), and decrease the duration of the thermophilic period (Czekała et al. Citation2016; Waqas et al. Citation2018).
Gas emissions are a by-product of the composting process and can result in an increase in greenhouse gases (GHG), odor molecules, and loss of nitrogen. Biochar can reduce emissions by adsorbing molecules on the vast surface area inherent to the additive (Akdeniz Citation2019; Sobol and Dyjakon Citation2022). Sánchez-García et al. (Citation2015) determined that while biochar addition to poultry manure and barley straw did not decrease total N loss, the additive did enhance ammonium formation during the thermophilic phase and nitrification during maturation phase. Similarly, López-Cano et al. (Citation2016) measured an increase in NO3--N during the maturation phase where biochar was added to olive waste and sheep manure compared to the control with no biochar. Higher compost pH promotes NH3+ volatilization and biochar can lower pH and reduce ammonia loss (Akdeniz Citation2019). When biochar was added with lime, NH3+ losses were increased relative to a control without lime or biochar (Awasthi et al. Citation2016). Results of a meta-analysis indicated that biochar tends to increase pH (Zhou et al. Citation2022). Biochar preconditioned to have more oxidized surface functional groups was more effective at retaining N during composting (Hestrin, Enders, and Lehmann Citation2020; Vieira Firmino et al. Citation2024).
In this study, biochar was composted with poultry and wood shavings at 0, 20 and 40% v/v (0, 9.2 and 22% w/w). Because of the relative stability of biochar C, we hypothesized the high level of biochar would impede the composting process and reduce max temperature and the thermophilic period. We also hypothesized that biochar addition would result in less N loss from the ammonia-rich poultry litter feedstock.
Materials and Methods
Composting Experiment
Feedstock Characteristics
Biochar was purchased from Oregon Biochar Solutions (White City, OR) which utilizes two biomass boilers to convert forestry residuals (i.e., Pinus spp. and Pseudotsuga menziesii) into biochar at 871°C in a low oxygen portion of the furnace. Particles are screened to range in size from 1 to 4 mm (93.7%) and additional agronomic, chemical, and physical characteristics are listed in . Prior to compost blending, biochar feedstock was stored, under cover, in several 1.5 m3 super sacks.
Table 1. Values, including analytical methods, for agronomic, physical, and chemical properties of biochar feedstock.
Chicken manure and wood shavings feedstocks were purchased from local suppliers. Wood shavings were moistened with a sprinkler after delivery. Feedstocks were then stored uncovered on concrete pads and, prior to blending, analyzed for physical and chemical characteristics listed in .
Table 2. Physical and chemical properties of chicken manure and wood shavings feedstocks.
Compost Reactor Construction
Compost reactors were based on the “Compost Micro Bin” concept (O2 Compost Citation2021) and are described by Bramwell, Collins, and Bary (Citation2020). Reactor walls and floors were fashioned out of 16 mm thick plywood with outer dimensions of 1.22 m by 1.22 m by 1.22 m (1.67 m3 interior volume). Plywood walls were stabilized with two 38 × 89 mm softwood lumber pieces bolted at the ends. An entire panel could be removed to access the contents of the compost reactor without disassembling the entire vessel. At the base of one wall on each vessel, two holes were cut and removed so that 10.8 cm (outer diameter) perforated PVC pipe could be installed on the flooring of the compost vessel. The floor of the reactor was placed on a wooden pallet for easy transport with a forklift.
Pre-Trial Compost Mix Evaluation
Several researchers have created online tools (i.e., compost mix calculator) that calculate optimal feedstock quantities for compost blends (Calisti, Regni, and Proietti Citation2020). We utilized a compost recipe calculator tool (Bary and Cogger Citation2021), to help optimize our blends in advance of the replicated compost experiment. We evaluated three different compost mixtures (i.e., wood shaving to chicken manure ratios of 3:1, 4:1, and 5:1 [v/v]) to ensure that the carbon to nitrogen ratio (C/N) and free air space of the final base blend was within optimal composting ranges (Alburquerque et al. Citation2008; Gao et al. Citation2010). During the pretrial test, wood shavings blended with chicken manure at a 4:1 (v/v) ratio resulted in a C/N of 25:1 and percent free air space of 34.6 and therefore, this 4:1 mix was selected as the base blend (i.e., control) into which two different biochar rates would be added.
Treatment Mixing and Reactor Filling
Other researchers have investigated biochar incorporation rates ranging from 0.03% to 50% (w/w) (Nguyen et al. Citation2022), we selected a moderate rate to serve as a “standard” and then doubled that rate to assess whether high rates of biochar would inhibit the composting process, thus three compost treatments were evaluated: (1) Control (4:1 wood shavings:chicken manure [v/v]), (2) Biochar 20% (Control + 20% biochar [v/v]), and (3) Biochar 40% (Control + 40% biochar [v/v]). Compost treatments were mixed and placed in reactors over a three-day period (May 21-23, 2019) with one complete treatment replicate mixed each day for a total of 3 replications and 9 compost reactors. One day prior to mixing the first replication, sub samples of the chicken manure and wood shavings were collected and analyzed for moisture and bulk density. These values were used in the compost calculator to figure the correct as-is proportions (v/v and w/w) of the materials and the amount of additional water needed to meet a moisture content of 65%. Treatments were mixed by wet weight by adding chicken manure and wood shavings with a bucket loader into a PTO (power take off) -driven manure spreader (AGCO, New Idea 3718, Duluth, GA) (2.75 m3 volume) placed on truck scales (Intercomp, Medina, MI). Enough material was added for mixing 1 replicate of each of the 3 treatments. The material was homogenized by the spinning action of the machines paddles as it was discharged from the manure spreader and collected on a concrete pad. The material was then mixed with a bucket loader and homogenized with the manure spreader a second time. This material was then split into three equal piles and the Biochar 20% and Biochar 40% mixes were prepared sequentially by adding biochar at the appropriate rate and running through the manure spreader two more times.
All nine of the compost reactors (three for a given treatment) were filled and prepared in the same manner: (1) the 10.8 cm PVC pipes were installed on the floor of the reactor with perforations faced down, (2) a plenum was created over the pipes with 18.9 kg (wet wt.) of wood chips, (3) a mesh screen (1.6 mm pore size) was placed over the plenum, (4) material was added to the reactor until it reached 102 cm (measured from the bottom; 1.43 m3 pile volume) with pauses at 40.6 and 81.3 cm, so that two external temperature sensors (ONSET, Cape Cod, MA) could be installed at each level, and (5) the material was covered with an additional 43.7 kg (wet wt.) of wood chips (“top cap”) and a lid fabricated from a 3.2 mm woven polyethylene tarp with a wood frame was placed on top of the reactor opening.
At each stage of reactor filling, weights for each of the elements (i.e., empty bin, plenum, compost blend, and top cap) were collected by weighing the bin with the truck scales (). In addition, we collected a minimum of 6 subsamples from each of the elements and homogenized them in a clean bucket. Samples were stored frozen in one gallon Ziploc bags until they were analyzed for moisture, electroconductivity (EC), pH, total C and N, and NH4+-N, and NO3--N.
Table 3. Mean dry weights in kgs (± SD, n = 3) at beginning (day 0) and end (day 34) of composting for elements in each of three composting treatments (control, Biochar 20%, and Biochar 40%).
Composting and Compost Sample Collection
The nine compost reactors were stored outdoors for the duration of the trial (33-34 days). Reactors were aerated with ½ horsepower electric blowers (B-Air Koala KP-680, Westchester, PA) for 20 s every 60 min while the external digital temperature probes (ONSET, Cape Cod, MA) collected readings every 15 min. On day 13 (June 4th,5th, and 6th for replication 1, 2, and 3, respectively) one side panel from each of three reactors (control, Biochar 20%, and Biochar 40%) was detached and each element (i.e., top cap, compost blend, and plenum) was carefully removed. The compost blend (still out of the reactor) was analyzed for moisture, turned, and, if needed, supplemented with additional water to reach 65% moisture. Each element was placed back into the reactor, the panel was sealed, and the mixes composted for another 20-21 days. In addition, at days 0, 13, and 33 or 34, two material samples from each of three treatments and repetitions was collected and evaluated for wet bulk density and free air space.
At days 33 (1 replication) and 34 (2 replications; June 24th and 25th), each of 9 compost reactors were disassembled and the elements sampled as follows: (1) one side panel was removed, (2) each element (i.e., top cap, compost blend, plenum) was carefully removed, (3) elements were weighed, (4) samples were collected, homogenized and stored until analysis (percent moisture, EC, pH, total C and N, and NH4+-N, and NO3--N), (5) PVC piping was removed, (6) an additional sample was collected from the compost blend for a compost maturity bioassay (see below), (7) the compost blend was returned to the reactor, cured until November 8, 2019, and then placed into 1.43 m3 super sacks and stored outdoors until use in the field experiment.
Carbon and Nitrogen Mass Balance Calculations on Compost Products
Gains, losses, and transformations of nitrogen and carbon were evaluated via a mass balance approach for the top cap, compost, and plenum. Material dry weights and proportion of total C and N, and NH4+-N and NO3--N at day 0 and 34 of composting were utilized to calculate the element or molecular mass (kg):
Percent change in each element was calculated as the difference between final mass and initial mass divided by the initial mass:
The percent change in total N in compost (i.e., non-biochar material) during composting was evaluated by changing the denominator to include only the initial mass of non-biochar material:
Compost Maturity Bioassay
After 34 days of composting, each of three composting treatments was evaluated for maturity using a cucumber seed emergence and growth bioassay (Thompson et al. Citation2003a). Vermiculite (300 cm3) was soaked with deionized water for 4 h and then gravity-drained so that no free water was visible. An equal volume (300 cm3) of each compost treatment, moistened but void of free water, was blended with the vermiculite to create a homogenous blend which was scooped into three adjacent 9-cell plastic tray rows. Soilless potting media (positive control) and pure vermiculite (negative control) were placed into two, random 9-cell rows and one, random 9-cell row, respectively, such that the two positive control rows were not adjacent to the same compost treatment. Two cucumber seeds were placed into each cell and covered with 1 cm of material; this entire process was replicated three times for each compost treatment. To prevent moisture loss, seedling flats were placed into plastic bags, sealed, and then grown in green house conditions under natural light for 14 days. Percent emergence and seedling vigor were determined in comparisons with the positive control and calculated according to Thompson et al. (Citation2003a).
Potato Field Experiment
Research plots were in Mt. Vernon, WA at Washington State University’s, Northwest Washington Research and Extension Center. Soils were a Skagit silt loam (a fine-silty, mixed, superactive, nonacid, mesic Fluvaquentic Endoaquents) and each of three compost treatments was evaluated as a soil amendment, in potato, at two different rates, 15 and 7 Mg dry C ha−1. Application rates were based upon observations made in our previous field research where a similar rate of application resulted in variable soil and yield responses (Gang et al. Citation2019), we elected to reevaluate that—and a 2x—rate to improve our recommendations for growers interested in utilizing this type of material. Research plots were fertilized on May 5, 2020 with monoammonium phosphate (11-52-0, 163 kg ha−1), langbeinite (0-0-22, 172.6 kg ha−1), muriate of potash (0-0-62, 168.1 kg ha−1), ammonium sulfate (20-0-0, 103.1 kg ha−1), and urea (46-0-0, 196.1 kg ha−1). On June 15, 2020 in a randomized complete block design, replicated four times, seven treatments (Control, Biochar 20% and Biochar 40%, all at high and low rates), including an unamended control, were surface amended, by hand, to 17.69 m2 plots (2.9 × 6.1 m) and tilled with a rototiller on the same day to a depth of 15 cm. lists in-field amendment rates. Using a two-row planter to a depth of 15 cm, cut potatoes (Solanum turberosum L. var. Chieftain) were planted on June 18 and hilled on July 9, 2020. Plot dimensions resulted in three potato rows per plot which were harvested on October 28, 2020. To evaluate the effects of the compost amendments on above- and below-ground potato production, three plants were randomly selected (center row only) so that above ground biomass (i.e., leaves) could be collected, later dried at 43°C, and weighed; tubers, also from the same three representative plants, were collected, counted, and later weighed.
Table 4. Wet and dry application rates (Mg ha-1) for each compost treatment (control compost, Biochar 20%, and Biochar 40%) at the low (7 Mg dry C ha-1) and high (15 Mg dry C ha-1) amendment rates.
Four days prior to harvest and from each of 28 plots, 10-12 soil cores (22 mm dia.) and two bulk density cores (136.4 cm3 each) were collected to a depth of 15 cm. Soil cores were homogenized on site and soils were later dried at 26°C with forced air and analyzed for total C and N, NH4+-N, and NO3--N. In the laboratory, bulk density soil cores were removed from the cylinder, weighed, and recorded. Then, 25 g subsamples were collected, placed in pre-weighed tins, weighed again, and dried at 104°C in a Thermo Fisher Scientific Isotemp 650 G oven (Waltham, MA) for 48 h. After 24 h, dried subsamples (25 g) were re-weighed and soil bulk density was calculated as the weight of dried soil (g) divided by soil volume (cm3).
Compost and Soil Chemical Analysis
Bulk density for compost materials was calculated in the field following TMECC method 03.03 (Thompson et al. Citation2003b) and compost treatments were analyzed for percent moisture, total C, NO3--N, NH4+-N, total N, EC, and pH, and according to the methods listed in the TMECC (Thompson et al. Citation2003c, Citation2003d, Citation2003e, Citation2003f, Citation2003g, Citation2003h). For soils, total C and N were determined on fresh samples by dry combustion using a LECO Tru-Spec CN analyzer (Leco Corp., St. Joseph, MI), and NH4+-N and NO3--N were first extracted using 1 N KCL and then determined by colorimetric analysis on a LACHAT flow-injection analyzer (Hach Company, Loveland, CO) and spectrophotometrically following cadmium reduction, respectively (Gavlak, Horneck, and Miller Citation2005).
Statistical Analysis
Statistical analyses were conducted in the R computing environment (R Core Team Citation2020). Treatment effects for temperature, bulk density, percent moisture, compost chemical parameters, the mass balance compost analysis, the maturity bioassay, and all components of the field experiment were analyzed with linear mixed models using the lmer function (Bates et al. Citation2015). Treatment was included as a fixed effect and replication as a random effect. When appropriate, means were separated using Tukey’s Pairwise comparisons (p < 0.05) with the multcomp package (Hothorn, Bretz, and Westfall Citation2008). Time periods for the bulk density and percent moisture analysis (day 0, 13, and 34) and for the compost chemical analysis (day 0 and 34) were treated separately.
Results and Discussion
Compost Physical Parameters (Wet Bulk Density, Percent Moisture, and Temperature)
Within each collection period and in comparisons with the control, mean bulk density values declined when biochar was incorporated as a feedstock. Only at the beginning of the experiment (day 0), however, were differences measured among the three treatments (). The initial reduction and the following decreases in bulk density were related to the rate at which the biochar material was incorporated (i.e., greater rate of incorporation yielded greater reduction in bulk density) (). This is consistent with smaller, laboratory scale experiments where similarly sized biochar was incorporated at equivalent rates resulting in compost bulk density reductions (Ravindran et al. Citation2019). As others have noted, the reductions in compost bulk density measured here are likely related to the porosity of the biochar which results in intrinsically low bulk density values (i.e., in the biochar). When biochar is incorporated into compost, it dilutes the compost, reducing the overall bulk density of the blended material. Similar responses following biochar incorporation have been measured in soils and are also attributed to this dilution effect (Blanco-Canqui Citation2017).
Table 5. Mean values for compost bulk density (BD) and moisture content (MC) for each of three treatments at three collection periods day 0, 13, and 34.
At each collection period (Day 0, 13, and 34) mean values for moisture content increased with biochar incorporation rates, but differences were measured only at day 34 in comparisons between the control and the highest rate of incorporation (Biochar 40%) (). We adjusted compost moisture with supplemental water at day 0 and 13 to maintain moisture levels at 65%. Under similar moisture conditions but much larger scales, López-Cano et al. (Citation2016) also reported an increase in compost moisture content when holm oak wood biochar (650°C) was incorporated at lower rates (4% dry weight). However, the increase reported by these authors was measured only after the large windrow piles were covered with a polypropylene woven geotextile. In contrast, Wang et al. (Citation2013) measured decreases in compost moisture when bamboo biochar (600°C) was incorporated at a rate of 3% (wet weight) in similar volumes to ours but with no supplemental water. In a bench-scale experiment, Waqas et al. (Citation2018) measured a similar reduction in moisture content and attributed the reduction to increased microbial activity, increased temperature, and greater release of water vapor.
At the highest biochar rate, we measured a 6% increase in moisture content relative to the control (), even though observations of the compost at day 13 and day 34 indicated that the biochar amended compost appeared dryer. Larger differences may have been masked by the supplemental water added to all piles at day 13. Because of its porous structure, biochar is considered to be effective at holding onto water and preventing drying during the composting process (Akdeniz Citation2019). Biochar surface chemistry, particularly the availability of acidic functional groups, also influences water content, especially at lower matric potentials. Suliman et al. (Citation2016) determined that biochar produced at higher temperature tended to have lower available water content and lower acidic functional groups than biochar produced at lower temperatures and, the relationship was stronger at −500 kPa than 0 kPa. Biochar is also often hydrophobic and high temperature biochars, such as that used in this study, tend to have less hydrophobicity than lower temperature biochars (Suliman et al. Citation2016). Pore size distribution also plays a role in water holding capacity and water availability: large macropores do not hold available water while micropores do not readily release water for plants or, in the case of compost, microorganisms (Blanco-Canqui Citation2017). Thus, compost feedstocks and biochar can interact to influence pore size, moisture content, and moisture availability. This suggests, in part, that moisture content (i.e., gravimetric water measurements) may not provide adequate information on compost water availability, and that other assessments are needed. For the end user (e.g., farmer, land manager), however, moisture content is not typically a measure of quality, so much as it is a measure of usability; composts with moisture content greater than 60% can clump together, making the material difficult to spread, but because the inherent physicochemical properties of biochar make it unique, this rule of thumb may not be appropriate with this type of feedstock.
Temperatures in each of three compost treatments exceeded and remained above 55°C for at least three days, indicating active decomposition and hygienization (). At the shallow and deep levels (81.2 and 40.6 cm measured from the base, respectively), composting temperatures were nearly identical for the duration of the study, except for those in the Biochar 20% treatment where temperatures at shallow depth () increased at a slower rate than those deeper in the pile (). Generally, and at both depths, temperatures in the biochar amended composts climbed through the mesophilic stage and reached thermophilic temperatures (55°C) at 36 hours (h), 9 h faster than the control (). After 2.5 days of composting, however, control compost temperatures exceeded, and remained greater, than those observed in the biochar treatments (). Even though temperatures in the biochar amended composts increased at rates greater than those in the control (first 48 h), the heat generated in the biochar composts reached lower temperature maximums in the deep part of the pile (Biochar 40%<Biochar 20%=control; p < 0.1) and dissipated at greater rates which, was especially evident in the biochar treatment amended at the highest rate (40%) ().
Figure 1. Compost temperatures for each of three treatments at two depths, 40.6 (deep) and 81.3 cm (shallow) measured from the base. Panels (a) and (b), and (c) and (d), illustrate temperatures within the first five days and the remaining 29 days, respectively. Bars are standard error of the mean for daily mean temperature (n = 3).
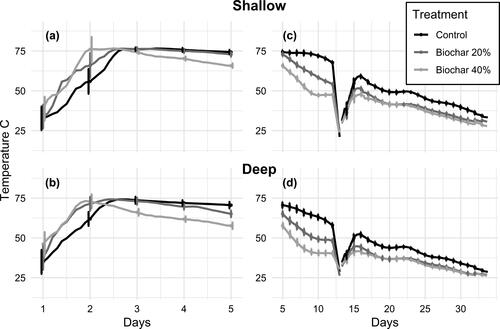
In comparisons with an unamended control at lower (1%) and similar (10, 15, and 20%) rates (w/w) of biochar incorporation, other researchers have measured analagous temperature accelerations up to, and through, the thermophilic stage, (Mao et al. Citation2018; Waqas et al. Citation2018; Wei et al. Citation2014). In these studies, temperatures in the biochar co-composts remained elevated for the duration of the trial, unlike the heat dissipation and temperature decline we measured in our biochar amended composts. One critical difference may be scale. In the previously mentioned studies, biochar amended composts were evaluated in laboratory size compost reactors with volumes less than 100 L (0.3 m3) in size. Simulations, and thus comparisons, between laboratory and field-scale composting are difficult, partly because of differences in surface area to volume ratios (Mason and Milke Citation2005) and environmental factors (Baptista, Silveira, and Antunes Citation2012). Studies at similar scales, like Wang et al. (Citation2013), and those larger, like López-Cano et al. (Citation2016) (9 m3 pile, a size 6 times greater than our 1.83 m3), have reported similar patterns in their temperature profile i.e., initial acceleration and then a decline in biochar amended compost when compared to the control. Accelerations in the temperature rate increase, and extensions of the thermophilic stage are often attributed to biochar’s high surface area and porosity which, can provide critical habitat for increased microbial activity (Jaafar, Clode, and Abbott Citation2015). The temperature rate increases we measured here, likely reflect increased microbial activity. In composts, microbial activity is often illustrated by temperature curves like those we presented in . The down slope of that curve represents a decline in microbial activity resulting from several conditions that can arise individually or simultaneously: temperatures rise to biologically prohibitive levels, easily degraded substrates are exhausted, and/or moisture limitations cause microbial dormancy (Ryckeboer et al. Citation2003). Because our measurements indicate that moisture content was within an acceptable range, the heat dissipation we observed is likely a reflection of inhibited microbial activity caused by elevated temperatures and exhausted substrates. However, if biochar influences the amount of water and its availability in compost, then water content would not be a reliable measure of that property and our observed temperature decline could be related to moisture limitation. Additionally, it cannot be ruled out that physical changes in the compost resulting from biochar incorporation also played a role in temperature modulation. For instance, lower compost bulk densities () may contribute to these temperature differences by altering aeration and thus, heat exchange. The exact mechanism, however, is unknown.
Compost Chemical Parameters
In pre-compost samples (day 0), mean values of total N, pH, EC, NO3--N were generally unaffected by treatment except for differences in total C and C:N (Biochar 40% > control) (). Though not significant (P value = 0.370), NH4+-N values decreased in an obvious trend with increasing biochar rate and in comparisons with the control (). In post-compost samples (day 34) and in comparisons between treatments, no differences were measured in mean values for total N, pH and NH4+-N (). Total C, C:N ratios and NO3--N, however, increased with the increase in biochar, while EC, on the other hand, decreased in response to the added amendment ().
Table 6. Mean values for compost chemical and nutrient properties in each of three treatments collected at days 0 (D0) and 34 (D34) of composting.
When nutrient concentrations are measured on material before and after composting, changes in concentration do not provide information on potential gains or losses (on a mass basis) because of the significant mass loss that occurs during composting. Post-compost nutrient concentrations, however, are reported widely in the literature and are included here for comparison. Later (below), we present analysis following a mass-based approach. Many of the chemical properties measured at day 0 and 34 are in line with expectations. At the beginning of the experiment (day 0), the difference in total C and C:N ratios and the trends in NH4+-N values likely reflect one function: the additional C added in the form of biochar and its dilutive effect on the concentration of other elements. At day 34, however, the elevated amounts of total C and C:N ratios (Biochar 40% > control) could illustrate different but related processes: the recalcitrance of the biochar and/or its ability to adsorb organic C (e.g., water extractable organic C) (Prost et al. Citation2013; Hestrin, Enders, and Lehmann Citation2020; Mujtaba et al. Citation2021). While the function is not elucidated here, others have measured similar increases in total C and C:N following biochar incorporation at rates far lower than ours, and at scales similar and much larger (Hagemann et al. Citation2018; Wei et al. Citation2014). The elevated concentration of nitrates we measured in our Biochar 40% treatment is consistent with other reports, as much recent work has focused on biochar and its role in capturing compost nitrates (Kammann et al. Citation2015; Hagemann, Kammann, et al. Citation2017; Vieira Firmino et al. Citation2024). Mean EC values at day 34 followed a very similar trend to those at day 0, but the magnitude of the difference was reduced over time (i.e., day 0 vs 34) likely resulting from the mass and volume reduction that occurs during composting. Thus, the decrease in EC is likely the result of dilution. Wang et al. (Citation2013), composting on a similar scale, reported lower EC values for a compost pile amended with biochar, but their observations were not direct comparisons with the control compost, so it is difficult to define relationships between the two studies.
Gains, Losses, and Transformations of Nitrogen and Carbon
In the top cap material, mass and percent change for total C and N and NO3--N and NH4+-N were unaffected by biochar incorporation and in comparisons with the control, some trends, however, were observed: total C loss increased, while total N and NH4+-N decreased following increasing rates of biochar incorporation (). Measurements in the compost and plenum materials revealed differences among treatments in mass and percent changes for total N: as the rate of biochar incorporation increased, total N values, in terms of mass loss and percent change, decreased (). NO3--N percent change values illustrated potential differences in N movement (i.e., leaching into the plenum) as values were higher in the composts and lower in plenums amended with biochar ().
Table 7. Mass (kgs) and percent change from day 0 to day 34 in total C, total N, NO3-N, and NH4-N in different composting elements (top cap, compost, plenum).
In our study, within the compost portion of the pile (not including plenum and top cap), C mass and percent loss were not different among treatments (P value = 0.207; ) though both the C percentage and C mass loss were greater in the control. Some researchers have determined that biochar addition increases C decomposition (Waqas et al. Citation2018; Hestrin, Enders, and Lehmann Citation2020), while others have shown little to no effect (Malinowski, Wolny-Koładka, and Vaverková Citation2019; Steiner et al. Citation2010). Sánchez-García et al. (Citation2015) suggested that the increased C decomposition due to addition of as little as 3% (w/w) biochar could decrease composting time by 20%. Mechanisms like enhanced aeration, stimulation of microbial activity, and adsorption of inhibitory compounds are attributed to measurements of increased organic matter degradation (Akdeniz Citation2019). We measured improvements in bulk density, moisture content, and temperature (proxies for increased aeration and microbial activity) in our biochar amended composts (; ), and so our C loss measurements are surprising, given the potentially optimized environment for mineralization. Our inability to detect differences among treatments, particularly between biochar incorporation rates, may reflect limitation in surface chemistry for this particular biochar (e.g., unoxidized vs. oxidized) which is known to affect C loss (Hestrin, Enders, and Lehmann Citation2020). This suggests that the physical properties of a softwood, high temperature biochar can improve C decomposition in co-composting, but that the relationship between decomposition and biochar incorporation rate is not strictly linear.
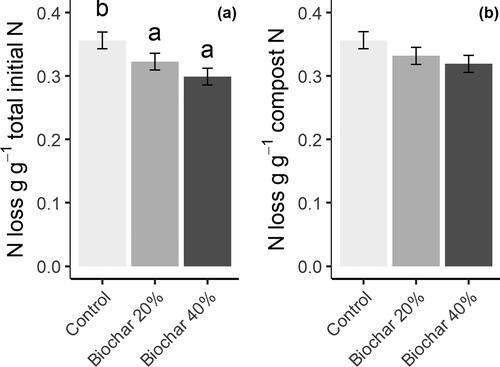
Total N loss from the control treatment (compost pile) was greater than from biochar amended piles in terms of both mass change (P value < 0.001) and percent loss (P value = 0.027; ). To assess whether the loss was due to an increase in nitrogen adsorption by biochar or merely a reduction in nitrogen mineralization from biochar, we examined nitrogen loss from the non-biochar portion of the compost (). Assuming all N loss was from the non-biochar portion of the compost pile, then the reduction in N loss from biochar addition was less significant (P value = 0.100; ) indicating that the lack of N mineralization from biochar accounted for a significant portion of the reduction in N loss. Hestrin, Enders, and Lehmann (Citation2020), from 2 L vessels composted in a temperature regulated environment, determined that biochar amendment increased N loss from poultry and straw compost when the biochar was not preconditioned to have more oxygen functional groups. The greater reactivity of the oxidized biochar likely increased NH3 adsorption, though increased microbial activity could also assimilate more N into microbial biomass. The decreases in total N we measured using our unoxidized biochar and including the analysis for biochar and non-biochar portions, contradict these findings. As the authors of that paper indicated and as we noted earlier, differences in scale likely explain conflicting results. This is critically important for those making recommendations to potential users of this strategy.
Figure 2. Nitrogen loss from the total initial mass, including biochar (a) and the non-biochar compost (b).
Our study design also included a plenum and top cap, both composed of wood shavings, which acted as proxies for tracking N as it volatilized or leached out of the compost portion of the bin. Though not conclusive evidence, at the highest rate of biochar incorporation, increases in top cap NO3--N (mass basis) were lowest (). If nitrification proceeded uninhibited in the top cap, biochar in the compost could have sorbed NH3 gas or adsorbed organic N compounds. Either mechanism would reduce the flux of NH3 gas into the top cap and may explain the lower increases in top cap NO3--N.
Similarly, N accumulation in the plenum was reduced as the biochar incorporation rate increased, likely due to a reduction in the downward movement of soluble organic N compounds (). This difference is likely explained by the fact that there was less N in the starting compost above the plenum. Assuming biochar N is not mineralized, then there is even less N available for downward movement in biochar compost. An organic coating, relatively abundant in N containing compounds was recently identified, spectroscopically, on co-composted biochar (Hagemann, Joseph, et al. Citation2017). The biochar in that project (woody waste, 800°C) was similar to ours in feedstock and production temperature (woody waste, 871°C) and thus, our biochar could have sorbed similar N containing compounds. Though we did not measure gaseous emissions nor leachate, N mass changes in the plenum and top cap, suggest that the plenum and top cap did not significantly prevent N loss (i.e., only 6-7% of N loss is accounted for in gains in the plenum and top cap; ). Biochar, if rich in surface oxygenated functional groups, could perform better than woodchips as a top cap if the goal were to reduce N volatilization.
Compost Maturity Bioassay
All treatments were considered “very mature” and no differences were measured in the seedling emergence or vigor bioassays. Relative to the positive control, emergence was 98.4, 95.1, and 94.7% in the control, Biochar 20%, and Biochar 40% treatments, respectively. Also relative to the positive control, seedling vigor was 104, 121, and 102% in the control, Biochar 20%, and Biochar 40% treatments. Relative to the negative control, emergence was 101.9, 98.4, and 98.4% in the control, Biochar 20% and Biochar 40% treatments, respectively. Seedling vigor in the negative control was measurable in only one repetition and so averages were not calculated for comparison.
Potato Field Experiment
Because the composts cured in super sacks for several months before the field trial, selected chemical and physical properties for each of the compost treatments are listed in .
Table 8. Compost physical and chemical properties for each of three treatments after curing and immediately prior to amendment.
At 15 cm and following amendment with six different treatments, differences were detected only in comparisons between unamended control soils and soils amended with HighComp (high compost rate) and HighBiochar 40% (high Biochar 40% rate) treatments which, were measured in bulk density and total N mean values (). In rate comparisons within, and among, control and biochar composts, none of the soil physical or chemical properties we evaluated were affected by treatment rates ().
Table 9. Mean values for soil physical and chemical properties following amendment and one potato growing season.
Our field data is limited to one application and growing season and should be interpreted with care. Still, the reduction in soil bulk density which was measured among soils in the unamended control and those amended with the HighComp treatment is not surprising given that soils in the HighComp treatment were amended at the highest material rate (116 Mg ha−1 [wet wt.]; ). It is surprising, however, that none of the other materials had any impact on soil bulk density. In potato fields at similar application rates, Wilson et al. (Citation2018) evaluated different composted materials but reported decreases in soil bulk density in only a few of the amended plots. In that same study, however, and after a second year of compost application, soil bulk density decreased in all amended plots in comparisons with the unamended control. Because our measurements are limited to one growing season, a second compost application and growing season may have resulted in greater effects on soil bulk density.
Following amendment, results for soil N, including total N, NO3--N, and NH4+-N, did not illustrate clear trends (). For total N, differences among treatments were measured only between the highest (HighComp and HighBiochar 40%) and the lowest (Control) values (). Concentrations of inorganic N, though not significant, were highest in plots receiving the HighBiochar 40% treatment which is interesting given that its amendment rate was lowest compared to the other high rates ( and ). In fact, as a fertilizer, the HighBiochar 20% treatment provides more inorganic N than the other two materials, which may suggest that the high amount of pyrogenic C in the HighBiochar 40% treatment is affecting the interplay between soil C and N cycles. Thanks to the work by Hagemann, Kammann, et al. (Citation2017), we now know that standard extractions (e.g., 1 h) do not recover the total amount of NO3--N and NH4+-N in biochar amended composts. The authors in the previous study did not evaluate biochar amended composts in the soil, but it is reasonable to suggest that the soil NO3--N and NH4+-N values we measured do not represent the total amount of available NO3--N and NH4+-N (i.e., there is some inorganic N that is slowly available which is undetected in 1 h extractions). This is clearly an area of research that deserves further attention. In addition, because all plots received supplemental fertilizer, potential differences among treatments could have been masked by that additional fertilizer N.
Analogous to the soil data, potato plant biomass revealed a difference between the unamended control plots and those amended with the HighBiochar 40% treatment, but that difference was observed only in tuber weight, as leaf weight and tuber number were unaffected following amendment and one growing season (). In other potato research, owing to differences in supplemental fertilizer rates, and the rates and feedstocks of the compost products, responses in potato plant biomass (tuber) following compost amendment are variable: some have measured increases (Bernard et al. Citation2014; Larkin et al. Citation2010) while others have reported no effect (Wilson et al. Citation2019). In potato systems, generally, composts are not utilized as an amendment to supplement soil fertility, rather, they are amended to the soil as a ‘non-nutrient’ soil conditioner that can improve soil properties, like those of soil moisture. In our study, it may be that elevated moisture content in the HighBiochar 40% treatment () impacted the soil environment in a beneficial manner and improved yields, just slightly. In soil and yield responses, it cannot be discounted that the quantity and quality (i.e., proportion of pyrogenic C) also differed among treatments and this likely played some role in the differences measured here. As noted earlier, however, drawing clear conclusions from one growing season is difficult and extrapolation from this data set should be done with caution.
Table 10. Mean values for potato plant biomass following amendment including above (leaves) and below ground (tuber) variables.
Conclusions
When biochar was incorporated into a chicken manure and wood chip compost at 20 and 40% v/v (9.2 and 22% w/w), we measured significant differences in compost physical and chemical properties, but these differences rarely revealed the incremental rate at which the biochar was incorporated. Temperatures in the 40% biochar composts reached the thermophilic stages quicker than that of the control, but these temperatures also dissipated at greater rates, and the truncated temperature profile we measured in our 1.43 m3 vessels did not negatively affect mineral N content, EC, pH, or compost maturity. In mass-based nutrient analyses, we measured reductions in percent N loss for the 40% biochar treatment, but if we assumed that no N was lost from the biochar these reductions became less significant. On a concentration basis, the higher NO3--N levels measured in the Biochar 40% treatment did not transfer to similar increases in a field experiment where soil NO3--N was measured. Potato yield increased, but only in plots receiving the Biochar 40% compost amended at high rates (96.5 Mg ha−1) and in comparisons with an unamended control. Soil and yield data, however, were collected from one growing season and must be carefully interpreted. For those interested in utilizing this type of strategy careful consideration should be given to incorporation rates as the significant differences measured here were in response to high, and potentially cost prohibitive, rates of biochar incorporation.
For future work, additional experiments that evaluate compost N loss reductions should carefully consider the biochar feedstock, biochar production temperature, and biochar conditioning and tailor each for a particular downstream end user. Attributes such as pH and oxygen/carbon atomic ratio influence NH3+-N retention and can be influenced by production temperature and biochar conditioning (Shin, Iwabuchi, and Itoh Citation2024; Vieira Firmino et al. Citation2024). Increased adoption of biochar as a compost feedstock will rely on balancing improved compost attributes, such as nutrient retention, with the added cost of how specific properties affect compost attributes. Multiple year field trials that utilize a co-composted biochar would also help elucidate the longevity and performance of N that may become slowly available in soils following biochar co-compost amendment.
Acknowledgments
We are grateful to Liz Myhre of Washington State University for assistance in sample collection and analysis and Manuel Garcia-Perez of Washington State University for characterization of the biochar used in this study.
Disclosure Statement
The authors declare on conflicts of interest.
Data Availability Statement
Data that support the findings of this study are available at zenodo.org with the identifier: http://doi.org/10.5281/zenodo.4763775.
Additional information
Funding
References
- Akdeniz, N. 2019. “A Systematic Review of Biochar Use in Animal Waste Composting.” Waste Management (New York, N.Y.) 88: 291–300. doi: 10.1016/j.wasman.2019.03.054.
- Alburquerque, J. A., D. McCartney, S. Yu, L. Brown, and J. J. Leonard. 2008. “Air Space in Composting Research: A Literature Review.” Compost Science & Utilization 16 (3): 159–170. doi: 10.1080/1065657X.2008.10702374.
- ASTM International (American Society of Testing and Materials). 2013. ASTM D1762-84 Standard Test Method for Chemical Analysis of Wood Charcoal. West Conshohocken, PA: ASTM International.
- ASTM International (American Society of Testing and Materials). 2014. ASTM D4373-14 Standard Test Method for Rapid Determination of Carbonate Content of Soils. West Conshohocken, PA: ASTM International.
- ASTM International (American Society of Testing and Materials). 2019. ASTM D6556-19a Standard Test Method for Carbon Black – Total and External Surface Area for Nitrogen Absorption. West Conshohocken, PA: ASTM International.
- Awasthi, M. K., Q. Wang, X. Ren, J. Zhao, H. Huang, S. K. Awasthi, A. H. Lahori, R. Li, L. Zhou, and Z. Zhang. 2016. “Role of Biochar Amendment in Mitigation of Nitrogen Loss and Greenhouse Gas Emission during Sewage Sludge Composting.” Bioresource Technology 219: 270–280. doi: 10.1016/j.biortech.2016.07.128.
- Baigorri, R., S. San Francisco, Ó. Urrutia, and J. M. García-Mina. 2020. “Biochar-Ca and biochar-Al/-Fe-Mediated Phosphate Exchange Capacity Are Main Drivers of the Different Biochar Effects on Plants in Acidic and Alkaline Soils.” Agronomy 10 (7): 968. doi: 10.3390/agronomy10070968.
- Baptista, M., A. Silveira, and F. Antunes. 2012. “Theoretical Analysis of the Kinetic Performance of Laboratory- and Full-Scale Composting Systems.” Waste Management & Research: The Journal of the International Solid Wastes and Public Cleansing Association, ISWA 30 (7): 700–707. doi: 10.1177/0734242X11433528.
- Bary, A., and C. Cogger. 2021. Compost Mix Calculator. Washington, USA: Washington State University.
- Bates, D., M. Mächler, B. Bolker, and S. Walker. 2015. “Fitting Linear Mixed-Effects Models Using lme4.” Journal of Statistical Software 67 (1): 1–48. doi: 10.18637/jss.v067.i01.
- Bernard, E., R. P. Larkin, S. Tavantzis, M. S. Erich, A. Alyokhin, and S. D. Gross. 2014. “Rapeseed Rotation, Compost and Biocontrol Amendments Reduce Soilborne Diseases and Increase Tuber Yield in Organic and Conventional Potato Production Systems.” Plant and Soil 374 (1-2): 611–627. doi: 10.1007/s11104-013-1909-4.
- Blanco-Canqui, H. 2017. “Biochar and Soil Physical Properties.” Soil Science Society of America Journal 81 (4): 687–711. doi: 10.2136/sssaj2017.01.0017.
- Bramwell, S., D. P. Collins, and A. I. Bary. 2020. “Utilizing Buckwheat and Sudangrass Cover Crops as Feedstock in Aerated, Static Compost Piles.” WSU Extension TB71E 1–8.
- Calisti, R., L. Regni, and P. Proietti. 2020. “Compost-Recipe: A New Calculation Model and a Novel Software Tool to Make the Composting Mixture.” Journal of Cleaner Production 270: 122427. doi: 10.1016/j.jclepro.2020.122427.
- Chaher, N. E. H., M. Chakchouk, N. Engler, A. Nassour, M. Nelles, and M. Hamdi. 2020. “Optimization of Food Waste and Biochar in-Vessel co-Composting.” Sustainability 12 (4): 1356. doi: 10.3390/su12041356.
- Czekała, W., K. Malińska, R. Cáceres, D. Janczak, J. Dach, and A. Lewicki. 2016. “Co-Composting of Poultry Manure Mixtures Amended with Biochar – the Effect of Biochar on Temperature and C-CO2 Emission.” Bioresource Technology 200: 921–927. doi: 10.1016/j.biortech.2015.11.019.
- Dahnke, W. C. 1990. “Testing Soils for Available Nitrogen.” In Soil Testing and Plant Analysis, edited by R. L. Westerman, 120–140. Madison, WI: Soil Science Society of America.
- Dougherty, M., ed. 1999. Field Guide to On-Farm Composting. Ithaca, NY: Natural Resource, Agriculture, and Engineering Service.
- Gang, D., D. Collins, T. Jobson, A. Berim, N. Stacey, S. Seefeldt, N. Khosravi, and W. Hoashi-Erhardt. 2019. Integrating Compost and Biochar for Improved Air Quality, Crop Yield, and Soil Health. Pullman, WA: Center for Sustaining Agriculture and Natural Resources, Washington State University
- Gao, M., F. Liang, A. Yu, B. Li, and L. Yang. 2010. “Evaluation of Stability and Maturity during Forced-Aeration Composting of Chicken Manure and Sawdust at Different C/N Ratios.” Chemosphere 78 (5): 614–619. doi: 10.1016/j.chemosphere.2009.10.056.
- Gao, S., K. Hoffman-Krull, A. L. Bidwell, and T. H. DeLuca. 2016. “Locally Produced Wood Biochar Increases Nutrient Retention and Availability in Agricultural Soils of the San Juan Islands, USA.” Agriculture, Ecosystems & Environment 233: 43–54. doi: 10.1016/j.agee.2016.08.028.
- Gavlak, R., D. Horneck, and R. O. Miller. 2005. Soil, Plant, and Water Reference Methods for the Western Region. Fort Collins, Colorado: Colorado State University.
- Hagemann, N., C. I. Kammann, H.-P. Schmidt, A. Kappler, and S. Behrens. 2017. “Nitrate Capture and Slow Release in Biochar Amended Compost and Soil.” PloS One 12 (2): E 0171214. doi: 10.1371/journal.pone.0171214.
- Hagemann, N., E. Subdiaga, S. Orsetti, J. M. de la Rosa, H. Knicker, H.-P. Schmidt, A. Kappler, and S. Behrens. 2018. “Effect of Biochar Amendment on Compost Organic Matter Composition following Aerobic Composting of Manure.” The Science of the Total Environment 613-614: 20–29. doi: 10.1016/j.scitotenv.2017.08.161.
- Hagemann, N., S. Joseph, H.-P. Schmidt, C. I. Kammann, J. Harter, T. Borch, R. B. Young, et al. 2017. “Organic Coating on Biochar Explains Its Nutrient Retention and Stimulation of Soil Fertility.” Nature Communications 8 (1): 1089. doi: 10.1038/s41467-017-01123-0.
- He, Y., T. DeSutter, L. Prunty, D. Hopkins, X. Jia, and D. A. Wysocki. 2012. “Evaluation of 1:5 Soil to Water Extract Electrical Conductivity Methods.” Geoderma 185-186: 12–17. doi: 10.1016/j.geoderma.2012.03.022.
- Hestrin, R., A. Enders, and J. Lehmann. 2020. “Ammonia Volatilization from Composting with Oxidized Biochar.” Journal of Environmental Quality 49 (6): 1690–1702. doi: 10.1002/jeq2.20154.
- Hothorn, T., F. Bretz, and P. Westfall. 2008. “Simultaneous Inference in General Parametric Models.” Biometrical Journal 50 (3): 346–363. doi: 10.1002/bimj.200810425.
- International Organization of Standardization (ISO). 2005. ISO 10390:2005 Soil Quality – Determination of pH. Geneva, Switzerland: International Organization for Standardization.
- Jaafar, N. M., P. L. Clode, and L. K. Abbott. 2015. “Soil Microbial Responses to Biochars Varying in Particle Size, Surface and Pore Properties.” Pedosphere 25 (5): 770–780. doi: 10.1016/S1002-0160(15)30058-8.
- Kammann, C. I., H.-P. Schmidt, N. Messerschmidt, S. Linsel, D. Steffens, C. Müller, H.-W. Koyro, P. Conte, and S. Joseph. 2015. “Plant Growth Improvement Mediated by Nitrate Capture in co-Composted Biochar.” Scientific Reports 5 (1): 11080. doi: 10.1038/srep11080.
- Larkin, R. P., C. W. Honeycutt, T. S. Griffin, O. M. Olanya, J. M. Halloran, and Z. He. 2010. “Effects of Different Potato Cropping System Approaches and Water Management on Soilborne Diseases and Soil Microbial Communities.” Phytopathology 101 (1): 58–67. doi: 10.1094/PHYTO-04-10-0100.
- Lehmann, J. and Joseph, S., eds. 2015. Biochar for Environmental Management: Science, Technology and Implementation. 2nd ed. London: Routledge.
- López-Cano, I., A. Roig, M. L. Cayuela, J. A. Alburquerque, and M. A. Sánchez-Monedero. 2016. “Biochar Improves N Cycling during Composting of Olive Mill Wastes and Sheep Manure.” Waste Management (New York, N.Y.) 49: 553–559. doi: 10.1016/j.wasman.2015.12.031.
- Malinowski, M., K. Wolny-Koładka, and M. D. Vaverková. 2019. “Effect of Biochar Addition on the OFMSW Composting Process under Real Conditions.” Waste Management (New York, N.Y.) 84: 364–372. doi: 10.1016/j.wasman.2018.12.011.
- Mao, H., Z. Lv, H. Sun, R. Li, B. Zhai, Z. Wang, M. K. Awasthi, Q. Wang, and L. Zhou. 2018. “Improvement of Biochar and Bacterial Powder Addition on Gaseous Emission and Bacterial Community in Pig Manure Compost.” Bioresource Technology 258: 195–202. doi: 10.1016/j.biortech.2018.02.082.
- Mason, I. G., and M. W. Milke. 2005. “Physical Modelling of the Composting Environment: A Review. Part 1: Reactor Systems.” Waste Management (New York, N.Y.) 25 (5): 481–500. doi: 10.1016/j.wasman.2005.01.015.
- Matejovic, I. 1997. “Determination of Carbon and Nitrogen in Samples of Various Soils by the Dry Combustion.” Communications in Soil Science and Plant Analysis 28 (17-18): 1499–1511. doi: 10.1080/00103629709369892.
- Mujtaba, G., R. Hayat, Q. Hussain, and M. Ahmed. 2021. “Physio-Chemical Characterization of Biochar, Compost and Co-Composted Biochar Derived from Green Waste.” Sustainability 13 (9): 4628. doi: 10.3390/su13094628.
- Nguyen, M. K., C. Lin, H. G. Hoang, P. Sanderson, B. T. Dang, X. T. Bui, N. S. H. Nguyen, D.-V. N. Vo, and H. T. Tran. 2022. “Evaluate the Role of Biochar during the Organic Waste Composting Process: A Critical Review.” Chemosphere 299: 134488. doi: 10.1016/j.chemosphere.2022.134488.
- O2 Compost. 2021. Composting Micro Bins [online]. Accessed April 8, 2024. https://www.o2compost.com/micro-composting-bins.aspx.
- Paustian, K., J. Lehmann, S. Ogle, D. Reay, G. P. Robertson, and P. Smith. 2016. “Climate-Smart Soils.” Nature 532 (7597): 49–57. doi: 10.1038/nature17174.
- Prost, K., N. Borchard, J. Siemens, T. Kautz, J.-M. Séquaris, A. Möller, and W. Amelung. 2013. “Biochar Affected by Composting with Farmyard Manure.” Journal of Environmental Quality 42 (1): 164–172. doi: 10.2134/jeq2012.0064.
- R Core Team. 2020. “R: A Language and Environment for Statistical Computing.” In R Foundation for Statistical Computing. Vienna, Austria.
- Ravindran, B., D. D. Nguyen, D. K. Chaudhary, S. W. Chang, J. Kim, S. R. Lee, J. Shin, B.-H. Jeon, S. Chung, and J. Lee. 2019. “Influence of Biochar on Physico-Chemical and Microbial Community during Swine Manure Composting Process.” Journal of Environmental Management 232: 592–599. doi: 10.1016/j.jenvman.2018.11.119.
- Ryckeboer, J., J. Mergaert, K. Vaes, S. Klammer, D. De Clercq, J. Coosemans, H. Insam, and J. Swings. 2003. “A Survey of Bacteria and Fungi Occurring during Composting and Self-Heating Processes.” Annals of Microbiology 53 (4): 349–410.
- Sánchez-García, M., J. A. Alburquerque, M. A. Sánchez-Monedero, A. Roig, and M. L. Cayuela. 2015. “Biochar Accelerates Organic Matter Degradation and Enhances N Mineralisation during Composting of Poultry Manure without a Relevant Impact on Gas Emissions.” Bioresource Technology 192: 272–279. doi: 10.1016/j.biortech.2015.05.003.
- Shin, Y., K. Iwabuchi, and T. Itoh. 2024. “Low-Temperature Biochars Are More Effective in Reducing Ammonia Emissions through Various Mechanisms during Manure Composting.” Journal of Material Cycles and Waste Management 26 (1): 138–148. doi: 10.1007/s10163-023-01808-3.
- Sobol, L., and A. Dyjakon, A. 2022. “Biochar as a Sustainable Product for the Removal of Odor Emissions - Mini Literature Review.” Revista de Chimie 73 (4): 86–96. doi: 10.37358/RC.22.4.8557.
- Steiner, C., K. C. Das, N. Melear, and D. Lakly. 2010. “Reducing Nitrogen Loss during Poultry Litter Composting Using Biochar.” Journal of Environmental Quality 39 (4): 1236–1242. doi: 10.2134/jeq2009.0337.
- Suliman, W., F. M. C. Gamarra, and M. Garcia-Perez. 2018. “Composting in the Presence of Biochar and Impact of the Resulting Product as a Soil Amendment: A Review.” In Advancing Organics Management in Washington State: The Waste to Fuels Technology Partnership 2015-2017 Biennium. Pullman, WA: WSU.
- Suliman, W., J. B. Harsh, N. I. Abu-Lail, A.-M. Fortuna, I. Dallmeyer, and M. Garcia-Perez. 2016. “Influence of Feedstock Source and Pyrolysis Temperature on Biochar Bulk and Surface Properties.” Biomass and Bioenergy 84: 37–48. doi: 10.1016/j.biombioe.2015.11.010.
- Thompson, W., P. Leege, P. Millner, and M. E. Watson. 2003a. “TMECC 05.05-a Percent Emergence, Relative Seedling Vigor.” In: Test Methods for the Examination of Compost and Composting. US Composting Council, US Government Printing Office.
- Thompson, W., P. Leege, P. Millner, and M. E. Watson. 2003b. “TMECC 03.03 Bulk Density.” In: Test Methods for the Examination of Compost and Composting. US Composting Council, US Government Printing Office.
- Thompson, W., P. Leege, P. Millner, and M. E. Watson. 2003c. “TMECC 03.09 Total Solids and Moisture.” In: Test Methods for the Examination of Compost and Composting. US Composting Council, US Government Printing Office.
- Thompson, W., P. Leege, P. Millner, and M. E. Watson. 2003d. “TMECC 04.02-B Nitrate-N.” In: Test Methods for the Examination of Compost and Composting US Composting Council, US Government Printing Office.
- Thompson, W., P. Leege, P. Millner, and M. E. Watson. 2003e. “TMECC 04.02-C Ammonium-N.” In: Test Methods for the Examination of Compost and Composting US Composting Council, US Government Printing Office.
- Thompson, W., P. Leege, P. Millner, and M. E. Watson. 2003f. “TMECC 04.02-D Combustion.” In: Test Methods for the Examination of Compost and Composting. US Composting Council, US Government Printing Office.
- Thompson, W., P. Leege, P. Millner, and M. E. Watson. 2003g. “TMECC 04.10-a Soluble Salts.” In: Test Methods for the Examination of Compost and Composting. US Composting Council, US Government Printing Office.
- Thompson, W., P. Leege, P. Millner, and M. E. Watson. 2003h. “TMECC 04.11-a pH.” In: Test Methods for the Examination of Compost and Composting. US Composting Council, US Government Printing Office.
- Vieira Firmino, M., A. Trémier, A. Couvert, and A. Szymczyk. 2024. “New Insights into Biochar Ammoniacal Nitrogen Adsorption and Its Correlation to Aerobic Degradation Ammonia Emissions.” Waste Management (New York, N.Y.) 178: 257–266. doi: 10.1016/j.wasman.2024.02.032.
- Wang, C., H. Lu, D. Dong, H. Deng, P. J. Strong, H. Wang, and W. Wu. 2013. “Insight into the Effects of Biochar on Manure Composting: evidence Supporting the Relationship between N2O Emission and Denitrifying Community.” Environmental Science & Technology 47 (13): 7341–7349. doi: 10.1021/es305293h.
- Waqas, M., A. S. Nizami, A. S. Aburiazaiza, M. A. Barakat, I. M. I. Ismail, and M. I. Rashid. 2018. “Optimization of Food Waste Compost with the Use of Biochar.” Journal of Environmental Management 216: 70–81. doi: 10.1016/j.jenvman.2017.06.015.
- Wei, L., W. Shutao, Z. Jin, and X. Tong. 2014. “Biochar Influences the Microbial Community Structure during Tomato Stalk Composting with Chicken Manure.” Bioresource Technology 154: 148–154. doi: 10.1016/j.biortech.2013.12.022.
- Wilson, C., B. J. Zebarth, D. L. Burton, and C. Goyer. 2018. “Short-Term Effects of Diverse Compost Products on Soil Quality in Potato Production.” Soil Science Society of America Journal 82 (4): 889–900. doi: 10.2136/sssaj2017.10.0345.
- Wilson, C., B. J. Zebarth, D. L. Burton, C. Goyer, G. Moreau, and T. Dixon. 2019. “Effect of Diverse Compost Products on Potato Yield and Nutrient Availability.” American Journal of Potato Research 96 (3): 272–284. doi: 10.1007/s12230-019-09714-x.
- Woolf, D., J. E. Amonette, F. A. Street-Perrott, J. Lehmann, and S. Joseph. 2010. “Sustainable Biochar to Mitigate Global Climate Change.” Nature Communications 1 (1): 56. doi: 10.1038/ncomms1053.
- Zhou, S., F. Kong, L. Lu, P. Wang, and Z. Jiang. 2022. “Biochar—an Effective Additive for Improving Quality and Reducing Ecological Risk of Compost: A Global Meta-Analysis.” Science of the Total Environment 806: 151439. doi: 10.1016/j.scitotenv.2021.151439.
- Zhou, S., Z. Jiang, J. Shen, Q. Yao, X. Yang, X. Li, M. K. Awasthi, and Z. Zhang. 2023. “Biochar-Amended Compost as a Promising Soil Amendment for Enhancing Plant Productivity: A Meta-Analysis Study.” The Science of the Total Environment 879: 163067. doi: 10.1016/j.scitotenv.2023.163067.