
Abstract
Mulching leaves in place was studied for 4 years in Westchester County, New York State, USA. Soil testing showed an advantage in long-term mulch mowing for available water capacity and soil proteins with no detrimental effects on the health of the soil. There were no differences in the concentration of macro or micronutrients in the leaf and duff material between treatments or in the concentration of those nutrients being added or removed from the soil. Lawns that had been mulch mowed showed significantly higher pest and traffic tolerance than those where leaves had been removed. Drought stress tolerance remained the same on sites where mulch mowing had occurred, but decreased where leaves had been removed. Mowing practices accounted for less than one percent of the variation in tick numbers, indicating that other variables, not measured had a larger impact. The amount of fuel used for community pick-up of leaves was 4 and 33 times as much as mulch mowing for the two treatment groups. Based on the results of this 3-year study, mulch mowing of leaves provides some soil health benefits, many turf quality benefits, does not improve the habitat for pests and uses less fuel than community pick-up. This study showed that mulch mowing of leaves (i.e., leaving leaves on the lawn) does provide some benefits to soil health and turf quality, without having an adverse effect on nutrient load or tick habitat.
Introduction
In Northeast USA, including New York State (NYS), municipalities banned leaves from being placed in landfills. Instead, they collect leaves and compost them locally or ship them long distances. Autumn leaf management is a challenge for communities, especially in densely populated areas with high tree densities. Roadside leaf piles clog storm drains, cause flooding and pose other hazards. Leaf pick-up and transport is costly and increases fuel use and emissions. Mulching leaves vs. hauling and managing could have far reaching policy implications. Mulching is a technique that involves mowing over the leaves on the lawn and mincing them to fine particles that then decompose on your lawn and return nutrients and organic matter to the soil. Advocates claim that this practice provides benefits to turf and soil but, thus far, claimed benefits are based on anecdotal information only. Mulch mowing leaves requires one to pay close attention to size and quantity of leaves left on turf as leaf litter build-up on the lawn can be harmful, killing the underlying turf or providing a suitable habitat for insect pests to proliferate. Gaining a better understanding of how leaf mulching will affect soil and turf quality and insect populations will allow homeowners and landscapers to make better leaf management decisions. Mulching leaves in place may help to decrease community labor and collection costs, lower carbon footprint with decreased fuel use, improve soil health and water infiltration, decrease runoff, and reduce irrigation needs, increasing community sustainability. The intent of this project is to assess the potential effects of this practice on soil and turf quality, soil nutrient supply for spring regrowth, monitor effects on tick populations and quantify the change in carbon footprint, while educating the public about the importance of healthy soils and climate change mitigation.
According to the New York State Department of Environmental Conservation (NYS Department of Environmental Conservation Citation2010) an estimated 920,000 tons of yard waste is collected yearly in NYS. This represents approximately 5% of total municipal solid waste (MSW) generated in the state. However, in suburban areas, yard waste is estimated to comprise over 10% of MSW generation, versus 2 and 3% in rural and urban areas, respectively. In the early 1990s, many states banned yard waste from being disposed in landfills requiring municipalities to handle leaf and yard waste separately. As autumn leaves were being collected or dropped off at facilities, the question of what to do with them began to be researched. Some were composted or burned, and others were applied to agricultural land. For land application there was concern that the addition of too much carbon (C) from the brown leaves could tie up nitrogen (N) in the soil making it unavailable to the grass. Rieke et al. (Citation1993) reported on the first 2 years-worth of data from a long-term (6 year) project mulching oak and maple leaves into Kentucky bluegrass turf at the rate of 100 lbs. of dry leaves per 1000 square feet (approximately ankle height in depth). They stated that from the data available it appears that returning leaves to the turf is not harmful to the grass if the leaf mulching is done regularly. After 6 years, Nikolai, Rieke, and McVay (Citation1998) reported that plots where leaves were mulched in yielded significantly higher turf quality ratings versus control plots. In addition, during the last year of the study, plots mulched with maple leaves had significantly fewer dandelions and broadleaf weeds than control plots. There were no changes in soil pH over the 6 seasons of mulching tree leaves and no changes regarding soil phosphorus (P) or potassium (K).
Nikolai et al. (Citation2000) reported additional information garnered from the 6-year study from soil core samples taken in 1998. These samples showed an increase in soil organic matter in plots that had oak and maple leaves mulched into them compared to the control plots. In addition, tissue analysis of clippings collected in October 1998 showed that grass plants coming from plots with leaves mulched into them had a greater percentage of C and N, but that the C:N ratio was not affected indicating that nitrogen would still be available for turfgrass. These same researchers (Nikolai et al. Citation2000) initiated another study in 1995 to determine if low maintenance turfgrass sites could take heavy loads of deciduous leaves and still maintain their usefulness. Plots received excessive dry leaf rates of 0, 150, 300 and 450 pounds per 1000 square feet mulched with no fertilizer application. Soil C and N increased with increasing leaf litter, but C:N ratio and soil pH were not affected. In addition, control plots measured higher in surface hardness than those receiving leaf mulch treatments indicating mulching provides a cushion for persons engaging in physical activity. Reicher and Hardebeck (Citation2000) also looked at heavy applications (2000 and 4000 pounds per acre in a single application) of mulching maple leaves into low maintenance turf over 5 years and found no effect on turf visual quality, no effect on turf growth, no increase in diseases or weed infestation and no effect on nutrient availability or soil pH. They observed an increase in microbial activity in mulched plots which indicates improved soil quality. Rutgers Cooperative Extension (Citation2000) summarized leaf mulching on agricultural fields between 1989 and 2000 through surveys. They found that soil organic matter increased between 0.5 and 0.7% with annual applications over 3 years, soil erosion was reduced, and the leaves provided fertilizer nutrients. Anecdotally, farmers relayed that field mulching of leaves improved soil moisture holding capacity as well as improving soil tilth and structure.
Acosta-Martinez et al. (Citation1999) assessed soil quality after leaf mulch additions on established perennial ryegrass plots amended annually with maple leaves at three different rates. They found no significant effect on water infiltration or bulk density, but trends in the data suggest there would be increased infiltration with increasing leaf application rates. They also suggested that multiple years of leaf mulching or the incorporation of large amounts of leaves should decrease soil bulk density. There were no negative effects of leaf mulching into turfgrass and early data suggest this practice will improve soil chemical, physical, and biological structure. Nektarios, Petrovic, and Sender (Citation1999) came to the same conclusion indicating that using mulching mowers to finely grind and deposit fallen tree leaves on turf provides for an alternative tree leaf disposal method while not affecting the health and vigor of lawn turf. They found no effect on visual quality, shoot growth, thatch accumulations, soil organic matter or soil pH over the 3 years of the study.
Little to no research on tree leaf mulching was conducted in the following 10 years as leaf collection in suburban areas was routinely practiced, and burning of leaf and yard waste was legal in smaller communities. The only new research was conducted by Kowalewski et al. (Citation2009) to quantify the effectiveness of maple or oak leaf mulches as an organic dandelion control method. Results of this study indicated that mulching leaves into established turfgrass as a leaf litter disposal method will increase spring green-up and contribute to a reduction in the common dandelion population. However, since that time, the cost of collection (labor, maintenance, fuel costs, storm drain cleanouts and tipping fees) has risen and many municipalities are discontinuing autumn leaf collection. Encouraging homeowners to mulch mow their leaves into their lawns has become more popular especially in densely populated areas with high tree density. With this push to “leave them on the lawn,” questions have been raised about the effect this practice may have on tick habitats. Specifically, will the practice increase the risk of vector-borne disease such as Lyme disease?
The life cycle of Ixodes scapularis (black-legged tick) that carries the spirochete responsible for Lyme disease is a 2-year cycle (Ward and Brown Citation2004). Larvae hatch from July to early August and seek their host. Larvae do not generally carry the spirochete. They feed on small mammals then drop to the ground and molt, emerging as nymphs the following spring. Nymphs seek hosts in late spring and early summer on small mammals, then drop to the ground and molt into adults. Adult ticks seek hosts from mid-October to mid-November and spring of the following year. They feed on medium to large-size mammals, primarily white-tailed deer. Humans are most likely to be infected by the nymph state because the nymphs are most numerous when humans are outside (late May through early summer). Nymphs are generally found in leaf litter and ground level vegetation in the woods. They are generally not found in residential lawns, but the presence of adjacent woods can be a problem as leaf litter provides the humidity and small mammal hosts needed for survival. Carroll et al. (Citation1992) reported the relative abundance of ticks in lawns adjacent to woods was about five times greater than in lawns adjacent to other lawns, and the relative abundance of nymphs collected in lawns at different distances from the wood edge declined consistently with increased distance from the woods. In a study by Maupin et al. (Citation1991), the landscape ecology of Lyme disease was looked at on 67 residences in Westchester County, NYS. Nymphs and adults were widely dispersed in four main habitats (woods, ecotone – the unmaintained edge between woods and lawn, ornamental vegetation, and lawns). This study showed a significant difference in nymph and tick distribution based on habitat and property size, with woods containing the most and lawns containing the least and larger properties containing more than smaller ones. The authors say that the results of this study suggest several measures that may help reduce the risk of exposure to Lyme disease vectors in residential environments. One of these includes the removal of leaf litter from the unmaintained edge and a reasonable distance into woodlots rendering a less favorable habitat. They also suggest mowing of vegetation during spring and summer in ecotone and woodlots. Both could be realized through mulch mowing of leaves. Raking and bagging leaves exposes residents to tick populations, and the bags still need to be brought to a transfer site or composting facility. Intentionally mowing as close as practical to the woods will reduce tall herbaceous vegetation and prevent woody vegetation from establishing, thus reducing tick habitat. Mulch mowing, when done with appropriate equipment, results in a finely shredded dry leaf mulch that does not have the same characteristics as leaf litter. Changing the habitat for the black-legged tick could result in a reduction of tick populations. This study was conducted to see if mulching leaves in place provided benefits to turf and soil without adding excess nutrients to the soil, smothering the underlying turf, or providing a suitable habitat for insect pests to proliferate.
Materials and Methods
Sites
In February 2015, a steering committee consisting of Westchester County, NYS, USA landscapers, master composters and recyclers, Cornell Cooperative Extension personnel, County, Town, and Village representatives, NYSDEC representatives and local Nature Center and grassroots organizations was convened to identify sites for the study. Each of these groups agreed to send out a letter to or speak with their clients about participating in this study. Specifically, homeowners were asked if they, or their landscaper practiced mulch mowing on their lawn. If so, for how many years have they employed the practice. Or are leaves removed completely from their lawns? The prospective site owners were given a list of what would take place on their properties by the study team. This included pictures of the site; soil samples twice a year; monthly turf quality assessment; leaf and duff samples; sweeping for tick nymphs mid-May through June and adults from mid-October through late November, early December. The homeowners were also asked to keep accurate records of their regular lawn maintenance for the 3-year study.
From the responses received, 12 sites were picked to participate (). Four sites were picked where leaves had been completely removed every year and no mulch mowing was ever practiced. Four sites were picked where mulch mowing had been practiced for 1–3 years and four sites were picked where mulch mowing had been practiced for more than 4 years. These four sites had been mulch mowing for 7, 10, 15 and 18 years. In addition, at two of the sites where mulch mowing had been practiced for 1–3 years, an additional parcel was added to the study making 14 sites. At the first site, the landscaper asked us to include the front lawn as well as the one we had already sampled due to the extent of mulch mowing on that parcel and at the other site, there was a piece that had never been mulch mowed, allowing us to make a comparison on the same property between total leaf removal and mulch mowing for 1–3 years.
Table 1. Sites, number of years of mulch mowing at start of study, property size in the study.
Soil Health Indicators
Soil samples were taken from each property twice a year, once in the spring and once in autumn, over a 4-year period and sent to Cornell University’s Soil Health Laboratory for analysis. Samples were taken using the soil health laboratory’s protocol for sampling by scraping off surface debris and then digging with a trowel down six inches and depositing one cup of soil in a bucket. This was done in five spots at each site in a “W” pattern across the portion of the property being used. The soil in the bucket was mixed thoroughly and a subsample was taken to the laboratory for their standard soil health analysis package. This package includes soil texture (% sand, silt, and clay) and:
Soil physical properties – available water capacity; aggregate stability
Soil biological properties – organic matter; soil protein index; respiration; active carbon
Soil chemical properties – soil pH; phosphorus, potassium, micronutrients
Results from the Cornell Soil Health Laboratory offer a value (measurement) for each parameter above as well as a rating that interprets the measured value on a scale of 0–100. A rating of 30 or less indicates a constraint of the soil; between 30 and 70 indicates suboptimal functioning and greater than 70 indicates optimal or near optimal functioning. The indicators measured in the Cornell Soil Health Assessment are important soil properties and characteristics in themselves, but also are representative of key soil processes, necessary for the proper functioning of the soil.
Soil Nutrient Supply
Leaf and duff samples were taken from the lawns at all sites five times over the course of the study, three times in 2015 and twice in 2016. Samples were taken to the Cornell Nutrient Analysis Laboratory to be analyzed for aluminum (Al), boron (B), calcium (Ca), copper (Cu), iron (Fe), potassium (K), magnesium (Mg), manganese (Mn), molybdenum (Mo), sodium (Na), phosphorus (P), zinc (Zn), total nitrogen (N) and total carbon (C).
Turf Quality
Overall turf quality (TQ) is a measure of esthetics (i.e., density, uniformity, texture, smoothness, growth habit and color), and functional use (Morris and Sherman Citation2015). The most common way of assessing turf quality is a visual rating system that is based on the turf evaluator’s judgment. Quality is based on 9 being best and 1 being poorest. A rating of 6 or above is generally considered acceptable. Turf quality assessments were done by the same person monthly from April through December in 2015 and 2016, from May through November in 2017.
Tick Populations
Sweeping is an efficient method for sampling ticks, providing that sampling is conducted by one individual throughout the study to prevent sampler bias. Dowels were attached to a 3′ × 3′ white flannel cloth and dragged along the perimeter and diagonally to cross the center within each plot. For narrow plots where diagonal dragging would overlap with the perimeter, the perimeter alone was dragged. The cloth was examined for attached ticks at the end of 30 s of sweeping and captured ticks were placed in alcohol filled vials.
In 2015, each site was dragged for ticks one time per week for 7 wk beginning at the end of May, once each in July and August, and 7 wk in autumn starting in October for a total of 16 assessments. In 2016, each site was dragged for ticks one time per week for 5 wk beginning at the end of May and for 8 wk in autumn, starting in October for a total of 13 assessments. In 2017, because very few ticks were found on the lawns and research from Carroll et al. (Citation1992) indicated that the relative abundance of ticks in lawns adjacent to woods was about five times greater than in lawns adjacent to other lawns, the outlying perimeter of each site was also swept. Sweeping began at the end of April and continued once or twice weekly for 5 wk, once in July and August, and 9 wk in autumn, starting in October for a total of 16–20 assessments depending on weather and tick pressure. In 2018, each site was dragged (both lawn and perimeter) for ticks weekly from May 14 through July 9, once in August, then weekly again from September 11 through November 27 for a total of 20 assessments. One of the “0 year” sites was sold in August and was not swept from September through November. For all 4 years, at the time of sweeping, the individual conducting the sweep recorded the time and temperature. All ticks collected were identified to species, sex, and life stage under a microscope.
Site Records
Site owners were asked to record all site maintenance events over the course of the study. They received a form that included the date, mowing height, amount and type of fuel used and a column for mower maintenance. In addition, they were asked to make an estimate of the volume of leaves on each of these dates, such as, a “one-half inch thick layer over the entire site being studied or a percentage of the site being studied,” or “three 30-gallon garbage bags,” or “no leaves,” etc. In the column titled “disposition of leaves, they were asked to either put in “raked or blown off lawn,” or mulch mowed. If only a portion of the leaves were mulch mowed, or the technique reported when the site owners signed up for the study changed, they were asked to record that. For fertilizer application and pesticide use, they were asked to indicate what and how much was used. Finally they were asked to indicate if they irrigated and, if possible, record how much water was used, or at what rate and for how long. Site records were collected in 2015, 16 and 17. In addition, 2 cities, 4 towns and 2 villages in the area were contacted and asked to give information regarding the fuel used to pick up leaves in their town or village, as well as the square footage of the area in which they picked up leaves.
Statistical Analysis
Standard Least Squares, comparison of means with Tukey-Kramer HSD, Mixed Model Repeated Measures and Linear Regression using JMP Pro.
Results and Discussion
Soil Health Indicators
Physical Properties
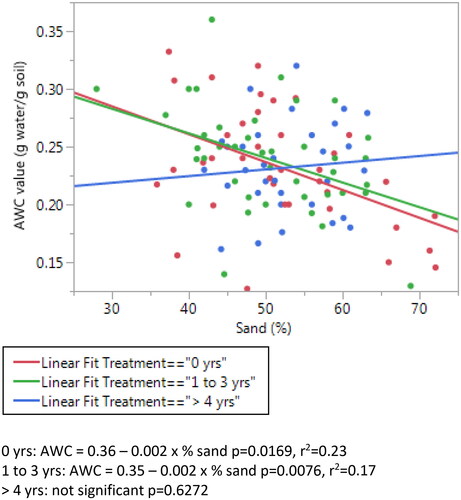
Available water capacity (AWC) is the measure of the porosity of the soil in grams of water per gram of soil. This value is scored against an observed distribution in regional soils with similar texture to obtain the rating. AWC is an indicator of the amount of plant available water the soil can store, and therefore how crops will fare in drought conditions. Coarse textured (sandy) soils inherently store less water than finer textured soils (Moebius-Clune et al. Citation2017). Sandy soils can be managed to hold more water by adding large amounts of organic matter to the soil. Mean AWC for 0 years, 1–3 years and >4 years was 0.23, 0.24 and 0.23 g water/g soil respectively. Mean rating of 85, 88 and 87 indicated optimal functioning for all three.
There was no significant difference in AWC value or rating by treatment over time or overall. However, the AWC value decreased significantly when the % sand was greater in the samples from lawns that have never practiced mulch mowing (0 years) and those that had practiced it for 1–3 years, while the AWC value did not differ when the % sand increased in the samples from lawns that had practiced mulch mowing for greater than 4 years (). R-square values indicate that the decrease in AWC was due 23% and 17% to mulch mowing practices. Percent sand in the soil of lawns that had never been mulch mowed ranged from 35.9% to 72.0% with a mean of 52.5% from 39 samples. As the percent sand in the soil increased the AWC decreased significantly. The same was true for lawns that had been mulch mowed for 1–3 years (mean of 50.3% sand with a range of 28.0%–68.9%). Although the mean % sand of 52.8 with a range of 42.0%–63.2% in lawns where mulch mowing had been practiced greater than 4 years was the same as those of the other two treatments, the AWC remained the same even when the percent sand increased, indicating that over the decades of mulch mowing leaves, the soil had been supplied with enough additional organic matter to allow the coarser textured soil to hold water.
Figure 1. Linear regression of AWC value (g water/g soil) by sand (%) for each treatment.
Aggregate stability is a measure of how well soil aggregates or crumbs hold together under rainfall or other rapid wetting stresses. The value is presented as a percent and is scored against a distribution observed in regional soils with similar textural characteristics. Good aggregate stability helps prevent crusting, runoff, and erosion, and facilitates aeration, infiltration, and water storage, along with improving seed germination and root and microbial health. Aggregate stability values of 20% are considered low, while those at 70% or higher are considered high. All treatments showed aggregate stability values in the range of 54%–68% and there were no significant differences in values or rating between treatment groups.
Biological Properties
Organic matter (OM) is a measure of the carbonaceous material in the soil that is biomass or biomass derived. This is scored against an observed distribution of OM in regional soils with similar texture. OM content is an important influence on soil aggregate stabilization, water retention, nutrient cycling, and ion exchange capacity. OM acts as a long-term slow-release pool for nutrients. Soils with low OM tend to require higher inputs and be less resilient to drought and extreme rainfall. OM is directly derived from the biomass of microbial communities in the soil (bacterial, fungal, and protozoan), as well as from plant roots and detritus, and biomass-containing amendments like manure, green manures, mulches, composts, and crop residues. Although one would expect soil on lawns that had been mulch mowed versus those where leaves had been removed to have higher OM, there was no significant difference in soil OM between treatment groups. For best turf, soil OM should be 7% or greater (Bonhotal et al. Citation2007). Mean organic matter was low for all treatment groups ranging between 4.1% and 6.6% but did increase significantly over time.
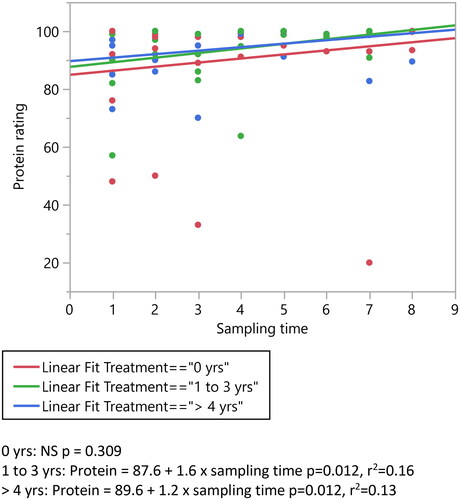
Soil proteins are the fraction of the soil organic matter that are present as proteins or protein-like substances. This represents the large pool of organically bound N in the SOM, which microbial activity can mineralize, and make available for plant uptake. There was no significant difference between treatment groups in soil proteins or the soil protein rating. However, soil protein rating increased significantly over time in soil where mulch mowing had been practiced for 1–3 years and for > 4 years but did not change in soils where mulch mowing had never occurred (). Although soil proteins increased over time in mulch mowed lawns, the r-square values show that this increase was due only 16% and 13% to mulch mowing. Other factors not analyzed such as the addition of compost or green manures, were also responsible for the increase in soil proteins.
Figure 2. Linear regression of soil protein rating over time.
Soil respiration is a measure of the metabolic activity of the soil microbial community. It is a direct biological activity measurement and an indicator of the biological status of the soil community. Soil biological activity accomplishes numerous important functions, such as cycling of nutrients into and out of soil OM pools, transformations of N between its several forms, and decomposition of incorporated residues. Mean soil respiration rating (how well the soil is functioning as described previously) for all three treatment groups ranged between 70 and 99 indicating optimal functioning and there was no significant difference in soil respiration between treatments.
Active carbon is a measure of the small portion of the OM that can serve as an easily available food source for soil microbes, thus helping maintain a healthy soil food web. Active carbon is a good leading indicator of biological soil health and tends to respond to changes in management earlier than total OM content; when a large population of soil microbes is fed plentifully with enough OM over an extended period of time, well-decomposed OM builds up. Mean active carbon rating for 0 years, 1–3 years and >4 years ranged from 66 to 95, 63 to 92 and 74 to 99, respectively indicating optimal functioning. As with OM, there was no significant difference between treatment groups in active carbon values or rating.
Chemical Properties
The chemical properties analyzed by the Cornell Soil health lab include soil pH, extractable phosphorus (P) and potassium (K) and the minor elements magnesium (Mg), iron (Fe), manganese (Mn) and zinc (Zn). Soil pH is a measure of how acidic the soil is, which controls how available nutrients are to crops. The optimum pH is around 6.2–6.8 for most crops. Extractable P and K are measures of P and K availability to a crop. Their values are presented in parts per million (ppm) and the rating is scored against an optimality curve for sufficiency or excess. Concentration values for P between 3.5 and 21.5 ppm and values greater than or equal to 74.5 ppm for K are given a maximum rating of 100 but are not crop specific. Plant availability of P is dependent on pH and mineral composition. Soil pH only marginally affects K availability, but it is easily leached from sandy soils and is only weakly held by increased OM.
Magnesium in the soil promotes winter hardiness and early growth. It is essential for nitrogen metabolism and chlorophyll synthesis and helps the turf to utilize iron and phosphate. Magnesium concentrations of less than 33 are considered low while those at 33 or above are optimal. Both Mn and Fe are micronutrients whose availability can be affected by pH. In both cases, the higher the pH, the less available are Mn and Fe. Iron is essential for chlorophyll synthesis and can thus help with turf grass color. Acceptable iron levels are approximately 2.5–5.0 ppm. Manganese plays a role in photosynthesis and helps to suppress both leaf and root diseases. When the pH is below 7.0, adequate levels of Mn are in the range of 4.6–12 ppm, while levels of 12–20 are considered high and above 20 very high. At pH 7.0 and above, 5.1–15 mg/kg is adequate, 15–50 high and above 50 very high. Zinc is a plant essential nutrient, necessary for plant growth. It is utilized in the following processes: activation of enzymes, chlorophyll formation, growth hormone regulation, cell growth and seed formation. The critical level for Zn is approximately 1.5–2.5 ppm. A value less than 1.5 would be considered deficient. Zn deficient soils will cause root growth to be depressed.
shows the mean for each of the chemical properties analyzed in the soil by treatment. The pH of the soil at all study sites was acidic with a mean range of 5.5–5.7. This pH is considered low and can have an effect on nutrient availability. Although the pH was low, P, K, Mg and Fe were all within adequate range regardless of treatment. Manganese concentration was slightly high. There were no treatment differences for pH, P, Mg or Mn. For those values that were significantly different, none of the treatments as a group showed a concentration of any of them below or above the critical level. In addition, the r-squares for these analyses were all less than 0.05 indicating that mulch mowing accounted for less than 5% of the difference in concentration.
Table 2. Mean pH and mean concentration of P, K, Mg, Fe, Mn and Zn in the soil by treatment.
Overall Quality Score
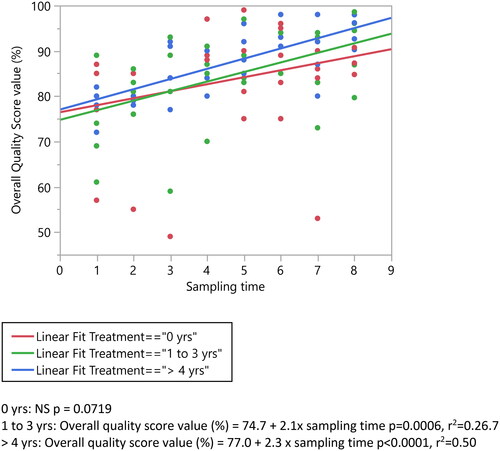
Overall quality score (OQS) is computed from the individual indicator scores. This score is further rated as follows: less than 20% is regarded as very low, 20%–40% is low, 40%–60% is medium, 60%–80% is excellent, and greater than 80% is optimal. The highest possible quality score is 100 and the least score is 0, thus it is a relative overall soil health status indicator. The overall soil quality score should be taken as a general summary rather than the main focus. OQS ranged from 75 (excellent) to 94 (optimal) for all treatments over the course of the study. Although all treatments increased in OQS over time, 1–3 years and > 4 years increased significantly while 0 years did not, with 27% and 50%, respectively of the variation due to treatment according to the r-square values ().
Figure 3. Linear regression of overall quality score value (%) over time.
Nutrient Supply
Carbon and Nitrogen
Advocates of mulch mowing say that the addition of organic matter and nutrients in the leaves will improve the soil, while opponents are concerned that the change in nutrient supply may be harmful. shows the concentration of % total N and total C in the leaf and duff material on the lawns of the study sites by treatment at each sampling date. For sites that filled out records indicating the volume of leaves on the lawn, the quantity of N and C in the leaf and duff material that was mulched into or removed from the lawn is shown. There was a significant difference in % total N, but not total C, by site. Nitrogen in the soil is necessary for the formation of amino acids, the building blocks for protein (Moebius-Clune et al. Citation2017). Although the amount of N supplied by the leaves was different, linear regression of soil proteins versus N supplied showed no significant difference between treatments. In addition, there was no difference in the % N or C in the leaf and duff material between treatments over the course of the study.
Table 3. Mean total N and total C in leaf and duff material by treatment and site.
It has been reported that heavy application of leaves mulched into lawns over a 3-year period increased organic matter in the soil (Reicher and Hardebeck, Citation2000). Linear regression on the amount of C supplied or removed by the leaf litter showed no effect on the amount of organic matter in the soil however, the total amount of leaves mulched in (where reported) was light. Because OM increased over time for all treatments, it can be deduced that mulch mowing of leaves did not have a negative effect on soil organic matter.
Macronutrients
The macronutrients P, K, Ca, and Mg are essential to the soil as well as to maintaining a healthy lawn. These macronutrients are important in the soil for respiration, protein synthesis and water-use efficiency (Moebius-Clune et al. Citation2017). shows the concentration of these nutrients (ppm) in the leaf and duff material on the lawns of the study sites by treatment at each sampling date. For sites that filled out records indicating the volume of leaves on the lawn, the quantity of P, K, Ca and Mg in the leaf and duff material that was mulched into or removed from the lawn is shown (the table omits the volume of leaves and area of the property as it is the same as in above). The concentration of each macronutrient in leaf and duff material was not different between treatments. Phosphorus and Mg in the leaf and duff material were significantly different between sites. Linear regression of the concentration of each of these nutrients in the soil against the concentration in the leaf and duff material showed no significant difference between treatments for any of the nutrients. Linear regression of the soil respiration, soil protein and AWC against the concentration of each macronutrient in the leaf and duff material also showed no significant difference between treatments. Again, mulch mowing of leaves had no negative effect on the concentration of macronutrients added to the soil.
Table 4. Mean P, K, Ca and Mg in leaf and duff material by treatment and site.
Micronutrients
According to Moebius-Clune et al. (Citation2017), the micronutrients B, Cu, Fe, Mn, Mo, and Zn are plant food elements that are used in very small amounts. Boron helps plants grow new tissue, Cu, Fe, Mn, and Zn are important for chlorophyll production and thus make for healthy, dark green growth. Molybdenum is needed to produce essential proteins. There was no difference between sites or treatments in B, Cu or Fe concentration in the leaf and duff material collected on lawns. The concentration of Mn was significantly different between treatments and the concentration of Mn, Mo and Zn were significantly different between sites (). Mean Mn concentration was significantly higher for leaves from lawns that were mulch mowed for 1–3 years (498 ppm) versus those that were mulch mowed greater than 4 years (247 ppm) and those that had never been mulch mowed (309 ppm). However, linear regression of the quantity of micronutrients available in the leaf and duff by treatment against those same micronutrients in the soil was not significant, showing no negative effects of mulch mowing leaves to the micronutrient concentration of the soil.
Table 5. Mean Mn, Mo and Zn in leaf and duff material by treatment and site.
Turf Quality
Turf quality observations included pest and traffic tolerance, color, and color retention, percent living ground cover, spring green-up in April and May, and drought stress. Quality ratings are based on 9 being best and 1 being poorest. A rating of 6 or above is generally considered acceptable. Only tolerance to pests and traffic showed any significant differences due to mowing practices.
Tolerance to Pests and Traffic
A rating of 1 indicates 100% injury, while a rating of 9 indicates no injury. Mean monthly pest tolerance ratings over the course of the study ranged from 7.2 to 9.0 for “0 years,” 8.2 to 9.0 for “1–3 years” and 8.3 to 9.0 for “> 4 years” of mulch mowing. Repeated measures analysis of tolerance to pests by treatment, month/year of observation and the two variables crossed showed a significant difference for all variables (p<.0001), r2 = 0.10. Lawns that had been mulch mowed regardless of number of years showed significantly higher pest tolerance (mean of 8.8) as compared to lawns where mulch mowing had never been practiced (mean of 8.6). Tolerance to traffic showed a significant difference as well. Lawns were given a value based on the amount of traffic they received: little to none = 1; low = 2; moderate = 3 and heavy = 4. A TQ rating of 1 for traffic tolerance indicates no tolerance while a 9 indicates no injury from traffic. Lawns where mulch mowing had never been practiced, where traffic averaged little to none, was significantly higher (mean of 8.7) than on lawns that had been mulch mowed for 1–3 years where mean traffic was low (2) and mean traffic tolerance was 8.5. However, where mulch mowing had occurred for > 4 years and mean traffic was a 2.5 (2 sites had low traffic and 2 sites had heavy traffic), tolerance to traffic was rated at a mean of 8.6 which was not significantly different from either “0 years” or “1–3 years.” This indicates that continuous years of mulch mowing can help keep lawns with heavier traffic tolerant to it. However, for both qualities, the r-square was only 0.10, indicating that only 10% of the difference could be attributed to mowing practices.
Color, Color Retention and Percent Living Ground Cover
Color and color retention are rated as 1 for straw brown and 9 for dark green. Percent living ground cover is rated as the percentage of the lawn that is alive at the time of the observation. The mean monthly values for each of the treatments over the 4 years are shown in . Overall mean color, color retention and percent living ground cover were not significantly different between treatments, however, lawns that had been mulch mowed for > 4 years showed an increase in all three ratings over time while the other two treatments remained the same.
Table 6. Mean color, color retention and % living ground cover by month over 4 years (1 = straw brown; 9 = dark green).
Spring Green-Up and Drought Stress
Spring green-up is a measure of how quickly the grass greens-up in the spring and is rated only in April and/or May, depending on snow cover. A rating of 1 is given for straw brown and 9 for dark green (). Repeated measures analysis shows significant difference based on month of rating, with no treatment effect. Drought stress tolerance is rated a 1 for wilting and a 9 for no wilting. There was no significant difference between treatments on overall drought stress tolerance or from month to month, however, repeated measures analysis showed that lawns that had never been mulch mowed decreased in drought stress tolerance over time (r-square of 0.03) while those that had been mulch mowed remained the same ().
Table 7. Mean spring green-up rating by treatment and month/year (1 = straw brown; 9 = dark green).
Table 8. Mean drought stress tolerance by month over 4 years (1 = wilting; 9 = no wilting).
Tick Pressure
The total number of ticks swept from each site (lawn) and in the surrounding perimeter (2017 and 2018 only) by year, treatment and site can be found in . Over the 4-year period, a total of 71 ticks were swept from the lawns and 86 ticks were swept from the perimeter. Statistical analysis of a number of ticks collected was done by treatment, season, time of day and temperature range when the sweep was performed. Seasons were spring, summer and autumn based on the equinox: March 20 through June 20, June 21 through September 21, September 22 through December 20, respectively. Time of day was broken into early morning (5 am–9:59 am), late morning (10 am–11:59 am), early afternoon (12 pm–2:29 pm), late afternoon (2:30 pm–4:59 pm) and evening (5 pm–9 pm). The temperature range was cold (33–60 F), warm (61–79 F) and hot (80 F and above). Of these variables, only treatment was significant for those collected on lawns and both treatment and soil class were significant for those collected in the perimeter.
Table 9. Number of ticks swept from lawns and perimeter by treatment and site.
The mean number of ticks collected over the 4-year period for ticks on the lawn and the mean number of ticks collected in the perimeter are shown in . The mean number of ticks collected on lawns that had never been mulch mowed (0.13) was significantly higher (p < .001, r2 = 0.04) than a mean number of ticks collected on lawns that had been mulch mowed for 1–3 years (0.04) and greater than 4 years (0.03). However, the r-square value for this least square means was only 0.01 indicating that treatment (i.e., mowing practices) accounted for only 1% of the variation in tick numbers. This means that 99% of the variation in tick numbers was due to other variables not measured such as, rural versus urban locations, site size, light exposure, pesticide use, pest and wildlife exclusion in the form of fencing and other deterrents as well as the manner in which leaves are removed from the lawn. In the perimeter, mean number of ticks collected was significantly higher (p = .0016, r2 = 0.01) for lawns that had never been mulch mowed (0.31) than both 1–3 years (0.09) and > 4 years (0.03). Again, the r-square value of 0.04 indicates that 96% of the variation is due to other variables.
Table 10. Mean number of ticks swept from lawns and the perimeter by treatment.
By site, mean number of ticks collected on the lawn of EWC0 (0.51) was significantly greater than all other sites (p<.0001) and those collected in the perimeter at EWC0 (1.1) was significantly greater than all other sites, followed by SKR0 (0.5). Both sites had never been mulch mowed. Again, the r-square of 0.10 (lawn) and 0.20 (perimeter) indicates that site accounted for only 10% and 20% of the variation in tick numbers. Because there was a site difference, least square means for ticks collected both on the lawn and in the perimeter was conducted for each treatment separately (). Treatment groups “0 years” and “1–3 years” each had one site that had a significantly greater mean number of ticks collected on lawns and all three treatment groups had one for ticks collected in the perimeter. This would suggest that although sites were different, they were evenly spread out as far as where ticks may be found, further emphasizing that variables other than mowing practices are at work in the numbers of ticks found on lawns and in the perimeter.
Table 11. Mean number of ticks swept from lawns and the perimeter by site within treatment groups.
As 49.3% of all ticks on the lawn and 48.9% of all ticks in the perimeter were collected from one property, the least square means for ticks collected by treatment on both the lawn and in the perimeter was run without that property. shows the results. A number of ticks collected on lawns was not significant, but mean number of ticks collected in the perimeter of lawns where mulch mowing had never occurred was significantly higher than in the perimeter of lawns where mulch-mowing had been practiced for 1–3 years. However, a mean number of ticks found in the perimeter where mulch mowing had been practiced for greater than 4 years was the same as those found where mulch mowing had never occurred. The r-square of 0.02 further confirms that mowing practices have little to nothing to do with improving tick habitat.
Table 12. Mean number of ticks swept from lawns and the perimeter by treatment.
A comparison of ticks found on the EWC0 and EWC3, the single property with two different leaf management practices, resulted in a significant difference between the two treatments both on the lawn (p = .0004, r-square = 0.09) and in the perimeter (p = .0012, r-square = 0.13, ). Mowing practices accounted for 9 and 13% of the variation in tick numbers, respectively. None of the other variables collected (season, time of day or temperature range at collection) made a difference in the mean number of ticks collected. These differences, along with the poor correlation of treatment to tick numbers indicates that mulch mowing is not an important variable for the presence of ticks, further confirming that this practice will not improve the habitat for ticks.
Table 13. Mean number of ticks swept from the lawn and the perimeter at EWC by treatment.
Site Records
Completion of site records over the 3-year period was spotty. In 2015, 11 of the 14 sites submitted their site records. The missing ones included one from each of the three treatment groups. In 2016, 7 of the 14 sites submitted site records (3 from “0 years”; 2 from “1–3 years”; 2 from “>4 years”). Records for PEA3-1 and PEA3-2 were combined into one property for 2015 and 2016 as the maintenance was the same for both sites on that property. In 2017 only 4 sites submitted records. There were two from the “0 year” group and 2 from the “> 4 year” group. Due to the lack of data, the only information from these records that was analyzed was fuel use for mowing and fuel use for mulch mowing of leaves, or for leaf removal. The amount of fuel used, and the volume of leaves reported by these sites, as well as the size of the property in the study can be found in .
Table 14. Property size, total fuel used for site maintenance and leaf volume over the 3-year study period by treatment and site.
Of the cities, towns and villages contacted, only two villages responded. The information gathered from these two villages is shown in . To compare the fuel use for leaf removal of the three treatments, the amount of fuel used by the two villages that responded was used as the amount needed for the “0 years” treatments regardless of the volume of leaves recorded by the site owner, while actual fuel used divided by the volume of leaves recorded by the site owner was used for the other two treatments.
Table 15. Size of village, total fuel used and volume of leaves picked up by the Village of scarsdale in 2015 and 2016 and the Village of Bronxville in 2016.
The amount of fuel per cubic yard used by site owners (treatments “1–3 years” and “> 4 years”) to mulch mow their total volume of leaves over the study period appears in , along with the average amount of fuel per cubic yard used by the villages above for leaf removal over the same period for treatment “0 years.” Overall, the amount of fuel used to remove leaves (0.1938 gal/cu. yd.) was significantly greater than the fuel/cu. yd. used by those that had mulch mowed for > 4 years (0.0468 gal/cu. yd.), which was significantly greater than the fuel used by sites that had been mulch mowing for 1–3 years (0.0059 gal/cu. yd.). Although these figures are only as good as the records being kept by specific site owners, fuel used for leaf removal by towns averaged 4 and 33 times as much as mulch mowing for lawns that had been using the practice for >4 years and those that had been using the practice for 1–3 years, respectively. This indicates that mulching leaves in place may help to decrease community labor and collection costs and decrease fuel use.
Table 16. Mean fuel used for leaf removal/mulching over the 3 year study period by treatment.
Conclusions
Mulching leaves in place versus hauling and managing them elsewhere was studied for 4 years in Westchester County. This study was conducted to see if mulching leaves in place provided benefits to turf and soil without adding excess nutrients to the soil, smothering the underlying turf, or providing a suitable habitat for insect pests to proliferate. Soil testing showed an advantage in long-term mulch mowing for AWC and soil proteins. On lawns where mulch mowing had been practiced greater than 4 years, the AWC remained the same as sand content increased, indicating that over decades of mulch mowing leaves, the soil had been supplied with enough additional organic matter to allow these coarser textured soils to hold water. Soil proteins, or organically bound nitrogen necessary for plants to thrive, increased significantly over time in soil where mulch mowing had been practiced for greater than 4 years, but did not change in soils where mulch mowing had never occurred or had been practiced for 1–3 years. The chemical properties of the soil in all three treatment groups were within the acceptable range, other than pH, which was low for all three treatment groups. There were no significant treatment differences in any of the other soil health parameters measured and for many of them, including OM, aggregate stability and active carbon, all treatments improved over time. In addition, OQS for all treatments was optimal, indicating that mulch mowing did not have any detrimental effects on the health of the soil.
Concern over excessive nutrients being supplied to the soil from the leaf and duff material being mulched into the lawn was unfounded, as was its effect on turf quality. There were no differences in the concentration of macro or micronutrients in the leaf and duff material between treatments or in the concentration of those nutrients supplied or removed by the leaf litter where that information was available. Although the amount of nitrogen supplied by the leaves was significantly different, linear regression of soil proteins versus nitrogen supplied showed no significant difference between treatments. In addition, there was no difference in percent nitrogen or carbon in the leaf and duff material between treatments over the course of the study. In terms of turf quality, lawns that had been mulch mowed, regardless of a number of years showed significantly higher pest and traffic tolerance than those where leaves had been removed. Drought stress tolerance remained the same on sites where mulch mowing had occurred but decreased where leaves had been removed. All other turf quality parameters were the same for all treatments.
Concern over improving the habitat for ticks was also unfounded. Although there was a significant difference in the mean number of ticks between treatments (a significantly greater number of ticks were found on lawns and in the perimeter of lawns that had never been mulch mowed), the correlation was less than 4% indicating that the presence of ticks on the lawn or in the perimeter is 96% due to other variables not measured in this study. Mulch-mowing is not an important variable for the presence of ticks, thus there should be no concern that this practice will improve the habitat for ticks.
As to the cost to communities for leaf pick-up and transport, the amount of fuel used to remove leaves was significantly greater than that used by those that had mulch mowed for greater than 4 years, which was significantly greater than the fuel used by sites that had been mulch mowing for 1–3 years. Although these figures are only as good as the records being kept by specific site owners, fuel used for leaf removal by towns averaged 4 and 33 times as much as mulch mowing for the two treatment groups. This indicates that mulching leaves in place may help to decrease community labor and collection costs and decreased fuel use. This study was conducted to gain a better understanding of how leaf mulching affects soil and turf quality and insect populations. Based on the results of this 4-year study, mulch mowing of leaves provides some soil health benefits, many turf quality benefits, does not increase the habitat for pests and may use less fuel than community pick-up. This study should help communities, homeowners, and landscapers to make better leaf management decisions.
Disclosure Statement
No potential conflict of interest was reported by the author(s).
Additional information
Funding
References
- Acosta-Martinez, V., Z. Reicher, M. Bischoff, and R. F. Turco. 1999. “The Role of Tree Leaf Mulch and Nitrogen Fertilizer on Turfgrass Soil Quality.” Biology and Fertility of Soils 29 (1): 55–61. https://doi.org/10.1007/s003740050524.
- Bonhotal, J., E. Z. Harrison, M. Schwarz, J. Gruttadaurio, and A. M. Petrovic. 2007. “Using Manure-Based Composts in Turf Maintenance.” Accessed March, 2017. https://hdl.handle.net/1813/7936.
- Carroll, M. C., H. S. Ginsberg, K. E. Hyland, and R. Hu. 1992. “Distribution of Ixodes Dammini (Acari: Ixodidae) in Residential Lawns on Prudence Island, Rhode Island.” Journal of Medical Entomology 29 (6): 1052–1055. https://doi.org/10.1093/jmedent/29.6.1052.
- Kowalewski, A. R., D. D. Buhler, N. S. Lang, M. G. Nair, and J. N. Rogers. 2009. “Mulched Maple and Oak Leaves Associated with a Reduction in Common Dandelion Populations in Established Kentucky Bluegrass.” HortTechnology 19 (2): 297–304. https://doi.org/10.21273/HORTSCI.19.2.297.
- Maupin, G. O., D. Fish, J. Zultowsky, E. G. Campos, and J. Piesman. 1991. “Landscape Ecology of Lyme Disease in a Residential Area of Westchester County, New York.” American Journal of Epidemiology 133 (11): 1105–1113. https://doi.org/10.1093/oxfordjournals.aje.a115823.
- Moebius-Clune, B. N., D. J. Moebius-Clune, B. K. Gugino, O. J. Idowu, R. R. Schindelbeck, A. J. Ristow, H. M. van Es, et al. 2017. ” Comprehensive Assessment of Soil Health Training Manual, Edition 3.2”. Accessed March 2017. http://www.css.cornell.edu/extension/soil-health/manual.pdf.
- Morris, K. N., and R. C. Shearman. 2015 “ NTEP Turfgrass Evaluation Guidelines”. National Turfgrass Evaluation Program Online. Accessed March 5, 2015. http://www.ntep.org/pdf/ratings.pdf
- Nektarios, P., A. M. Petrovic, and D. Sender. 1999. “Tree Leaf Deposition Effect on Kentucky Bluegrass (Poa Pratenses L.).” Journal of Turfgrass Management 3 (1): 69–74.
- Nikolai, T. A., P. E. Rieke, and N. T. McVay. 1998. “Leaf Mulch Forum: Research and Real-World Techniques I. Research.” Proceedings of the 68th Annual Michigan Turfgrass Conference 27: 66–68. Accessed February 27, 2014. http://archive.lib.msu.edu/tic/mitgc/article/199866a.pdf
- Nikolai, T. A., P. E. Rieke, D. E. Karcher, B. Leinauer, J. Makk, and J. Bristol. 2000. “Turfgrass Cultural Practices Report.” Proceedings of the 70th Annual Michigan Turfgrass Conference 29: 36–38. Accessed February 27, 2014. http://archive.lib.msu.edu/tic/mitgc/article/200036b.pdf
- NYS Department of Environmental Conservation. 2010. “Beyond Waste A Sustainable Materials Management Strategy for New York State”. Accessed February 27, 2014. http://www.dec.ny.gov/docs/materials_minerals_pdf/frptbeyondwaste.pdf
- Reicher, Z. and G. Hardebeck. 2000. “Mulching Tree Leaves: An Alternative to Disposal.” Grounds Maintenance 35 (8): 18–21.
- Rieke, P. E., B. E. Branham, D. W. Lickfeldt, and T. A. Nikolai. 1993. “Effect of Mulching Tree Leaves into Turfgrass.” Proceedings of the 63rd Annual Michigan Turfgrass Conference 22: 245–251. Accessed February 27, 2014. http://archive.lib.msu.edu/tic/mitgc/article/1993245.pdf
- Rutgers Cooperative Extension. 2000. “Leaf Mulching in New Jersey – 10 year Impacts Research Summary”. Accessed February 27, 2014. http://njsustainingfarms.rutgers.edu/assets/leafmulch/Leaf_Mulch_10YR_Impact_Kluchinski.pdf
- Ward, S. E., and R. D. Brown. 2004. “A Framework for Incorporating the Prevention of Lyme Disease Transmission into the Landscape Planning and Design Process.” Landscape and Urban Planning 66 (2): 91–106. https://doi.org/10.1016/S0169-2046(03)00097-5.